Cumulative Delta: Buying and Selling Pressure as Candles
Introduction
Volume tells you how much traded. It does not tell you who was in control. A bar with heavy volume that closes on its high is a very different event from the same volume closing on its low, and a plain volume histogram treats them the same.
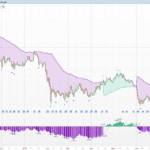
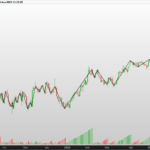
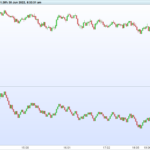
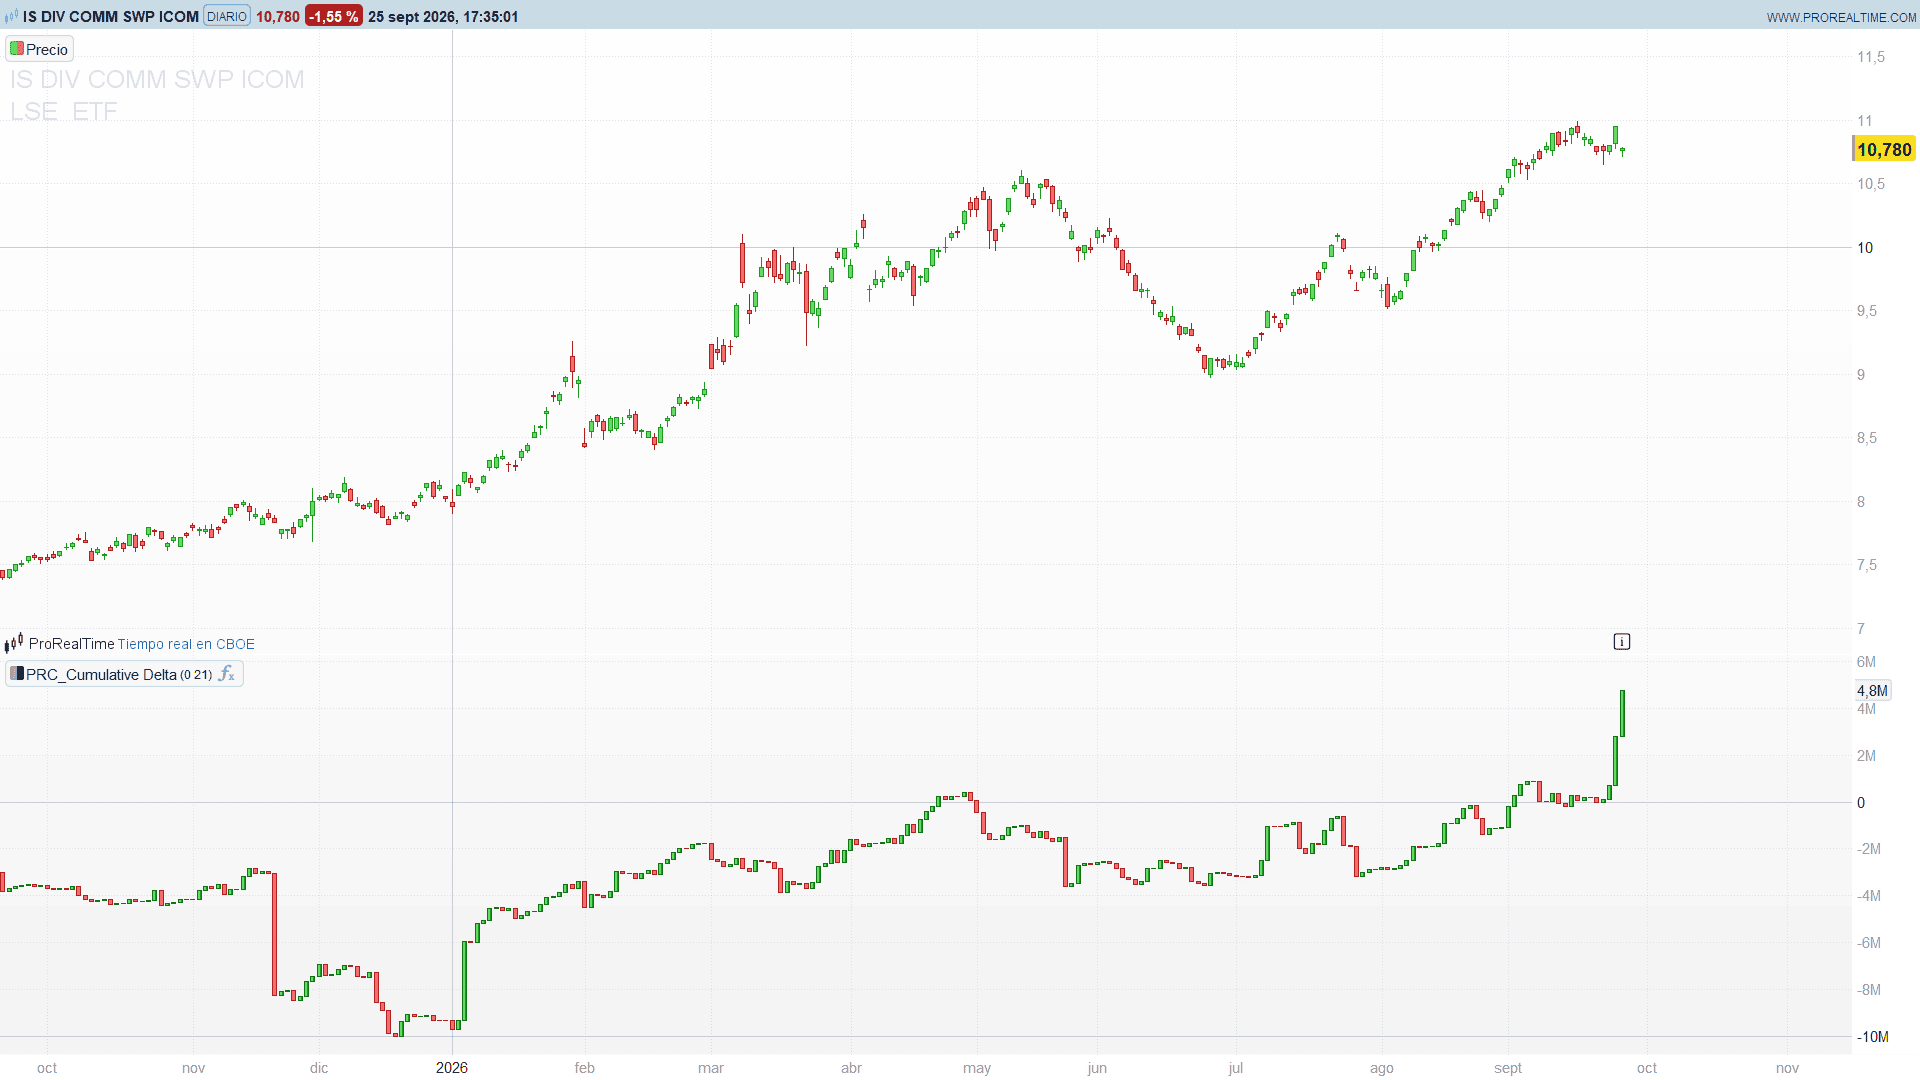
Cumulative Delta, by TFlab (TradingFinder), splits the volume of every bar into a buying part and a selling part based on where the bar closes, takes the difference, and accumulates it. The result is drawn in its own panel as a chart of candles: each candle opens where the previous value was and closes at the current one, green when the delta pushed the line up and red when it pushed it down. You read it like a price chart of pressure.
Three accumulation modes let you choose the horizon: the running total since the start of the history, a rolling sum over a fixed number of bars, or an exponential average.
Theory Behind the Indicator
Estimating buying and selling volume from the close
Without tick data you cannot know how much of the volume hit the ask and how much hit the bid. This indicator uses a simple and widely used estimate: the close location inside the bar.
buying  = volume * (close - low)  / (high - low)
selling = volume * (high - close) / (high - low)
delta   = buying - selling
A close on the high assigns the whole volume to buyers. A close on the low assigns it all to sellers. A close in the middle splits it evenly and the delta is zero. It is an approximation of order flow, not a measurement of it, and it should be read that way: it captures who won the bar, weighted by how much traded.
A bar with no range at all (high equal to low) has no close location to read, so its delta is zero.
Three ways to accumulate
- Total: the delta of every bar is added to a running sum from the first bar of the loaded history. This is the classic cumulative delta line. Its absolute level depends on how much history is loaded, so what matters is the slope and how it compares to price.
- Periodic: a rolling sum of the last N bars. It answers a more local question: over the last N bars, did buyers or sellers dominate, and by how much. It oscillates around zero.
- EMA: an exponential average of the delta over N bars. Similar horizon to the periodic mode, but smoother and weighted toward the most recent bars.
Drawn as candles
Each value is drawn as a candle body from the previous value to the current one. A green body means the accumulated delta rose on that bar, a red body means it fell. The candles make the rhythm of the pressure easy to see: long green runs, hesitation, and the first red bodies when buyers stop winning.
Key Features at a Glance
- Volume split into buying and selling pressure from the close location
- Three accumulation modes: Total, Periodic and EMA
- Candle style display in a separate panel, green when the delta rises and red when it falls
- One period setting shared by the Periodic and EMA modes
- The accumulated value is available for alerts and the cursor readout
How to Read the Indicator
- Direction of the candles: a run of green candles means sustained buying pressure, a run of red candles sustained selling pressure.
- Agreement with price: price making new highs while the cumulative delta also makes new highs is a healthy move backed by buying.
- Divergence: price making a new high while the cumulative delta fails to confirm it means the rally is happening on weaker buying. The mirror case applies to lows.
- Periodic and EMA modes around zero: above zero, buyers have dominated over the chosen window; below zero, sellers have. Crossings of zero mark a change in who controls the window.
- Size of the bodies: large bodies come from high volume bars that closed near an extreme. Those are the bars that moved the balance.
Practical Applications
- Confirmation of breakouts. A breakout of a range with a strong green delta candle and a cumulative line breaking its own range has buying behind it. A breakout with a flat or red delta is suspect.
- Divergence spotting. Use the Total mode on the same timeframe as price and look for highs and lows that price makes and the delta does not.
- Trend health. In a trend, pullbacks with small opposite delta candles are normal. Pullbacks with large opposite delta candles show the other side stepping in.
- Short term filter. The Periodic mode with a short period works as a simple filter: take longs only while it is above zero and shorts only while it is below.
Indicator Configuration
cumMode(default: 0): accumulation mode. 0 = Total (running sum), 1 = Periodic (rolling sum), 2 = EMA.period(default: 21): number of bars used by the Periodic and EMA modes. It has no effect in Total mode.
The indicator needs volume. On instruments where the feed has no volume, or only tick volume, the delta will be zero or only indicative. For currency pairs, applying it on the corresponding futures contract gives a more representative reading.
Code
//-------------------------------------//
//PRC_Cumulative Delta
//version = 0
//22.09.26
//Iván González @ www.prorealcode.com
//Author: TradingFinder
//Sharing ProRealTime knowledge
//-------------------------------------//

//-------------------------------------//
// Inputs
//-------------------------------------//
cumMode = 0    // 0 = Total (running sum), 1 = Periodic (rolling sum), 2 = EMA
period  = 21   // Length used by the Periodic and EMA modes

//-------------------------------------//
// Buying and selling volume
// The close location inside the bar splits the volume: a close on
// the high is all buying, a close on the low is all selling.
//-------------------------------------//
barRng = high - low
IF barRng > 0 THEN
   buyVol  = volume * ((close - low) / barRng)
   sellVol = volume * ((high - close) / barRng)
ELSE
   // Flat bar (high = low): no location to split, no delta
   buyVol  = 0
   sellVol = 0
ENDIF
delta = buyVol - sellVol

//-------------------------------------//
// Cumulative delta in the selected mode
//-------------------------------------//
once cumTotal = 0
cumTotal = cumTotal + delta

IF cumMode = 1 THEN
   cumD = summation[period](delta)
ELSIF cumMode = 2 THEN
   cumD = average[period,1](delta)
ELSE
   cumD = cumTotal
ENDIF

//-------------------------------------//
// Candles: open at the previous value, close at the current one
//-------------------------------------//
IF barindex > period THEN
   cOpen = cumD[1]
   IF cumD >= cOpen THEN
      cr = 76
      cg = 175
      cb = 80
   ELSE
      cr = 255
      cg = 82
      cb = 82
   ENDIF
   DRAWCANDLE(cOpen, max(cOpen, cumD), min(cOpen, cumD), cumD) COLOURED(cr, cg, cb)
ENDIF

// The line is transparent: it only sets the panel scale and exposes
// the value for alerts and the cursor readout.
RETURN cumD AS "Cumulative Delta" COLOURED(128, 128, 128, 0)
Conclusion
Cumulative Delta turns an ordinary volume column into a story about control: who won each bar, how decisively, and whether that balance is building or fading. Drawn as candles and available over three horizons, it gives a quick read of the pressure behind a move and a clean way to spot moves that price makes on its own.