




More from ProRealCode
ProRealCode - Trading & Coding with ProRealTime™



Dual-Phase Reversal - Exhaustion Sequences, Range Pivots and Volume Pressure
1. Introduction
Every trend ends, and almost none of them end because an indicator crossed a line. They end because the side that was pushing runs out of people to push with. The problem is that this looks exactly like a trend that is still working, right up until it is not.
The Dual-Phase Reversal study, by dgt, attacks that with a counting framework rather than a smoothing one. Nothing here is averaged. The chart is read as a sequence of bar-to-bar relationships, and a reversal is only considered once a specific number of those relationships have stacked up in the same direction. Counting, unlike smoothing, has no lag to speak of: the ninth bar of a sequence is flagged on the ninth bar.
Readers who know the work of Tom DeMark will recognise the skeleton immediately, and it is worth saying so plainly: the two phases here are the TD Setup and the TD Countdown, with the perfection rule and the bar-13 qualifier intact. What the study adds on top is the part worth paying attention to – the levels each completed phase leaves behind, the invalidation prices, a volume pressure oscillator and a state dashboard.
A count is not a signal. It is a statement that a move has been running in one direction for long enough to be worth doubting, which is a different and more useful thing.
2. How It Works
Momentum Exhaustion – the nine
The first phase compares each close with the close four bars back. Nine consecutive bars closing on the same side of that comparison complete the phase.
The detail that makes this more than a counter is where a count is allowed to start. A new sequence only opens on the bar where that four-bar relationship flips sides – the previous bar closed above its own four-bar reference and this one closes below it. Without that rule the count would restart in the middle of any move that happened to run long enough, and it would be counting nothing in particular. With it, every sequence is anchored to a genuine change of pressure.
A sequence is qualified when bar eight or bar nine also takes out the extreme of bars six and seven. That says the last leg of the move was still making progress at the moment the count completed, which is the textbook shape of a move spending its last buyers rather than drifting to a halt. Qualified sequences are marked with a q.
Terminal Exhaustion – the thirteen
The second phase picks up where the ninth bar left off and counts to thirteen, using a different and stricter test: each qualifying bar must close beyond the extreme of two bars back. These thirteen bars do not have to be consecutive. A bar that fails the test simply does not count, and the sequence holds its number and waits.
Three things cancel the phase outright:
- Price closes through the level the momentum phase left behind. The premise is broken.
- The opposite side completes its own nine. The market changed its mind.
- The count reaches thirteen. It is done.
Bar thirteen carries an extra condition of its own: it must also break the extreme recorded back at bar eight. A thirteen that qualifies on its close but not on its extreme is pushed back to twelve and marked with a +. The phase then waits for a bar that satisfies both. This single rule is what separates a count that merely reached the end from one that reached the end while still extending.
The levels each phase leaves behind
A completed momentum phase leaves two things on the chart.
Support and resistance. The extreme of the nine bars becomes an active level and stays on the chart until price closes through it. It is not decoration: it is the same level the terminal phase watches to decide whether it is still alive.
Invalidation. The extreme bar of the sequence is projected one full bar range beyond its own extreme. If price closes there, the sequence failed as a floor or a ceiling and there is nothing left to wait for. The terminal phase computes its own version over the range it travelled through.
Range Pivot
Support, Pivot and Resistance calculated from the last completed higher timeframe range, using DeMark’s weighting rather than the usual arithmetic mean. The range is not weighted evenly: an up candle counts its high twice, a down candle counts its low twice, and a candle that closes where it opened counts its close twice. Two candles with identical highs and lows therefore produce different levels depending on which way they closed, which is the whole point of the method – it places the pivot on the side where price actually settled.
A developing pivot can also be plotted: the same arithmetic applied to the range still being built, updating as it goes. It is a preview of the next set of levels, not a level to trade.
Volume Pressure
Each bar is asked how much of its own range it travelled in one direction, and that share is weighted by the volume that traded while it did. A bar that closes at the top of a wide range on heavy volume contributes a great deal of buying pressure. A bar that closes mid-range, or one that barely traded, contributes almost nothing whichever way it went.
Summing both sides over a window and reading buying as a percentage of the total gives a 0 to 100 scale. Above 50 the window was bought, below 50 it was sold.
It is worth being clear that this is not a price oscillator. Price can make a higher high while this reads lower than it did on the previous one, and that gap is the entire point: the second leg was carried by less size than the first. That divergence, sitting under a completed sequence, is a far stronger statement than either piece on its own.
3. Reading the Indicator
The colours look backwards and are not. A buy-side sequence is marked in red, a sell-side one in teal. Each colour describes a different thing. The step numbers describe the move that is under way – a buy-side count is a decline, so red. The completion marker describes the reversal being flagged – a completed buy-side count points up, so teal.
What you will see on the chart:
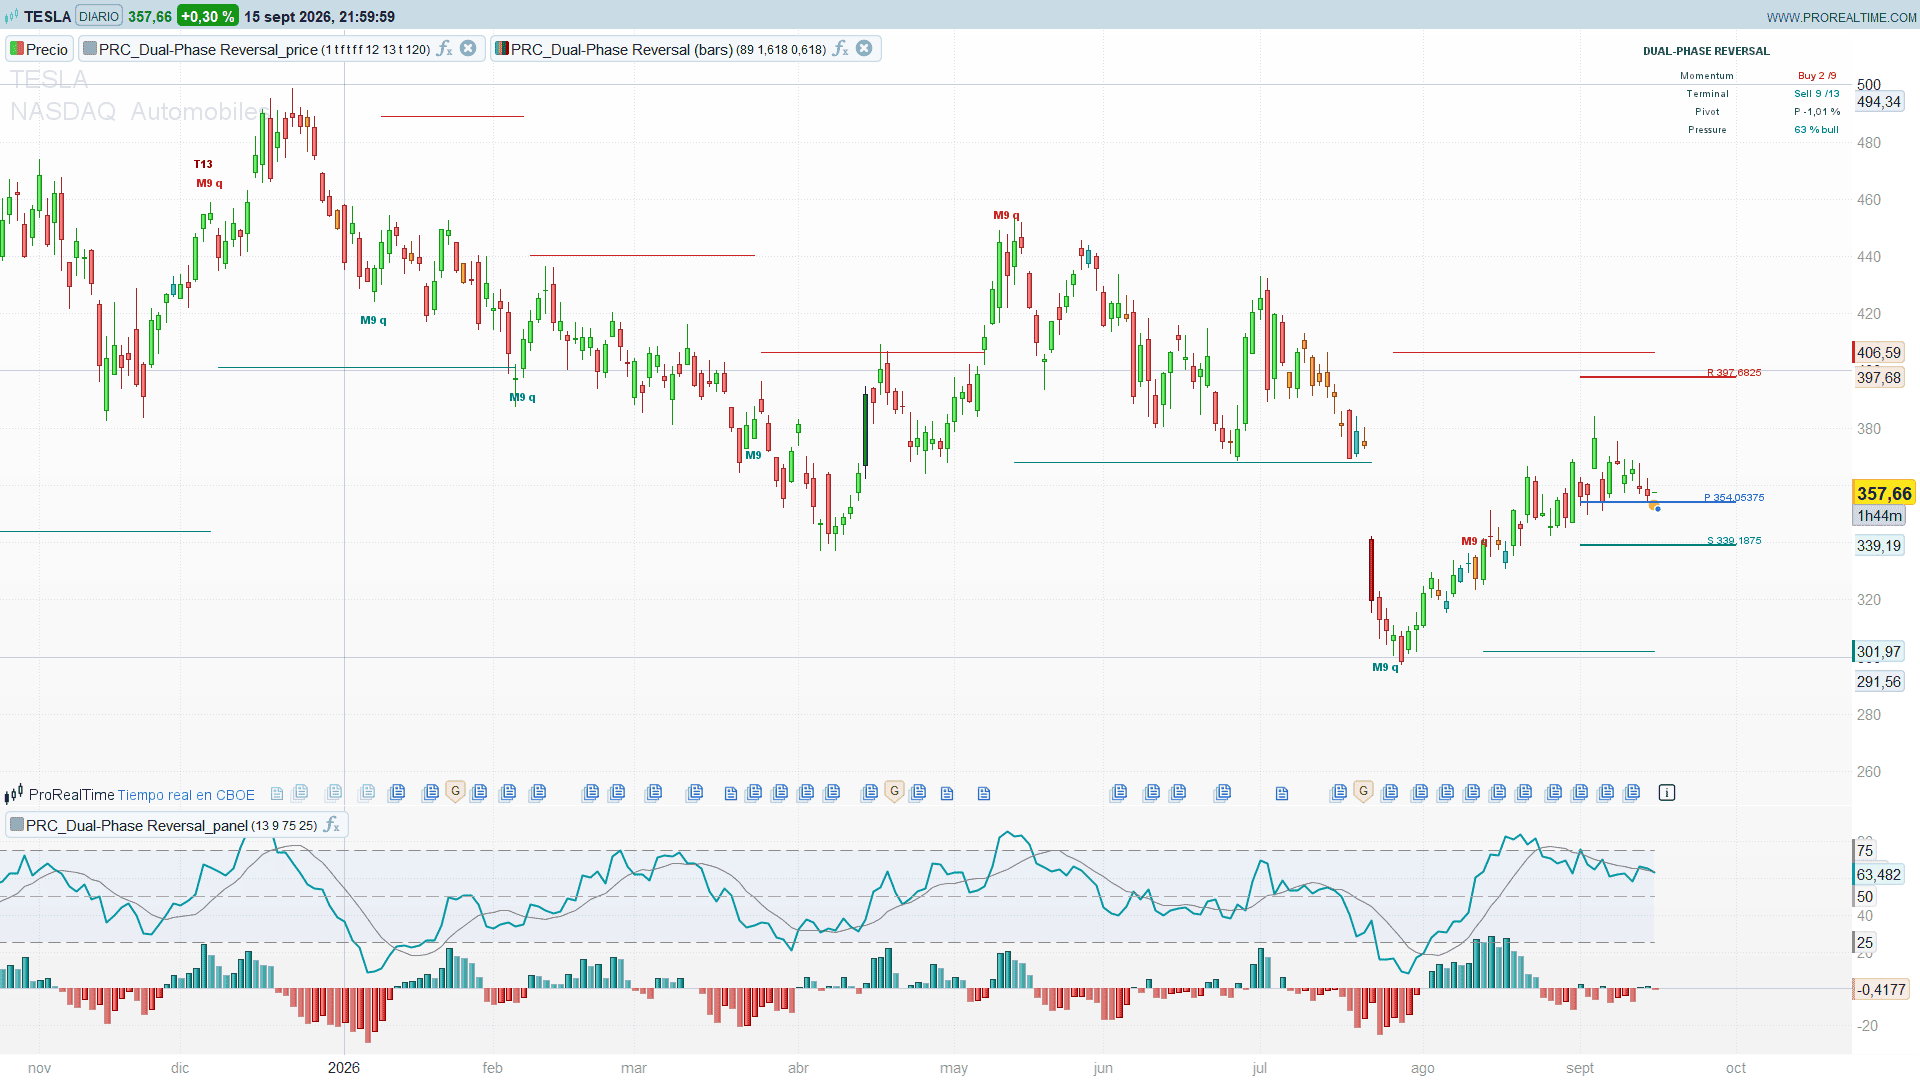
M9below or above a bar – a momentum phase just completed.M9 qif it was qualified.T13– a terminal phase just completed. Deep green below price for a buy side, deep red above for a sell side.1to9and1to13– the individual steps, when step display is switched on.+– a thirteen that was pushed back to twelve and is waiting.- A horizontal line held after
M9– the active support or resistance. - Dotted markers – the invalidation prices, off by default.
Everything is read on the last closed bar. A count of nine is a statement about nine closes, so nothing is counted until the bar closes. In real time that means a completed sequence is marked when the next bar opens, not while the ninth one is still forming. The trade is deliberate: a count that updated live would walk up and back down inside the candle, and a nine that is about to be undone looks exactly like a nine that will hold. Before the open it matters most, because there the live bar is a single print with almost no range and almost no volume.
The dashboard, top right, holds four rows: the momentum count and its side, the terminal count and its side, the signed percentage distance to the nearest pivot level, and the current pressure reading as a bull or bear percentage.
4. Trading Applications
Do not trade the count on its own. A nine in a strong trend is frequently just a nine, and the trend continues through it. The framework is built to be read in layers, and the layers are what carry the information.
The confluence worth waiting for. A completed sequence that lands on or near a pivot level, with volume pressure diverging from price, is the configuration all three pieces were built to describe together. The count says the move is stretched, the pivot says there is a reason for it to stop here, and the pressure says the last leg was carried by less size than the one before it. Each of the three is weak alone. Together they are a case.
Qualification is a filter, not an ornament. Both the q on a momentum phase and the bar-13 rule on a terminal phase exist to reject sequences that merely ran out of bars, as opposed to sequences that ran out of buyers. If you are going to ignore one part of this framework, do not let it be these.
Use the invalidation levels as what they are. They are not stop losses sized to your account. They are the price at which the premise is wrong, which is a different question from how much you are willing to lose. They answer the first one.
On the higher timeframe. The range pivot has to be set to a timeframe above your chart, and the comment block in the code lists which line to leave active for each one. Leaving it at the same timeframe as the chart is the one mistake that does not announce itself: it draws a perfectly correct pivot of the previous candle of your own chart, which is not a higher timeframe range at all. Two things give it away, and the dashboard says so when it happens – the three lines come out stacked, because the distance from R to S is the range of that candle, and they anchor to the last bar instead of to the start of the range.
5. Parameters
Phase display
phaseMode–0hides the markers,1shows only completed phases,2shows every step. Default1. Setting2fills the chart quickly; raisemaxMkif you use it.showSR– the support and resistance levels left by a completed momentum phase. Default on.showInv– the invalidation prices. Default off.
Range pivot
showPivot– levels from the last completed range. Default on.showDev– levels from the range still being built. Default off.showHist– the levels of every past range, drawn as a series across the chart. Default off.
Volume pressure
presLen– bars summed into the pressure reading. Default 13. This value appears in two files and must match in both.sigLen,upBand,lowBand– the signal average and the two bands, in the panel file.
Volume-weighted candles
volLen– the volume moving average. Default 89.upMult/lowMult– how far from that average a candle has to be before it is repainted. Defaults 1.618 and 0.618.
Display
showDash,dashX,dashY,dashCol– the dashboard and its position in pixels.maxMk– how many phase markers are kept on the chart. Default 120.
6. The Three Files
The study comes as three indicators that work together and can be used independently.
PRC_Dual-Phase Reversal goes on the price. It carries the two exhaustion phases, the levels, the range pivots and the dashboard. If you only load one, load this one.
PRC_Dual-Phase Reversal (pressure) goes in its own panel. It plots the volume pressure oscillator with its bands and histogram. A 0 to 100 reading and a price scale are two different scales, and giving the oscillator its own axis means 75 is actually at 75 and can be read off the chart instead of inferred from the shape.
PRC_Dual-Phase Reversal (bars) goes on the price, alongside the first. It repaints candles whose volume is far from its own average, in either direction: heavy candles in a deep colour, thin candles in a light one, everything ordinary left alone. Read it against the phase markers – a completed sequence on a heavy candle is a different proposition from the same sequence on a thin one.
7. Dual-Phase Reversal Code
Part 1 – the price chart
//---------------------------------------------------------------------------//
//PRC_Dual-Phase Reversal
//version = 0
//16.09.2026
//Ivan Gonzalez @ www.prorealcode.com
//Author: dgtrd
//Sharing ProRealTime knowledge
//---------------------------------------------------------------------------//
//PART 1 of 3 - THE PRICE CHART. Apply this one ON the price.
//The companion indicators are PRC_Dual-Phase Reversal (pressure), which plots
//the Volume Pressure oscillator in its own window, and PRC_Dual-Phase Reversal
//(bars), which paints the volume-weighted candles.
//---------------------------------------------------------------------------//
//Two exhaustion sequences that run one after the other.
//
//MOMENTUM EXHAUSTION counts nine bars closing on the same side of the close
//four bars back. The count only starts on the bar where that relationship
//flips, so a sequence is always anchored to a genuine change of pressure and
//not to the middle of a move that was already under way. Reaching nine says
//the move has been pushing in the same direction for long enough to be worth
//doubting. A sequence is QUALIFIED when bar eight or bar nine also takes out
//the extreme of bars six and seven: the last leg was still making progress,
//which is the textbook shape of a move running out of participants.
//
//TERMINAL EXHAUSTION starts where the ninth bar left off and counts thirteen
//bars, not consecutive, that close beyond the extreme of two bars back. It is
//cancelled if price crosses the level the momentum phase left behind, or if the
//opposite side completes its own nine. Bar thirteen only counts when it also
//breaks the extreme recorded at bar eight; if it does not, the count waits on
//twelve and a plus sign marks the attempt.
//
//The RANGE PIVOT is a DeMark pivot of the last closed higher timeframe candle:
//the arithmetic weights the range towards the close, so an up candle and a down
//candle of identical range produce different levels.
//---------------------------------------------------------------------------//
//THE WHOLE ENGINE RUNS ON THE LAST CLOSED BAR. A count of nine is a statement
//about nine closes, so nothing is counted until the bar closes. In real time
//that means one bar of delay; what it buys is a count that does not walk up
//and back down inside the candle, and a dashboard that is not reporting a
//half-formed bar as if it were data. On history it changes nothing, because
//there every bar is closed.
//---------------------------------------------------------------------------//
//The pivot lines are projected forward and grow with every bar, and the
//dashboard is a picture of the state right now, so the previous pass has to be
//wiped or each incoming bar would stack another copy on top of the old one.
//The phase markers survive because they are repainted in full from a ring
//buffer, not because they are left over from an earlier pass.
DEFPARAM drawonlastbaronly = true

//-----Phase display---------------------------------------------------------//
phaseMode = 1     //0 = no markers, 1 = completed phases only, 2 = every step
showSR    = 1     //1 = momentum support and resistance levels
showInv   = 0     //1 = momentum and terminal invalidation levels

//-----Range pivot-----------------------------------------------------------//
showPivot = 1     //1 = pivot of the last CLOSED higher timeframe range
showDev   = 0     //1 = pivot of the range still being built, updates live
showHist  = 0     //1 = the levels of every past range, drawn as a series
//The pivot lines are projected one full range forward, which is where the next
//range ends if it lasts as long as the one that produced the levels. When the
//block below is set to the SAME timeframe as the chart, a range is one bar
//long and that projection is one bar wide: three labels stacked on a stub you
//cannot read a level off. This is the floor, in bars.
pvMinLen  = 12

//-----Volume pressure (dashboard reading only)------------------------------//
//The oscillator itself lives in the companion panel indicator. It is computed
//again here, on the same settings, only to fill the dashboard row. If you
//change presLen there, change it here too.
presLen   = 13

//-----Dashboard-------------------------------------------------------------//
showDash  = 1
dashX     = -210  //label column, pixels from the right border
dashY     = -20   //top row, pixels from the top border
dashCol   = 110   //pixel gap between the label and the value column

//-----Ring buffer-----------------------------------------------------------//
maxMk     = 120   //phase markers kept on the chart

//-----Colours---------------------------------------------------------------//
//A BUY-side sequence is marked in red and a SELL-side one in teal, which reads
//backwards until you see what each colour is describing: the step numbers
//describe the move that is under way (a buy-side count is a decline, so red),
//and the completion marker describes the reversal being flagged (a completed
//buy-side count points up, so teal).
bullR = 0
bullG = 128
bullB = 128
bearR = 200
bearG = 30
bearB = 30
//Deep green and deep red for the two completion markers.
okR   = 0
okG   = 100
okB   = 0
koR   = 145
koG   = 0
koB   = 0
//Invalidation levels and dashboard text. Mid grey rather than near-white:
//ProRealTime charts are light by default and a near-white stroke IS the
//background.
invR  = 40
invG  = 90
invB  = 200
txtR  = 95
txtG  = 95
txtB  = 95

//---------------------------------------------------------------------------//
//                        HIGHER TIMEFRAME FOR THE PIVOT                     //
//---------------------------------------------------------------------------//
//READ THIS BEFORE CHANGING THE CHART TIMEFRAME. ProRealTime only reads UPWARDS
//and the timeframe has to be a constant, so the range is picked by uncommenting
//a line, and the one you leave active HAS TO BE ABOVE your chart. Left column
//is the chart you are looking at, right column is the line to leave active:
//   chart 1 to 3 min      ->  timeframe(1 hour)
//   chart 5 to 15 min     ->  timeframe(4 hours)
//   chart 30 min to 1 hour->  timeframe(daily)
//   chart 2 to 4 hours    ->  timeframe(weekly)
//   chart daily           ->  timeframe(monthly)   <- default
//   chart weekly          ->  timeframe(monthly), the highest one offered here
//
//Leaving it at the SAME timeframe as the chart is the one mistake that does not
//announce itself. It compiles, it draws, and the levels it draws are a correct
//pivot - of the previous candle of your own chart, which is not a higher
//timeframe range at all. Two things give it away, and the dashboard says so
//when it happens: the three lines come out stacked on top of each other,
//because the distance from R to S IS the range of that candle; and they are
//anchored to the last bar instead of to the start of the range, because when
//every bar is its own range the range starts on the bar you are standing on.
//
//This does NOT change your chart, it only changes which range the pivot is
//measured on. No updateonclose here on purpose: the block has to see the
//candle that is still forming, because that is what the developing pivot is.
//The completed pivot reads index [1], which is already closed and cannot
//repaint whatever the live candle does.
//---------------------------------------------------------------------------//
//timeframe(1 hour)
//timeframe(4 hours)
//timeframe(daily)
//timeframe(weekly)
timeframe(monthly)
hOc = open[1]
hHc = high[1]
hLc = low[1]
hCc = close[1]
hOd = open
hHd = high
hLd = low
hCd = close
timeframe(default)

//---------------------------------------------------------------------------//
//                                   STATE                                   //
//---------------------------------------------------------------------------//
//A ring of maxMk + 1 slots. The spare slot is the one the write position sits
//on and it is never read: it absorbs a marker written on one tick of the live
//bar and withdrawn on the next, because arrays are NOT rewound between ticks
//the way scalars are.
mkRing = maxMk + 1
//Measured on the CLOSED bar, so the deepest read of the engine is close[6] on
//the raw series. Nothing can be counted before there is that much history.
minBars = 6

IF barindex = 0 THEN
   nMk      = 0
   buyCnt   = 0
   sellCnt  = 0
   meRes    = 0
   meSup    = 0
   buyLowe  = 0
   buyHigh  = 0
   buyInv   = 0
   sellHighe = 0
   sellLow  = 0
   sellInv  = 0
   teBuyOn  = 0
   teSellOn = 0
   teBuyCnt = 0
   teSellCnt = 0
   teBuyRef = 0
   teSellRef = 0
   teBuyHighe = 0
   teBuyLowe  = 0
   teBuyHigh  = 0
   teBuyLow   = 0
   teBuyTgt   = 0
   teBuyInv   = 0
   teSellHighe = 0
   teSellLowe  = 0
   teSellHigh  = 0
   teSellLow   = 0
   teSellTgt   = 0
   teSellInv   = 0
   rngStart = 0
   rngPrev  = 0
   resHold   = 0
   supHold   = 0
   bInvHold  = 0
   sInvHold  = 0
   tbInvHold = 0
   tsInvHold = 0
ENDIF

//---------------------------------------------------------------------------//
//                          THE BAR THE ENGINE READS                         //
//---------------------------------------------------------------------------//
//Everything below runs on the LAST CLOSED BAR, never on the one still being
//built. That is not a matter of taste: a count of nine is a statement about
//nine CLOSES, and a close that has not happened yet is not a close. Reading
//the live bar lets the count walk up and back down inside the candle - a nine
//that appears, is gone on the next tick and comes back - and a level that is
//armed and disarmed with it. On a five minute chart that happens all day. And
//before the open it is worse: the live bar is a single print with almost no
//range and almost no volume, so every reading derived from it, the dashboard
//included, is noise dressed as data.
//
//What it costs: one bar of delay in real time. A sequence that completes on
//the close of bar nine is marked when bar ten opens. On history nothing
//changes at all, because there every bar is already closed.
//
//EVERY price the engine reads comes from this block. Nothing below touches
//close, high or low directly, because the moment one raw read slips in it is
//reading a different bar from everything around it and nothing says so.
//Reading x[n] on the live bar is reading x[n + 1] here.
cIdx = barindex - 1
cC  = close[1]
cC1 = close[2]
cC4 = close[5]
cC5 = close[6]
cH  = high[1]
cH1 = high[2]
cH2 = high[3]
cH3 = high[4]
cL  = low[1]
cL1 = low[2]
cL2 = low[3]
cL3 = low[4]
hi9 = highest[9](high)[1]
lo9 = lowest[9](low)[1]

atrOff = averagetruerange[14](close)[1]
IF atrOff = undefined OR atrOff <= 0 THEN
   atrOff = max(cH - cL, pointsize)
ENDIF

//---------------------------------------------------------------------------//
//                            MOMENTUM EXHAUSTION                            //
//---------------------------------------------------------------------------//
//Nine bars closing beyond the cC four bars back. The count can only be
//opened on the bar where that comparison flips sides, which is what the
//cC1 against cC5 test is doing: without it the count would restart
//in the middle of any move that happened to be long enough.
IF cIdx < minBars THEN
   buyCnt  = 0
   sellCnt = 0
ELSIF cC < cC4 THEN
   IF buyCnt = 0 OR buyCnt = 9 THEN
      IF cC1 > cC5 THEN
         buyCnt = 1
      ELSE
         buyCnt = 0
      ENDIF
   ELSE
      buyCnt = buyCnt + 1
   ENDIF
   sellCnt = 0
ELSIF cC > cC4 THEN
   IF sellCnt = 0 OR sellCnt = 9 THEN
      IF cC1 < cC5 THEN
         sellCnt = 1
      ELSE
         sellCnt = 0
      ENDIF
   ELSE
      sellCnt = sellCnt + 1
   ENDIF
   buyCnt = 0
ELSE
   buyCnt  = 0
   sellCnt = 0
ENDIF

//A qualified sequence is one where the last leg was still making progress:
//bar eight or bar nine takes out the extreme of bars six and seven. Read on
//the bar being marked, so the offsets are 2 and 3 back.
buyQual = 0
IF (cL <= cL3 AND cL <= cL2) OR (cL1 <= cL3 AND cL1 <= cL2) THEN
   buyQual = 1
ENDIF
sellQual = 0
IF (cH >= cH3 AND cH >= cH2) OR (cH1 >= cH3 AND cH1 >= cH2) THEN
   sellQual = 1
ENDIF

//-----Levels left behind by a completed sequence----------------------------//
//The highest cH of the nine bars becomes resistance and stays on the chart
//until price closes through it. Crossing it is what says the exhaustion read
//was wrong, which is why the terminal phase below watches the same level.
IF buyCnt = 9 THEN
   meRes = hi9
   resHold = 0
ELSIF cC > meRes THEN
   meRes = 0
   resHold = 0
ELSE
   resHold = 1
ENDIF
IF sellCnt = 9 THEN
   meSup = lo9
   supHold = 0
ELSIF cC < meSup THEN
   meSup = 0
   supHold = 0
ELSE
   supHold = 1
ENDIF

//-----Invalidation of the momentum phase------------------------------------//
//The lowest bar of the sequence, projected one full bar range below its own
//cL. Price closing there says the sequence failed as a floor.
IF buyCnt = 1 THEN
   buyLowe = cL
ENDIF
IF buyCnt > 0 THEN
   buyLowe = min(cL, buyLowe)
   IF cL = buyLowe THEN
      buyHigh = cH
   ENDIF
ENDIF
IF buyCnt = 9 THEN
   buyInv = 2 * buyLowe - buyHigh
   bInvHold = 0
ELSIF cC < buyInv THEN
   buyInv = 0
   bInvHold = 0
ELSE
   bInvHold = 1
ENDIF

IF sellCnt = 1 THEN
   sellHighe = cH
ENDIF
IF sellCnt > 0 THEN
   sellHighe = max(cH, sellHighe)
   IF cH = sellHighe THEN
      sellLow = cL
   ENDIF
ENDIF
IF sellCnt = 9 THEN
   sellInv = 2 * sellHighe - sellLow
   sInvHold = 0
ELSIF cC > sellInv THEN
   sellInv = 0
   sInvHold = 0
ELSE
   sInvHold = 1
ENDIF

//---------------------------------------------------------------------------//
//                     TERMINAL EXHAUSTION - BUY SIDE                        //
//---------------------------------------------------------------------------//
//Thirteen bars closing at or below the cL of two bars back. They do NOT have
//to be consecutive: the count simply holds its value on a bar that does not
//qualify. The phase is cancelled when price closes above the resistance the
//momentum phase left behind, or when the other side completes its own nine.
teBuyCond = 0
IF cC <= cL2 THEN
   teBuyCond = 1
ENDIF
//Bar thirteen has to break the cL recorded at bar eight, not just qualify.
//Read BEFORE bar eight writes its reference below, so a bar that is both an
//eight and a failed thirteen is tested against the PREVIOUS reference.
teBuyFail = 0
IF teBuyCond = 1 AND cL >= teBuyRef THEN
   teBuyFail = 1
ENDIF

IF buyCnt = 9 AND teBuyCnt = 0 THEN
   teBuyOn = 1
ELSIF sellCnt = 9 OR teBuyCnt = 13 OR cC > meRes THEN
   teBuyOn = 0
ENDIF

//teBuyAdv says the count moved ON THIS BAR, which is what decides whether a
//marker is printed and whether bar eight writes its reference. Reading it off
//a comparison against the previous bar would be reading a variable that is
//deliberately left unassigned on a bar that does not qualify.
teBuyAdv = 0
IF teBuyOn = 1 THEN
   IF buyCnt = 9 THEN
      IF teBuyCond = 1 THEN
         teBuyCnt = 1
         teBuyAdv = 1
      ELSE
         teBuyCnt = 0
      ENDIF
   ELSIF teBuyCond = 1 THEN
      teBuyCnt = teBuyCnt + 1
      teBuyAdv = 1
   ENDIF
ELSE
   teBuyCnt = 0
ENDIF
IF teBuyCnt = 13 AND teBuyFail = 1 THEN
   //Thirteen qualified on the cC but not on the cL, so it is pushed back
   //and waits. The count did not advance: it went up and came straight back.
   teBuyCnt = 12
   teBuyAdv = 0
ENDIF

IF teBuyAdv = 1 AND teBuyCnt = 8 THEN
   teBuyRef = cC
ENDIF

//-----Terminal target and invalidation--------------------------------------//
//Both sides of the range the terminal phase travelled through, projected one
//bar range beyond the extreme that made it. The target is never drawn - it is
//never drawn, but it has to be computed because the invalidation level reads
//it to know whether the phase is still alive.
IF teBuyCnt = 1 THEN
   teBuyLowe  = cL
   teBuyHighe = cH
ENDIF
IF teBuyOn = 1 THEN
   teBuyHighe = max(cH, teBuyHighe)
   teBuyLowe  = min(cL, teBuyLowe)
   IF cH = teBuyHighe THEN
      teBuyLow = cL
   ENDIF
   IF cL = teBuyLowe THEN
      teBuyHigh = cH
   ENDIF
ENDIF

//Order matters: the target reads the invalidation level of the PREVIOUS bar,
//and the invalidation level reads the target already updated on THIS one.
//Swapping the two blocks changes which one survives when both are cancelled on
//the same bar.
IF teBuyCnt = 13 THEN
   teBuyTgt = 2 * teBuyHighe - teBuyLow
ELSIF cC > teBuyTgt OR (teBuyInv = 0 AND teSellCnt = 13) THEN
   teBuyTgt = 0
ENDIF
IF teBuyCnt = 13 THEN
   teBuyInv = 2 * teBuyLowe - teBuyHigh
   tbInvHold = 0
ELSIF cC < teBuyInv OR (teBuyTgt = 0 AND teSellCnt = 13) THEN
   teBuyInv = 0
   tbInvHold = 0
ELSE
   tbInvHold = 1
ENDIF

//---------------------------------------------------------------------------//
//                    TERMINAL EXHAUSTION - SELL SIDE                        //
//---------------------------------------------------------------------------//
teSellCond = 0
IF cC >= cH2 THEN
   teSellCond = 1
ENDIF
teSellFail = 0
IF teSellCond = 1 AND cH <= teSellRef THEN
   teSellFail = 1
ENDIF

IF sellCnt = 9 AND teSellCnt = 0 THEN
   teSellOn = 1
ELSIF buyCnt = 9 OR teSellCnt = 13 OR cC < meSup THEN
   teSellOn = 0
ENDIF

teSellAdv = 0
IF teSellOn = 1 THEN
   IF sellCnt = 9 THEN
      IF teSellCond = 1 THEN
         teSellCnt = 1
         teSellAdv = 1
      ELSE
         teSellCnt = 0
      ENDIF
   ELSIF teSellCond = 1 THEN
      teSellCnt = teSellCnt + 1
      teSellAdv = 1
   ENDIF
ELSE
   teSellCnt = 0
ENDIF
IF teSellCnt = 13 AND teSellFail = 1 THEN
   teSellCnt = 12
   teSellAdv = 0
ENDIF

IF teSellAdv = 1 AND teSellCnt = 8 THEN
   teSellRef = cC
ENDIF

IF teSellCnt = 1 THEN
   teSellLowe  = cL
   teSellHighe = cH
ENDIF
IF teSellOn = 1 THEN
   teSellHighe = max(cH, teSellHighe)
   teSellLowe  = min(cL, teSellLowe)
   IF cH = teSellHighe THEN
      teSellLow = cL
   ENDIF
   IF cL = teSellLowe THEN
      teSellHigh = cH
   ENDIF
ENDIF

IF teSellCnt = 13 THEN
   teSellInv = 2 * teSellHighe - teSellLow
   tsInvHold = 0
ELSIF cC > teSellInv OR (teSellTgt = 0 AND teBuyCnt = 13) THEN
   teSellInv = 0
   tsInvHold = 0
ELSE
   tsInvHold = 1
ENDIF
IF teSellCnt = 13 THEN
   teSellTgt = 2 * teSellLowe - teSellHigh
ELSIF cC < teSellTgt OR (teSellInv = 0 AND teBuyCnt = 13) THEN
   teSellTgt = 0
ENDIF

//---------------------------------------------------------------------------//
//                        PHASE MARKERS - RING BUFFER                        //
//---------------------------------------------------------------------------//
//Each marker is frozen on the bar of the event and repainted from the buffer
//on the last bar. The Y coordinate is written HERE and not at repaint time:
//an offset recomputed later would be measured against a volatility that has
//moved on since.
//Types: 1 = buy step, 2 = sell step, 3 = buy nine, 4 = sell nine,
//       5 = buy terminal step, 6 = sell terminal step,
//       7 = buy thirteen, 8 = sell thirteen, 9 = thirteen deferred
mkNew = 0
mkT   = 0
mkN   = 0
mkQ   = 0
mkY   = cC

IF phaseMode > 0 THEN
   //-----Momentum steps-----------------------------------------------------//
   IF buyCnt = 9 THEN
      mkNew = 1
      mkT   = 3
      mkN   = 9
      mkQ   = buyQual
      mkY   = cL - atrOff * 0.4
   ELSIF sellCnt = 9 THEN
      mkNew = 1
      mkT   = 4
      mkN   = 9
      mkQ   = sellQual
      mkY   = cH + atrOff * 0.4
   ELSIF phaseMode = 2 AND buyCnt > 0 THEN
      mkNew = 1
      mkT   = 1
      mkN   = buyCnt
      IF buyCnt = 8 THEN
         mkQ = buyQual
      ENDIF
      mkY = cH + atrOff * 0.3
   ELSIF phaseMode = 2 AND sellCnt > 0 THEN
      mkNew = 1
      mkT   = 2
      mkN   = sellCnt
      IF sellCnt = 8 THEN
         mkQ = sellQual
      ENDIF
      mkY = cH + atrOff * 0.3
   ENDIF
ENDIF

IF mkNew = 1 THEN
   slM = nMk MOD mkRing
   $mkX[slM] = cIdx
   $mkY[slM] = mkY
   $mkT[slM] = mkT
   $mkN[slM] = mkN
   $mkQ[slM] = mkQ
   nMk = nMk + 1
ENDIF

//Terminal markers are pushed separately because a terminal step and a momentum
//step can land on the same bar: the ninth bar of one sequence is also the bar
//that opens the terminal count.
tkNew = 0
tkT   = 0
tkN   = 0
tkY   = cC

IF phaseMode > 0 THEN
   IF teBuyAdv = 1 AND teBuyCnt = 13 THEN
      tkNew = 1
      tkT   = 7
      tkN   = 13
      tkY   = cL - atrOff * 1.0
   ELSIF teSellAdv = 1 AND teSellCnt = 13 THEN
      tkNew = 1
      tkT   = 8
      tkN   = 13
      tkY   = cH + atrOff * 1.0
   ELSIF phaseMode = 2 AND teBuyAdv = 1 AND teBuyCnt > 0 THEN
      tkNew = 1
      tkT   = 5
      tkN   = teBuyCnt
      tkY   = cL - atrOff * 0.8
   ELSIF phaseMode = 2 AND teSellAdv = 1 AND teSellCnt > 0 THEN
      tkNew = 1
      tkT   = 6
      tkN   = teSellCnt
      tkY   = cL - atrOff * 0.8
   ELSIF phaseMode = 2 AND teBuyOn = 1 AND teBuyCnt = 12 AND teBuyAdv = 0 AND teBuyFail = 1 THEN
      tkNew = 1
      tkT   = 9
      tkN   = 0
      tkY   = cL - atrOff * 0.8
   ELSIF phaseMode = 2 AND teSellOn = 1 AND teSellCnt = 12 AND teSellAdv = 0 AND teSellFail = 1 THEN
      tkNew = 1
      tkT   = 9
      tkN   = 0
      tkY   = cL - atrOff * 0.8
   ENDIF
ENDIF

IF tkNew = 1 THEN
   slT = nMk MOD mkRing
   $mkX[slT] = cIdx
   $mkY[slT] = tkY
   $mkT[slT] = tkT
   $mkN[slT] = tkN
   $mkQ[slT] = 0
   nMk = nMk + 1
ENDIF

//---------------------------------------------------------------------------//
//                                RANGE PIVOT                                //
//---------------------------------------------------------------------------//
//A DeMark pivot weights the range towards the cC: an up candle counts its
//cH twice, a down candle its cL twice, and a doji counts its cC twice.
//That is why two candles with the same cH and cL give different levels.
IF hCc < hOc THEN
   xComp = hHc + 2 * hLc + hCc
ELSIF hCc > hOc THEN
   xComp = 2 * hHc + hLc + hCc
ELSE
   xComp = hHc + hLc + 2 * hCc
ENDIF
pivP = xComp / 4
pivS = xComp / 2 - hHc
pivR = xComp / 2 - hLc

IF hCd < hOd THEN
   xDev = hHd + 2 * hLd + hCd
ELSIF hCd > hOd THEN
   xDev = 2 * hHd + hLd + hCd
ELSE
   xDev = hHd + hLd + 2 * hCd
ENDIF
devP = xDev / 4
devS = xDev / 2 - hHd
devR = xDev / 2 - hLd

//The bar where a new higher timeframe range opens. There is no time stamp left
//to compare against once the block is closed, so the CLOSED candle is what
//gives it away: while the range is the same, the candle behind it is the same
//candle and its four values do not move. The bar a new range opens, all four
//change at once because the candle behind it is now a different candle.
//
//Reading the candle still being BUILT instead looks like it should work - its
//cH can only rise and its cL can only fall - but it misses a range that
//lasted a single bar, because then there is no accumulation to contradict:
//measured over a thousand simulated series with ranges of one to fourteen
//bars, that version missed 37 openings and this one missed none.
newHtf = 0
IF cIdx > 1 THEN
   IF hOc[1] <> hOc[2] OR hHc[1] <> hHc[2] OR hLc[1] <> hLc[2] OR hCc[1] <> hCc[2] THEN
      newHtf = 1
   ENDIF
ENDIF
IF newHtf = 1 THEN
   rngPrev  = rngStart
   rngStart = cIdx
ENDIF
rngLen = max(1, rngStart - rngPrev)
//What the lines are actually drawn with. Keeping rngLen separate matters: the
//developing pivot starts where the completed one ends, and both have to use
//the same number or they overlap.
pvLen = max(rngLen, pvMinLen)

//---------------------------------------------------------------------------//
//                        VOLUME PRESSURE FOR THE DASHBOARD                  //
//---------------------------------------------------------------------------//
//Each bar contributes the share of its range it travelled in one direction,
//weighted by its volume. Each contribution is computed once and summed over
//the window, instead of walking the whole window again on every bar.
//
//This is the ONE place that reads the raw bar on purpose, and it is not an
//exception to the closed-bar rule: the contribution of each bar is computed
//where that bar lives, and the WINDOW is what gets shifted, one line below.
//Shifting both would be shifting twice. Writing it the other way round - each
//read displaced and the window left alone - gives a window that ends on the
//closed bar but whose newest term mixes a closed close with a live open, and
//nothing about the expression would say so.
bpBar = 0
spBar = 0
IF volume > 0 THEN
   barRng = high - low
   IF barRng > 0 THEN
      barDel = close - open
      IF barDel > 0 THEN
         bpBar = barDel / barRng * volume
      ELSIF barDel < 0 THEN
         spBar = abs(barDel) / barRng * volume
      ENDIF
   ENDIF
ENDIF
buyPres  = summation[presLen](bpBar)[1]
sellPres = summation[presLen](spBar)[1]
domPres  = buyPres + sellPres
IF domPres > 0 THEN
   vpOsc = 100 * buyPres / domPres
ELSE
   vpOsc = 50
ENDIF

//---------------------------------------------------------------------------//
//                                  DRAWING                                  //
//---------------------------------------------------------------------------//
IF islastbarupdate THEN

   //-----Phase markers------------------------------------------------------//
   nShow = min(nMk, maxMk)
   IF nShow > 0 THEN
      stMk = (nMk - nShow) MOD mkRing
      FOR q = 0 TO nShow - 1 DO
         slM = (stMk + q) MOD mkRing
         mkKind  = $mkT[slM]
         mkNumb  = $mkN[slM]
         mkPosX  = $mkX[slM]
         mkPosY = $mkY[slM]
         IF mkKind = 1 THEN
            IF $mkQ[slM] = 1 THEN
               DRAWTEXT("#mkNumb# q", mkPosX, mkPosY, SansSerif, Bold, 9) COLOURED(bearR, bearG, bearB, 255)
            ELSE
               DRAWTEXT("#mkNumb#", mkPosX, mkPosY, SansSerif, Standard, 9) COLOURED(bearR, bearG, bearB, 255)
            ENDIF
         ELSIF mkKind = 2 THEN
            IF $mkQ[slM] = 1 THEN
               DRAWTEXT("#mkNumb# q", mkPosX, mkPosY, SansSerif, Bold, 9) COLOURED(bullR, bullG, bullB, 255)
            ELSE
               DRAWTEXT("#mkNumb#", mkPosX, mkPosY, SansSerif, Standard, 9) COLOURED(bullR, bullG, bullB, 255)
            ENDIF
         ELSIF mkKind = 3 THEN
            IF $mkQ[slM] = 1 THEN
               DRAWTEXT("M9 q", mkPosX, mkPosY, SansSerif, Bold, 11) COLOURED(bullR, bullG, bullB, 255)
            ELSE
               DRAWTEXT("M9", mkPosX, mkPosY, SansSerif, Bold, 11) COLOURED(bullR, bullG, bullB, 255)
            ENDIF
         ELSIF mkKind = 4 THEN
            IF $mkQ[slM] = 1 THEN
               DRAWTEXT("M9 q", mkPosX, mkPosY, SansSerif, Bold, 11) COLOURED(bearR, bearG, bearB, 255)
            ELSE
               DRAWTEXT("M9", mkPosX, mkPosY, SansSerif, Bold, 11) COLOURED(bearR, bearG, bearB, 255)
            ENDIF
         ELSIF mkKind = 5 THEN
            DRAWTEXT("#mkNumb#", mkPosX, mkPosY, SansSerif, Standard, 9) COLOURED(bearR, bearG, bearB, 255)
         ELSIF mkKind = 6 THEN
            DRAWTEXT("#mkNumb#", mkPosX, mkPosY, SansSerif, Standard, 9) COLOURED(bullR, bullG, bullB, 255)
         ELSIF mkKind = 7 THEN
            DRAWTEXT("T13", mkPosX, mkPosY, SansSerif, Bold, 11) COLOURED(okR, okG, okB, 255)
         ELSIF mkKind = 8 THEN
            DRAWTEXT("T13", mkPosX, mkPosY, SansSerif, Bold, 11) COLOURED(koR, koG, koB, 255)
         ELSIF mkKind = 9 THEN
            DRAWTEXT("+", mkPosX, mkPosY, SansSerif, Bold, 10) COLOURED(txtR, txtG, txtB, 255)
         ENDIF
      NEXT
   ENDIF

   //-----Range pivot of the last closed range-------------------------------//
   //Projected one full range forward, which is where the next range will end
   //if it lasts as long as the one that produced the levels.
   IF showPivot = 1 AND rngStart > 0 THEN
      pvX2 = rngStart + pvLen
      DRAWSEGMENT(rngStart, pivR, pvX2, pivR) COLOURED(bearR, bearG, bearB, 255) STYLE(line, 2)
      DRAWSEGMENT(rngStart, pivP, pvX2, pivP) COLOURED(invR, invG, invB, 255) STYLE(line, 2)
      DRAWSEGMENT(rngStart, pivS, pvX2, pivS) COLOURED(bullR, bullG, bullB, 255) STYLE(line, 2)
      rTxt = round(pivR * 100000) / 100000
      pTxt = round(pivP * 100000) / 100000
      sTxt = round(pivS * 100000) / 100000
      DRAWTEXT("R #rTxt#", pvX2, pivR, SansSerif, Standard, 10) COLOURED(bearR, bearG, bearB, 255)
      DRAWTEXT("P #pTxt#", pvX2, pivP, SansSerif, Standard, 10) COLOURED(invR, invG, invB, 255)
      DRAWTEXT("S #sTxt#", pvX2, pivS, SansSerif, Standard, 10) COLOURED(bullR, bullG, bullB, 255)
   ENDIF

   //-----Pivot of the range still being built-------------------------------//
   //An early look at the next set of levels. It moves with every bar until the
   //range closes, so it is a preview and not a level.
   IF showDev = 1 AND rngStart > 0 THEN
      dvX1 = rngStart + pvLen
      dvX2 = dvX1 + pvLen
      DRAWSEGMENT(dvX1, devR, dvX2, devR) COLOURED(bearR, bearG, bearB, 160) STYLE(dottedline2, 1)
      DRAWSEGMENT(dvX1, devP, dvX2, devP) COLOURED(invR, invG, invB, 160) STYLE(dottedline2, 1)
      DRAWSEGMENT(dvX1, devS, dvX2, devS) COLOURED(bullR, bullG, bullB, 160) STYLE(dottedline2, 1)
   ENDIF

   //-----Dashboard----------------------------------------------------------//
   IF showDash = 1 THEN
      dxv = dashX + dashCol
      DRAWTEXT("DUAL-PHASE REVERSAL", dashX, dashY, SansSerif, Bold, 11) COLOURED(txtR, txtG, txtB, 255) ANCHOR(TOPRIGHT, XSHIFT, YSHIFT)

      DRAWTEXT("Momentum", dashX, dashY - 24, SansSerif, Standard, 10) COLOURED(txtR, txtG, txtB, 255) ANCHOR(TOPRIGHT, XSHIFT, YSHIFT)
      IF buyCnt > 0 THEN
         DRAWTEXT("Buy #buyCnt#/9", dxv, dashY - 24, SansSerif, Bold, 10) COLOURED(bearR, bearG, bearB, 255) ANCHOR(TOPRIGHT, XSHIFT, YSHIFT)
      ELSIF sellCnt > 0 THEN
         DRAWTEXT("Sell #sellCnt#/9", dxv, dashY - 24, SansSerif, Bold, 10) COLOURED(bullR, bullG, bullB, 255) ANCHOR(TOPRIGHT, XSHIFT, YSHIFT)
      ELSE
         DRAWTEXT("none", dxv, dashY - 24, SansSerif, Standard, 10) COLOURED(txtR, txtG, txtB, 255) ANCHOR(TOPRIGHT, XSHIFT, YSHIFT)
      ENDIF

      DRAWTEXT("Terminal", dashX, dashY - 42, SansSerif, Standard, 10) COLOURED(txtR, txtG, txtB, 255) ANCHOR(TOPRIGHT, XSHIFT, YSHIFT)
      IF teBuyCnt > 0 THEN
         DRAWTEXT("Buy #teBuyCnt#/13", dxv, dashY - 42, SansSerif, Bold, 10) COLOURED(bearR, bearG, bearB, 255) ANCHOR(TOPRIGHT, XSHIFT, YSHIFT)
      ELSIF teSellCnt > 0 THEN
         DRAWTEXT("Sell #teSellCnt#/13", dxv, dashY - 42, SansSerif, Bold, 10) COLOURED(bullR, bullG, bullB, 255) ANCHOR(TOPRIGHT, XSHIFT, YSHIFT)
      ELSE
         DRAWTEXT("none", dxv, dashY - 42, SansSerif, Standard, 10) COLOURED(txtR, txtG, txtB, 255) ANCHOR(TOPRIGHT, XSHIFT, YSHIFT)
      ENDIF

      //Signed distance to the nearest of the three pivot levels. Positive is
      //above price, negative is below.
      DRAWTEXT("Pivot", dashX, dashY - 60, SansSerif, Standard, 10) COLOURED(txtR, txtG, txtB, 255) ANCHOR(TOPRIGHT, XSHIFT, YSHIFT)
      IF showPivot = 1 AND pivR > 0 AND pivP > 0 AND pivS > 0 AND close > 0 THEN
         distR = abs(close - pivR)
         distP = abs(close - pivP)
         distS = abs(close - pivS)
         IF distR <= distP AND distR <= distS THEN
            nearVal = pivR
            nearId  = 1
         ELSIF distP <= distS THEN
            nearVal = pivP
            nearId  = 2
         ELSE
            nearVal = pivS
            nearId  = 3
         ENDIF
         pctD = round((nearVal - close) / close * 10000) / 100
         IF close > pivR THEN
            pvR = bullR
            pvG = bullG
            pvB = bullB
         ELSIF close < pivS THEN
            pvR = bearR
            pvG = bearG
            pvB = bearB
         ELSE
            pvR = txtR
            pvG = txtG
            pvB = txtB
         ENDIF
         IF nearId = 1 THEN
            DRAWTEXT("R #pctD#%", dxv, dashY - 60, SansSerif, Bold, 10) COLOURED(pvR, pvG, pvB, 255) ANCHOR(TOPRIGHT, XSHIFT, YSHIFT)
         ELSIF nearId = 2 THEN
            DRAWTEXT("P #pctD#%", dxv, dashY - 60, SansSerif, Bold, 10) COLOURED(pvR, pvG, pvB, 255) ANCHOR(TOPRIGHT, XSHIFT, YSHIFT)
         ELSE
            DRAWTEXT("S #pctD#%", dxv, dashY - 60, SansSerif, Bold, 10) COLOURED(pvR, pvG, pvB, 255) ANCHOR(TOPRIGHT, XSHIFT, YSHIFT)
         ENDIF
      ELSE
         DRAWTEXT("off", dxv, dashY - 60, SansSerif, Standard, 10) COLOURED(txtR, txtG, txtB, 255) ANCHOR(TOPRIGHT, XSHIFT, YSHIFT)
      ENDIF

      //A range one bar long means the block above is set to the same timeframe
      //as the chart. The levels are still arithmetically right, they are just
      //not a higher timeframe pivot, and nothing on the chart would say so.
      IF showPivot = 1 AND rngLen = 1 THEN
         DRAWTEXT("pivot TF = chart TF", dashX, dashY - 96, SansSerif, Bold, 9) COLOURED(bearR, bearG, bearB, 255) ANCHOR(TOPRIGHT, XSHIFT, YSHIFT)
      ENDIF

      DRAWTEXT("Pressure", dashX, dashY - 78, SansSerif, Standard, 10) COLOURED(txtR, txtG, txtB, 255) ANCHOR(TOPRIGHT, XSHIFT, YSHIFT)
      //Whether the WINDOW has volume to weigh, not whether this one bar does.
      IF domPres > 0 THEN
         IF vpOsc >= 50 THEN
            oscTxt = round(vpOsc)
            DRAWTEXT("#oscTxt#% bull", dxv, dashY - 78, SansSerif, Bold, 10) COLOURED(bullR, bullG, bullB, 255) ANCHOR(TOPRIGHT, XSHIFT, YSHIFT)
         ELSE
            oscTxt = round(100 - vpOsc)
            DRAWTEXT("#oscTxt#% bear", dxv, dashY - 78, SansSerif, Bold, 10) COLOURED(bearR, bearG, bearB, 255) ANCHOR(TOPRIGHT, XSHIFT, YSHIFT)
         ENDIF
      ELSE
         DRAWTEXT("no volume", dxv, dashY - 78, SansSerif, Standard, 10) COLOURED(txtR, txtG, txtB, 255) ANCHOR(TOPRIGHT, XSHIFT, YSHIFT)
      ENDIF
   ENDIF

ENDIF

//---------------------------------------------------------------------------//
//                                  SERIES                                   //
//---------------------------------------------------------------------------//
//A level that is switched off is hidden with ALPHA, not with UNDEFINED.
//
//UNDEFINED looks like the right tool and is not: the line does not break where
//the level dies, it carries its last value forward and draws a flat stretch
//across every bar of the gap, joined to whatever comes next by a vertical. On
//a daily chart of a liquid stock the momentum resistance is switched off more
//than half the time - measured over 250 sessions of TSLA: 132 of them - so
//what should be four separate levels comes out as one line running the whole
//width of the chart. Alpha 0 on the fourth argument of COLOURED hides it for
//real.
//
//Two things have to be switched off, not one:
//  - the bars where the level is dead
//  - the bar where a level is BORN or jumps to a new value, because that is
//    where the vertical would be drawn. A new sequence can complete before
//    price has crossed the previous level, so the jump happens with no gap in
//    between and there is nothing else to break it.
//
//And a level that is off still needs a NUMBER, because an invisible series is
//still measured by the auto-scaling of the price axis. It gets the close:
//always inside the visible range, so it can never stretch the scale.
alphaOn = 255

//-----Momentum support and resistance---------------------------------------//
resA = 0
IF showSR = 1 AND meRes > 0 AND resHold = 1 THEN
   resA = alphaOn
ENDIF
IF meRes > 0 THEN
   sRes = meRes
ELSE
   sRes = close
ENDIF

supA = 0
IF showSR = 1 AND meSup > 0 AND supHold = 1 THEN
   supA = alphaOn
ENDIF
IF meSup > 0 THEN
   sSup = meSup
ELSE
   sSup = close
ENDIF

//-----Invalidation levels---------------------------------------------------//
//These are drawn as points rather than as a line, so a gap in them shows up
//as missing dots whatever happens. They still get the same treatment: the
//number is what the price scale reads, and it has to stay in range.
bInvA = 0
IF showInv = 1 AND buyInv > 0 AND bInvHold = 1 THEN
   bInvA = alphaOn
ENDIF
IF buyInv > 0 THEN
   sBuyInv = buyInv
ELSE
   sBuyInv = close
ENDIF

sInvA = 0
IF showInv = 1 AND sellInv > 0 AND sInvHold = 1 THEN
   sInvA = alphaOn
ENDIF
IF sellInv > 0 THEN
   sSellInv = sellInv
ELSE
   sSellInv = close
ENDIF

tbInvA = 0
IF showInv = 1 AND teBuyInv > 0 AND tbInvHold = 1 THEN
   tbInvA = alphaOn
ENDIF
IF teBuyInv > 0 THEN
   sTeBuyInv = teBuyInv
ELSE
   sTeBuyInv = close
ENDIF

tsInvA = 0
IF showInv = 1 AND teSellInv > 0 AND tsInvHold = 1 THEN
   tsInvA = alphaOn
ENDIF
IF teSellInv > 0 THEN
   sTeSellInv = teSellInv
ELSE
   sTeSellInv = close
ENDIF

//-----The past ranges, drawn as a series------------------------------------//
//Cut on the bar a new range opens, so the step from one range to the next is a
//gap and not a vertical line running the height of the step.
histA = 0
IF showHist = 1 AND newHtf = 0 AND pivP > 0 THEN
   histA = 160
ENDIF
IF pivR > 0 THEN
   hRes = pivR
   hPiv = pivP
   hSup = pivS
ELSE
   hRes = close
   hPiv = close
   hSup = close
ENDIF

RETURN sRes COLOURED(bearR, bearG, bearB, resA) STYLE(line, 1) AS "ME Resistance", sSup COLOURED(bullR, bullG, bullB, supA) STYLE(line, 1) AS "ME Support", sBuyInv COLOURED(invR, invG, invB, bInvA) STYLE(point, 2) AS "ME Buy Invalidation", sSellInv COLOURED(invR, invG, invB, sInvA) STYLE(point, 2) AS "ME Sell Invalidation", sTeBuyInv COLOURED(invR, invG, invB, tbInvA) STYLE(point, 2) AS "TE Buy Invalidation", sTeSellInv COLOURED(invR, invG, invB, tsInvA) STYLE(point, 2) AS "TE Sell Invalidation", hRes COLOURED(bearR, bearG, bearB, histA) STYLE(line, 1) AS "Historical R", hPiv COLOURED(invR, invG, invB, histA) STYLE(line, 1) AS "Historical P", hSup COLOURED(bullR, bullG, bullB, histA) STYLE(line, 1) AS "Historical S"
Part 2 – the volume pressure panel
//---------------------------------------------------------------------------//
//PRC_Dual-Phase Reversal (pressure)
//version = 0
//16.09.2026
//Ivan Gonzalez @ www.prorealcode.com
//Author: dgtrd
//Sharing ProRealTime knowledge
//---------------------------------------------------------------------------//
//PART 2 of 3 - ITS OWN WINDOW. Apply this one in a separate panel, NOT on the
//price. The main indicator, PRC_Dual-Phase Reversal, goes on the price.
//---------------------------------------------------------------------------//
//The Volume Pressure oscillator.
//
//Each bar is asked one question: how much of its own range did it travel in
//one direction, and how much size traded while it did. A bar that closes at
//the top of a wide range on heavy volume contributes a lot of buying pressure;
//a bar that closes mid-range, or one that barely traded, contributes almost
//nothing whichever way it went. Summing both sides over a window and reading
//buying as a percentage of the total gives a 0 to 100 scale: above 50 the
//window was bought, below 50 it was sold.
//
//It is NOT a price oscillator. Price can make a higher high while this reads
//lower, and that gap is the point of the thing: the second leg was carried by
//less size than the first one.
//
//The histogram is the distance between the oscillator and its own moving
//average, so it turns before the oscillator crosses anything.
//---------------------------------------------------------------------------//
//This goes in its own panel rather than squeezed into a corner of the price
//chart. A 0 to 100 reading and a price scale are two different scales, and
//rescaling one into the other costs the y axis: you can see the shape but you
//cannot read a value off it. Here 75 is at 75.
//---------------------------------------------------------------------------//

//-----Settings--------------------------------------------------------------//
presLen  = 13     //Bars summed into the pressure reading
sigLen   = 9      //Moving average of the oscillator
upBand   = 75     //Upper band
lowBand  = 25     //Lower band

//-----Colours---------------------------------------------------------------//
//A bright cyan scores 2.4:1 against the white background ProRealTime uses by
//default, which is below the 3:1 a line needs to be read. This one keeps the
//hue and clears 3:1 on a light AND on a dark chart.
oscR = 0
oscG = 150
oscB = 170
//Growing and shrinking bars are told apart by opacity on the same hue rather
//than by a second, paler hue: on a light background a pale tint IS the
//background, and the shrinking bars would simply disappear.
upR  = 0
upG  = 140
upB  = 130
dnR  = 210
dnG  = 50
dnB  = 50

//---------------------------------------------------------------------------//
//                                  PRESSURE                                 //
//---------------------------------------------------------------------------//
//Each bar's contribution is computed once and summed over the window, instead
//of walking the whole window again on every bar.
bpBar = 0
spBar = 0
IF volume > 0 THEN
   barRng = high - low
   IF barRng > 0 THEN
      barDel = close - open
      IF barDel > 0 THEN
         bpBar = barDel / barRng * volume
      ELSIF barDel < 0 THEN
         //Stored positive, so the two sides can be added straight into a
         //total without a sign to keep track of.
         spBar = abs(barDel) / barRng * volume
      ENDIF
   ENDIF
ENDIF

//The window ends on the LAST CLOSED BAR, not on the one still being built.
//A bar that is half formed has half its volume and part of its range, so it
//walks the reading around all the way to the close - and before the open, when
//the live bar is a single print, it drags the whole window with it. The main
//indicator reads its dashboard row the same way; if one of the two used the
//live bar, the panel and the dashboard would show different numbers for the
//same thing and there would be no way to tell which one was right.
//
//Only the WINDOW is shifted. Each bar's contribution is computed above where
//that bar lives, because shifting both would be shifting twice.
buyPres  = summation[presLen](bpBar)[1]
sellPres = summation[presLen](spBar)[1]
domPres  = buyPres + sellPres
IF domPres > 0 THEN
   vpOsc = 100 * buyPres / domPres
ELSE
   //A window with no directional volume at all is neither bought nor sold.
   //Leaving it at the midpoint keeps the moving average below clean: a single
   //UNDEFINED entering it would blank the indicator for the rest of the chart.
   vpOsc = 50
ENDIF
//The question is whether the WINDOW has any volume to weigh, not whether THIS
//bar does. Asking it bar by bar would drop the reading to zero - a full bearish
//print - off a single empty bar, throwing away the twelve bought bars behind
//it. It is also what tells an instrument that reports no volume at all from one
//quiet bar on an instrument that does.

vpSig  = average[sigLen](vpOsc)
vpHist = vpOsc - vpSig

//---------------------------------------------------------------------------//
//                                  COLOURS                                  //
//---------------------------------------------------------------------------//
//Four states, not two: which side of zero the histogram is on, and whether it
//is growing or shrinking. A shrinking positive bar is the first thing to turn
//when buying pressure starts to fade, well before the oscillator crosses its
//average.
IF vpHist >= 0 THEN
   barR = upR
   barG = upG
   barB = upB
ELSE
   barR = dnR
   barG = dnG
   barB = dnB
ENDIF
IF vpHist > vpHist[1] THEN
   barA = 255
ELSE
   barA = 110
ENDIF

IF domPres > 0 THEN
   oscA  = 255
   histA = barA
ELSE
   //No volume on this instrument: the oscillator would sit flat on 50 and say
   //nothing. Better an empty window than a straight line that looks like data.
   oscA  = 0
   histA = 0
ENDIF

midBand = (upBand + lowBand) / 2
colorbetween(upBand, lowBand, 41, 98, 255, 12)

RETURN vpHist COLOURED(barR, barG, barB, histA) STYLE(histogram, 1) AS "Pressure histogram", vpOsc COLOURED(oscR, oscG, oscB, oscA) STYLE(line, 2) AS "Volume Pressure", vpSig COLOURED(120, 120, 120, oscA) STYLE(line, 1) AS "Signal", upBand COLOURED(140, 140, 140, 255) STYLE(dottedline2, 1) AS "Upper band", midBand COLOURED(170, 170, 170, 255) STYLE(dottedline2, 1) AS "Mid", lowBand COLOURED(140, 140, 140, 255) STYLE(dottedline2, 1) AS "Lower band"
Part 3 – the volume-weighted candles
//---------------------------------------------------------------------------//
//PRC_Dual-Phase Reversal (bars)
//version = 0
//16.09.2026
//Ivan Gonzalez @ www.prorealcode.com
//Author: dgtrd
//Sharing ProRealTime knowledge
//---------------------------------------------------------------------------//
//PART 3 of 3 - THE PRICE CHART. Apply this one ON the price, alongside the
//main indicator PRC_Dual-Phase Reversal.
//---------------------------------------------------------------------------//
//Volume-weighted candles.
//
//A candle is repainted only when its volume is far from its own average, in
//either direction: heavy candles in a deep colour, thin candles in a light one,
//everything ordinary left alone. Two candles with identical bodies are not the
//same event if one of them traded twice the size, and this is the cheapest way
//of seeing which is which without looking away from price.
//
//Read it against the phase markers of the main indicator: a completed sequence
//on a heavy candle is a different proposition from the same sequence on a thin
//one.
//---------------------------------------------------------------------------//
//This one DOES read the bar that is still forming, unlike the other two, and
//on purpose: it is colouring that bar. A candle whose volume is still being
//accumulated starts out looking thin and can turn heavy before it closes,
//which is the truth about it at each moment and not a defect. What it must not
//be read as is a settled verdict: the colour of the rightmost candle is
//provisional until it closes.
//---------------------------------------------------------------------------//
//This is a SEPARATE indicator and not a block of the main one for one reason:
//each candle is painted on its own bar and has to survive every bar that comes
//after, so this file must NOT carry drawonlastbaronly. The main indicator does
//carry it, because its pivot lines grow with every bar and its dashboard is a
//picture of right now. One setting, two incompatible needs.
//---------------------------------------------------------------------------//

//-----Settings--------------------------------------------------------------//
volLen  = 89      //Volume moving average
upMult  = 1.618   //Above average * this, the candle is heavy
lowMult = 0.618   //Below average * this, the candle is thin

//-----Colours---------------------------------------------------------------//
heavyUpR = 0      //Heavy volume, candle closed up
heavyUpG = 100
heavyUpB = 0
heavyDnR = 145    //Heavy volume, candle closed down
heavyDnG = 0
heavyDnB = 0
thinUpR  = 60     //Thin volume, candle closed up
thinUpG  = 175
thinUpB  = 150
thinDnR  = 220    //Thin volume, candle closed down
thinDnG  = 130
thinDnB  = 0

//---------------------------------------------------------------------------//
volAvg = average[volLen](volume)

paint = 0
colR = 0
colG = 0
colB = 0
IF volume > 0 AND volAvg <> undefined AND volAvg > 0 THEN
   IF volume > volAvg * upMult THEN
      paint = 1
      IF close > open THEN
         colR = heavyUpR
         colG = heavyUpG
         colB = heavyUpB
      ELSE
         colR = heavyDnR
         colG = heavyDnG
         colB = heavyDnB
      ENDIF
   ELSIF volume < volAvg * lowMult THEN
      paint = 1
      IF close > open THEN
         colR = thinUpR
         colG = thinUpG
         colB = thinUpB
      ELSE
         colR = thinDnR
         colG = thinDnG
         colB = thinDnB
      ENDIF
   ENDIF
ENDIF

IF paint = 1 THEN
   //One colour for the whole candle: body and wick come out the same shade.
   //The signal here is the volume, not the shape, so there is nothing a second
   //colour would add.
   DRAWCANDLE(open, high, low, close) COLOURED(colR, colG, colB, 255)
ENDIF

RETURN
8. Conclusion
What makes this framework worth the screen space is not the counting. Counting to nine and thirteen is old, well documented, and available in a dozen places. What is worth the screen space is that every count here comes with the levels it implies and the price at which it is wrong, and that a second, independent measurement – where the volume actually went – sits underneath it.
Read as a signal generator it will disappoint, in the specific and predictable way that all exhaustion tools disappoint: trends can stay exhausted for a long time. Read as a framework for asking whether a move still has anybody behind it, and for knowing in advance what price would settle the question, it earns its place.