Flow Pressure Zones
Introduction
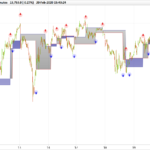
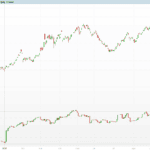
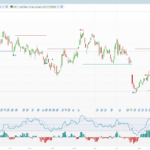
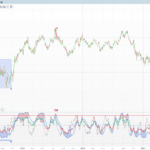
Two candles can point the same way and mean completely different things. A wide-bodied bar closing on its highs with a volume spike is conviction; a small-bodied bar drifting up on thin volume is noise. Most trend tools treat them alike. Flow Pressure Zones, by BOSWaves, does not: it scores the conviction behind every bar, paints that conviction straight onto price, and — when strong conviction pushes against the prevailing trend — it plants a reversal zone exactly where the pressure appeared.
The indicator layers three ideas on one overlay: a weighted moving average that sets the trend regime, a normalised flow score that drives both the candle colouring and a synthetic “fuel gauge” hugging the baseline, and a reversal engine that turns strong counter-trend flow into managed support/resistance zones.
Theory Behind the Indicator
1. The baseline and the trend regime
Everything is anchored to a weighted moving average of the close (default 80). Price above the WMA is an up regime; price below it is a down regime. The WMA is deliberately weighted rather than simple — it leans on recent bars, so the regime flips a little faster than a plain average would.
wma     = WMA(close, 80)
trendUp = close > wma
2. The flow score — the distinctive part
This is where the indicator earns its name. Each bar is scored on two independent axes and the axes are multiplied:
- Body ratio — the size of the real body relative to the full bar range. A bar that is nearly all body closed with intent; a bar that is nearly all wick did not.
- Volume normalisation — the bar’s volume divided by its own moving average, capped at 3×. A move on twice-average volume counts double; a move on thin volume is discounted.
bodyRatio = |close - open| / (high - low)
volNorm   = min( volume / SMA(volume, 20), 3 )
rawFlow   = bodyRatio × volNorm
That raw flow is then normalised to 0–1 against its own recent range (a rolling min/max over the lookback), so “strong” and “weak” are always judged relative to the instrument’s own recent behaviour, not an absolute number:
flowNorm = ( rawFlow − lowest(rawFlow, 80) ) / ( highest(rawFlow, 80) − lowest(rawFlow, 80) )
A flowNorm near 1 means this bar carries more conviction than almost anything in the recent window; near 0 means it is among the weakest.
3. Painting conviction onto price
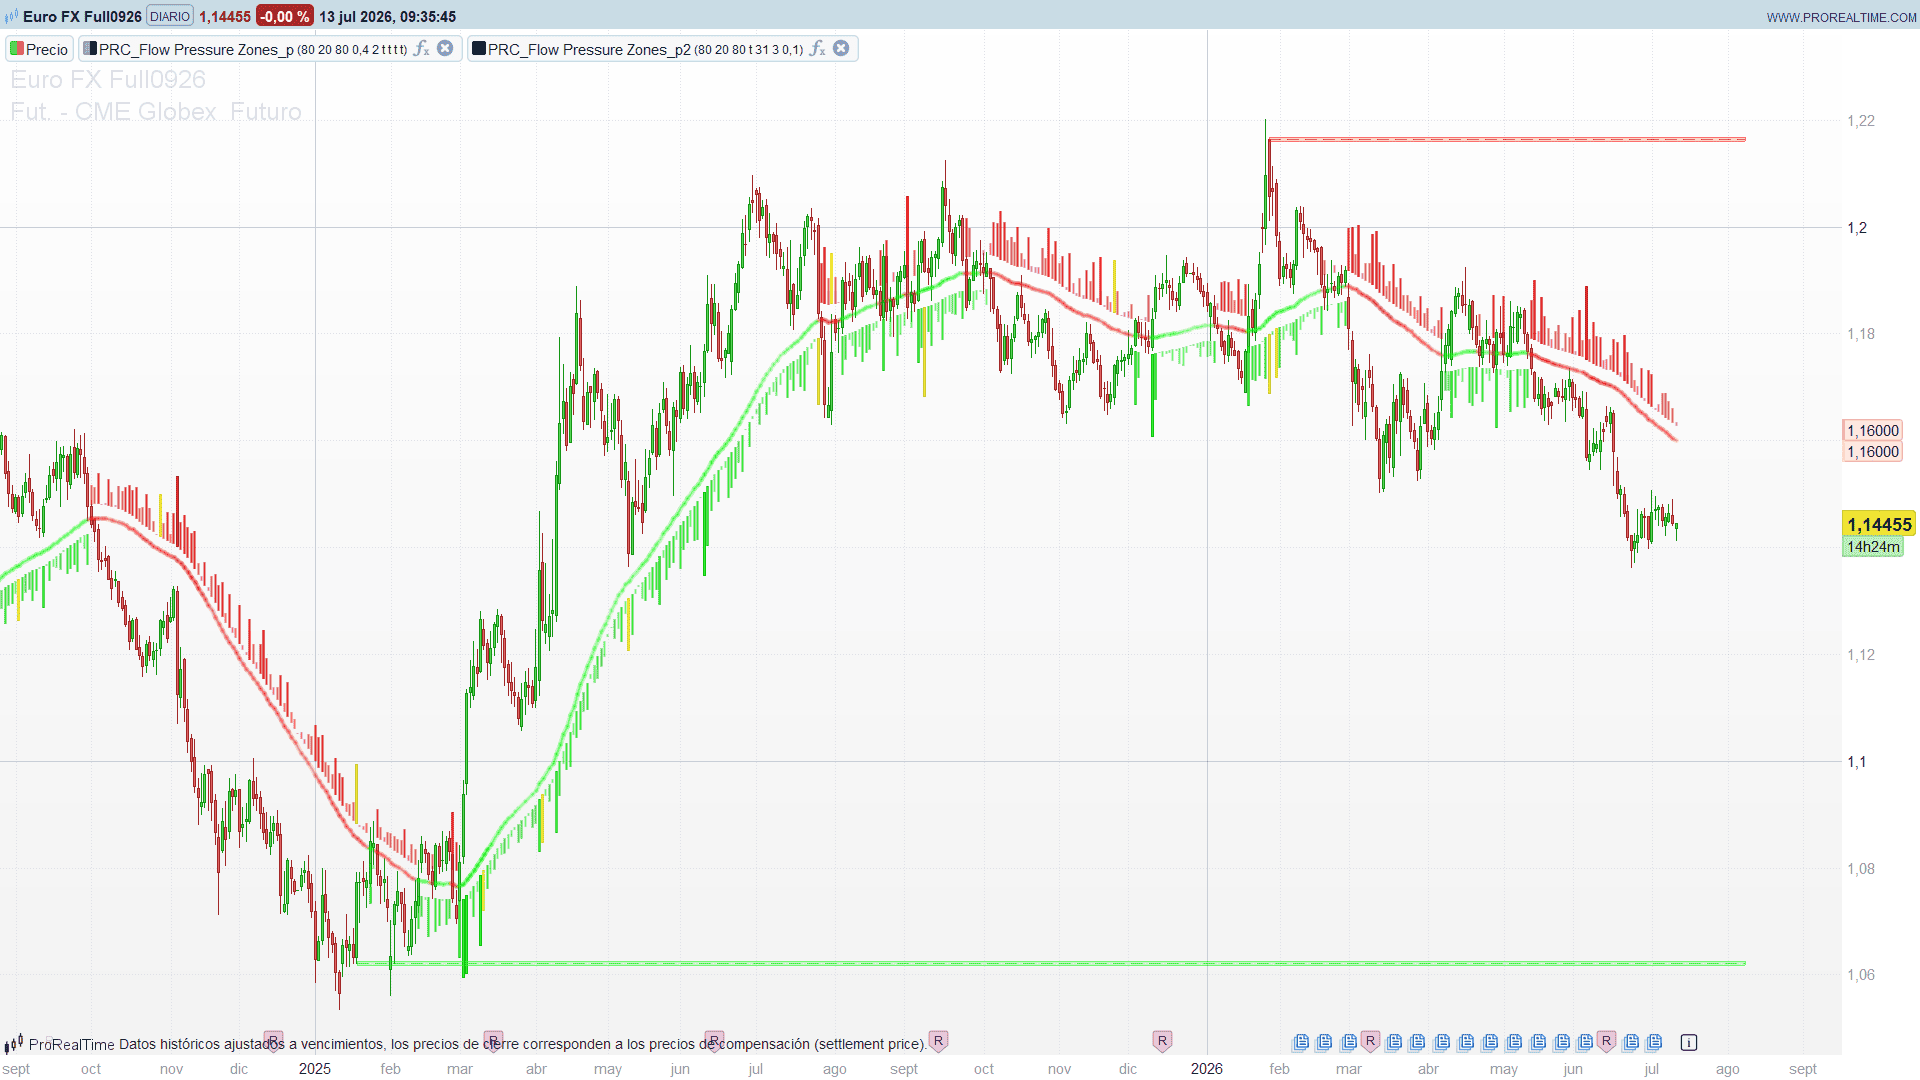
The chart candles are recoloured with the trend colour — green in an up regime, red in a down one — but the intensity scales with flow. A weak-flow bar is a dim, washed-out version of the trend colour; a strong-flow bar is vivid and saturated. At a glance you are no longer reading only direction, you are reading how much force is behind it.
4. Fuel candles — a gauge on the baseline
Running along the moving average is a row of synthetic “fuel candles”. They are not price — they are a meter. Their height is flowNorm × ATR × heightMult and their opacity rises with flow, so they grow tall and solid when the market is moving with conviction and shrink to faint stubs when the move is running out of gas. In an up regime they hang just below the baseline; in a down regime, just above it. Think of them as the fuel left in the tank of the current move.
5. The reversal engine
The most actionable output. The indicator watches for a bar that fights the trend with real force:
- Buy pressure: the close sits in the top third of the range, the bar is up, and volume is above 1.2× its average.
- Sell pressure: the close sits in the bottom third, the bar is down, and volume is above 1.2× average.
When buy pressure appears inside a down regime and flow is above the midpoint, that is a bull reversal — a possible floor. When sell pressure appears inside an up regime with strong flow, that is a bear reversal — a possible ceiling. The triggering bar flashes yellow, and a flow reversal zone is anchored at its extreme (the low for a bull reversal, the high for a bear reversal), a thin band whose height is a fraction of ATR.
6. Managing the zones
Left unmanaged, reversal signals would litter the chart. The engine keeps them clean:
- Cooldown — no new zone within zoneCD bars of the last one, so clusters do not pile up.
- A hard cap — only the maxZones most recent zones survive; older ones drop off.
- Absorption — a new zone that overlaps an existing same-side zone replaces it, rather than stacking a near-duplicate.
- Breaks — when price closes beyond a zone for two consecutive bars, the zone is considered invalidated and removed.
What you are left looking at is, by construction, the set of reversal levels still in play.
How to Read the Indicator
- Colour intensity is conviction. Vivid green/red bars carry force; pale bars are drift. A trend painted in progressively dimmer bars is losing its engine.
- The fuel candles are the tank. Tall, solid fuel bars mean the move has support; shrinking, translucent ones mean it is stalling — often before price itself shows it.
- Yellow is a warning. A yellow bar is strong pressure against the current trend — a potential turning point, not a with-trend continuation.
- Zones are levels with memory. A reversal zone that price respects is a validated turn; a zone price closes through (two bars) is gone. Live zones extend to the right as areas to watch.
- Regime is the WMA. The baseline colour and price’s side of it frame everything else: the same pressure means different things above and below the line.
Practical Applications
- A conviction filter for entries. Take with-trend setups only when flow confirms — vivid candles and tall fuel bars — and stand aside when the move is painted in weak, translucent colour.
- Reversal timing. The yellow bars and their zones mark where counter-trend force actually printed. Use them for mean-reversion entries, or as a cue to tighten/exit a with-trend position.
- Early exhaustion read. Because the fuel gauge is driven by body-and-volume rather than price, it often thins out while price is still grinding — a heads-up that the trend is living on fumes.
- Structure with a built-in stop. A reversal zone gives you both the entry area and the invalidation: the far edge of the zone, beyond which the two-bar-close rule declares the level broken.
Indicator Configuration
- wmaLen (default 80): baseline length. Lower = faster trend response.
- volLen (default 20): volume moving-average length for the flow score.
- normLen (default 80): lookback for normalising flow to 0–1.
- candleOff (default 0.4): fuel-candle offset from the baseline, in ATR.
- heightMult (default 2.0): fuel-candle height multiplier, in ATR.
- zoneCD (default 31): minimum bars between two reversal zones.
- maxZones (default 3): how many simultaneous zones to keep.
- zoneATR (default 0.1): zone thickness, in ATR.
- paintBars / showFuel / showBase / showGlow / showZones (default on): layer toggles.
Both indicators must be applied on the price chart (overlay).
Code
Part 1 of 2 — Candles & Baseline (apply on price; no DrawOnLastBarOnly):
//--------------------------------------------------------//
// PRC_Flow Pressure Zones [Candles & Baseline] (by BOSWaves)
// version = 0
// 13.07.2026
// Ivan Gonzalez @ www.prorealcode.com
// Sharing ProRealTime knowledge
//--------------------------------------------------------//
// Part 1 of 2: price-candle coloring + fuel candles + WMA baseline glow.
// Apply on the price chart (overlay). No DrawOnLastBarOnly: drawcandle needs every bar.

// ===== Inputs =====
wmaLen     = 80     // WMA baseline length
volLen     = 20     // Volume SMA length
normLen    = 80     // Flow normalization lookback
candleOff  = 0.4    // Fuel candle offset (ATR multiple)
heightMult = 2.0    // Fuel candle height (ATR multiple)
paintBars  = 1      // Color price candles (1/0)
showFuel   = 1      // Show fuel candles (1/0)
showBase   = 1      // Show WMA baseline (1/0)
showGlow   = 1      // Show baseline glow (1/0)

// ===== Colors (R,G,B) =====
bullR = 0
bullG = 255
bullB = 0
bearR = 255
bearG = 0
bearB = 0
revR = 255
revG = 255
revB = 0

// ===== WMA baseline & trend =====
wma = average[wmaLen,2](close)
trendUp = close > wma

// ===== Flow score =====
barRange = max(high - low, pipsize)
bodySize = abs(close - open)
bodyRatio = bodySize / barRange
closePos = (close - low) / barRange

volSma = average[volLen](volume)
IF volSma > 0 THEN
   volNorm = min(volume / volSma, 3.0)
ELSE
   volNorm = 1.0
ENDIF

rawFlow = bodyRatio * volNorm
flowMax = highest[normLen](rawFlow)
flowMin = lowest[normLen](rawFlow)
IF flowMax > flowMin THEN
   flowNorm = (rawFlow - flowMin) / (flowMax - flowMin)
ELSE
   flowNorm = 0
ENDIF

// ===== Reversal detection =====
sellPressure = closePos < 0.35 AND close < open AND volNorm > 1.2
buyPressure = closePos > 0.65 AND close > open AND volNorm > 1.2
bullReversal = NOT trendUp AND buyPressure AND flowNorm > 0.5
bearReversal = trendUp AND sellPressure AND flowNorm > 0.5
anyReversal = bullReversal OR bearReversal

// ===== Trend color =====
IF trendUp THEN
   trR = bullR
   trG = bullG
   trB = bullB
ELSE
   trR = bearR
   trG = bearG
   trB = bearB
ENDIF

// ===== Price candle coloring (flow gradient carried on transparency) =====
// Pine color.from_gradient(priceScore, 0..1, new(trendCol,70), trendCol) -> alpha 77..255
IF flowNorm > 0 THEN
   priceScore = pow(flowNorm, 0.7)
ELSE
   priceScore = 0
ENDIF
alphaBody = round(77 + 178 * priceScore)

IF anyReversal THEN
   cr = revR
   cg = revG
   cb = revB
   ca = 255
ELSE
   cr = trR
   cg = trG
   cb = trB
   ca = alphaBody
ENDIF
IF paintBars = 1 THEN
   DRAWCANDLE(open, high, low, close) COLOURED(cr, cg, cb, ca)
ENDIF

// ===== Fuel candles (synthetic bars anchored to the baseline) =====
atrFuel = averagetruerange[200](close)
gap = atrFuel * candleOff
scaledH = flowNorm * atrFuel * heightMult
bullOpen = wma - gap
bullClose = bullOpen - scaledH
bearOpen = wma + gap
bearClose = bearOpen + scaledH

IF anyReversal THEN
   fr = revR
   fg = revG
   fb = revB
ELSE
   fr = trR
   fg = trG
   fb = trB
ENDIF
// Pine fuel transp 80..0 -> alpha 51..255
IF flowNorm > 0 THEN
   fuelPower = pow(flowNorm, 1.5)
ELSE
   fuelPower = 0
ENDIF
fuelAlpha = round(51 + 204 * fuelPower)

IF showFuel = 1 AND trendUp THEN
   DRAWCANDLE(bullOpen, bullOpen, bullClose, bullClose) COLOURED(fr, fg, fb, fuelAlpha)
ENDIF
IF showFuel = 1 AND NOT trendUp THEN
   DRAWCANDLE(bearOpen, bearClose, bearOpen, bearClose) COLOURED(fr, fg, fb, fuelAlpha)
ENDIF

// ===== Baseline glow =====
flowSma = average[8](flowNorm)
glowTransp = max(30, 80 - flowSma * 50)
alphaCore = round(255 * (1 - glowTransp / 100))
alphaGlow = round(255 * (1 - (glowTransp + 15) / 100))

IF showBase = 1 AND showGlow = 1 THEN
   glowVal = wma
ELSE
   glowVal = undefined
ENDIF
IF showBase = 1 THEN
   coreVal = wma
ELSE
   coreVal = undefined
ENDIF

RETURN glowVal COLOURED(trR, trG, trB, alphaGlow) STYLE(line, 5) AS "Glow", coreVal COLOURED(trR, trG, trB, alphaCore) STYLE(line, 2) AS "WMA Core"
Part 2 of 2 — Reversal Zones (apply on price; DrawOnLastBarOnly):
//--------------------------------------------------------//
// PRC_Flow Pressure Zones [Reversal Zones] (by BOSWaves)
// version = 0
// 13.07.2026
// Ivan Gonzalez @ www.prorealcode.com
// Sharing ProRealTime knowledge
//--------------------------------------------------------//
// Part 2 of 2: flow reversal zones (boxes + midline).
// Apply on the price chart (overlay).
DEFPARAM drawonlastbaronly = true

// ===== Inputs =====
wmaLen    = 80    // WMA baseline length
volLen    = 20    // Volume SMA length
normLen   = 80    // Flow normalization lookback
showZones = 1     // Show reversal zones (1/0)
zoneCD    = 31    // Zone cooldown (bars between two zones)
maxZones  = 3     // Max simultaneous zones
zoneATR   = 0.1   // Zone height (ATR multiple)

// ===== Colors (R,G,B) =====
bullR = 0
bullG = 255
bullB = 0
bearR = 255
bearG = 0
bearB = 0

// ===== WMA baseline & trend =====
wma = average[wmaLen,2](close)
trendUp = close > wma

// ===== Flow score =====
barRange = max(high - low, pipsize)
bodySize = abs(close - open)
bodyRatio = bodySize / barRange
closePos = (close - low) / barRange
volSma = average[volLen](volume)
IF volSma > 0 THEN
   volNorm = min(volume / volSma, 3.0)
ELSE
   volNorm = 1.0
ENDIF
rawFlow = bodyRatio * volNorm
flowMax = highest[normLen](rawFlow)
flowMin = lowest[normLen](rawFlow)
IF flowMax > flowMin THEN
   flowNorm = (rawFlow - flowMin) / (flowMax - flowMin)
ELSE
   flowNorm = 0
ENDIF

// ===== Reversal detection =====
sellPressure = closePos < 0.35 AND close < open AND volNorm > 1.2
buyPressure = closePos > 0.65 AND close > open AND volNorm > 1.2
bullReversal = NOT trendUp AND buyPressure AND flowNorm > 0.5
bearReversal = trendUp AND sellPressure AND flowNorm > 0.5
anyReversal = bullReversal OR bearReversal

atrZone = averagetruerange[200](close)

// ===== Zone state =====
// parallel arrays: $zTop $zBot $zMid $zLeft $zBull $zAlive ; nz = live count
IF barindex = 0 THEN
   nz = 0
   lastZoneBar = 0 - zoneCD
ENDIF

// (1) break detection on live zones
IF nz > 0 THEN
   FOR i = 1 TO nz DO
      IF $zBull[i] = 1 AND close < $zBot[i] AND close[1] < $zBot[i] THEN
         $zAlive[i] = 0
      ENDIF
      IF $zBull[i] = 0 AND close > $zTop[i] AND close[1] > $zTop[i] THEN
         $zAlive[i] = 0
      ENDIF
   NEXT
ENDIF

// (2) new-zone trigger (+ merge overlapping same-side zones)
createZone = 0
newBull = 0
newTop = 0
newBot = 0
myanchor = 0
IF showZones = 1 AND anyReversal AND barindex > 200 AND barindex - lastZoneBar >= zoneCD THEN
   createZone = 1
   lastZoneBar = barindex
   halfH = atrZone * zoneATR / 2
   IF bullReversal THEN
      newBull = 1
      myanchor = low
   ELSE
      newBull = 0
      myanchor = high
   ENDIF
   newTop = myanchor + halfH
   newBot = myanchor - halfH
   IF nz > 0 THEN
      FOR i = 1 TO nz DO
         IF $zAlive[i] = 1 AND $zBull[i] = newBull AND newBot < $zTop[i] AND newTop > $zBot[i] THEN
            $zAlive[i] = 0
         ENDIF
      NEXT
   ENDIF
ENDIF

// (3) compact arrays (drop dead zones, keep order)
w = 0
IF nz > 0 THEN
   FOR i = 1 TO nz DO
      IF $zAlive[i] = 1 THEN
         w = w + 1
         $zTop[w] = $zTop[i]
         $zBot[w] = $zBot[i]
         $zMid[w] = $zMid[i]
         $zLeft[w] = $zLeft[i]
         $zBull[w] = $zBull[i]
         $zAlive[w] = 1
      ENDIF
   NEXT
ENDIF
nz = w

// (4) enforce max zones (drop oldest) + push new zone
IF createZone = 1 THEN
   WHILE nz >= maxZones DO
      FOR i = 1 TO nz - 1 DO
         $zTop[i] = $zTop[i+1]
         $zBot[i] = $zBot[i+1]
         $zMid[i] = $zMid[i+1]
         $zLeft[i] = $zLeft[i+1]
         $zBull[i] = $zBull[i+1]
      NEXT
      nz = nz - 1
   WEND
   nz = nz + 1
   $zTop[nz] = newTop
   $zBot[nz] = newBot
   $zMid[nz] = myanchor
   $zLeft[nz] = barindex
   $zBull[nz] = newBull
   $zAlive[nz] = 1
ENDIF

// (5) draw live zones on the last bar
IF islastbarupdate THEN
   IF nz > 0 THEN
      rightX = barindex + 20
      FOR i = 1 TO nz DO
         IF $zBull[i] = 1 THEN
            cr = bullR
            cg = bullG
            cb = bullB
         ELSE
            cr = bearR
            cg = bearG
            cb = bearB
         ENDIF
         DRAWRECTANGLE($zLeft[i], $zTop[i], rightX, $zBot[i]) COLOURED(cr, cg, cb, 128) FILLCOLOR(cr, cg, cb, 38)
         DRAWSEGMENT($zLeft[i], $zMid[i], rightX, $zMid[i]) COLOURED(cr, cg, cb, 166) STYLE(dottedline2)
      NEXT
   ENDIF
ENDIF

RETURN