







Q-Trend
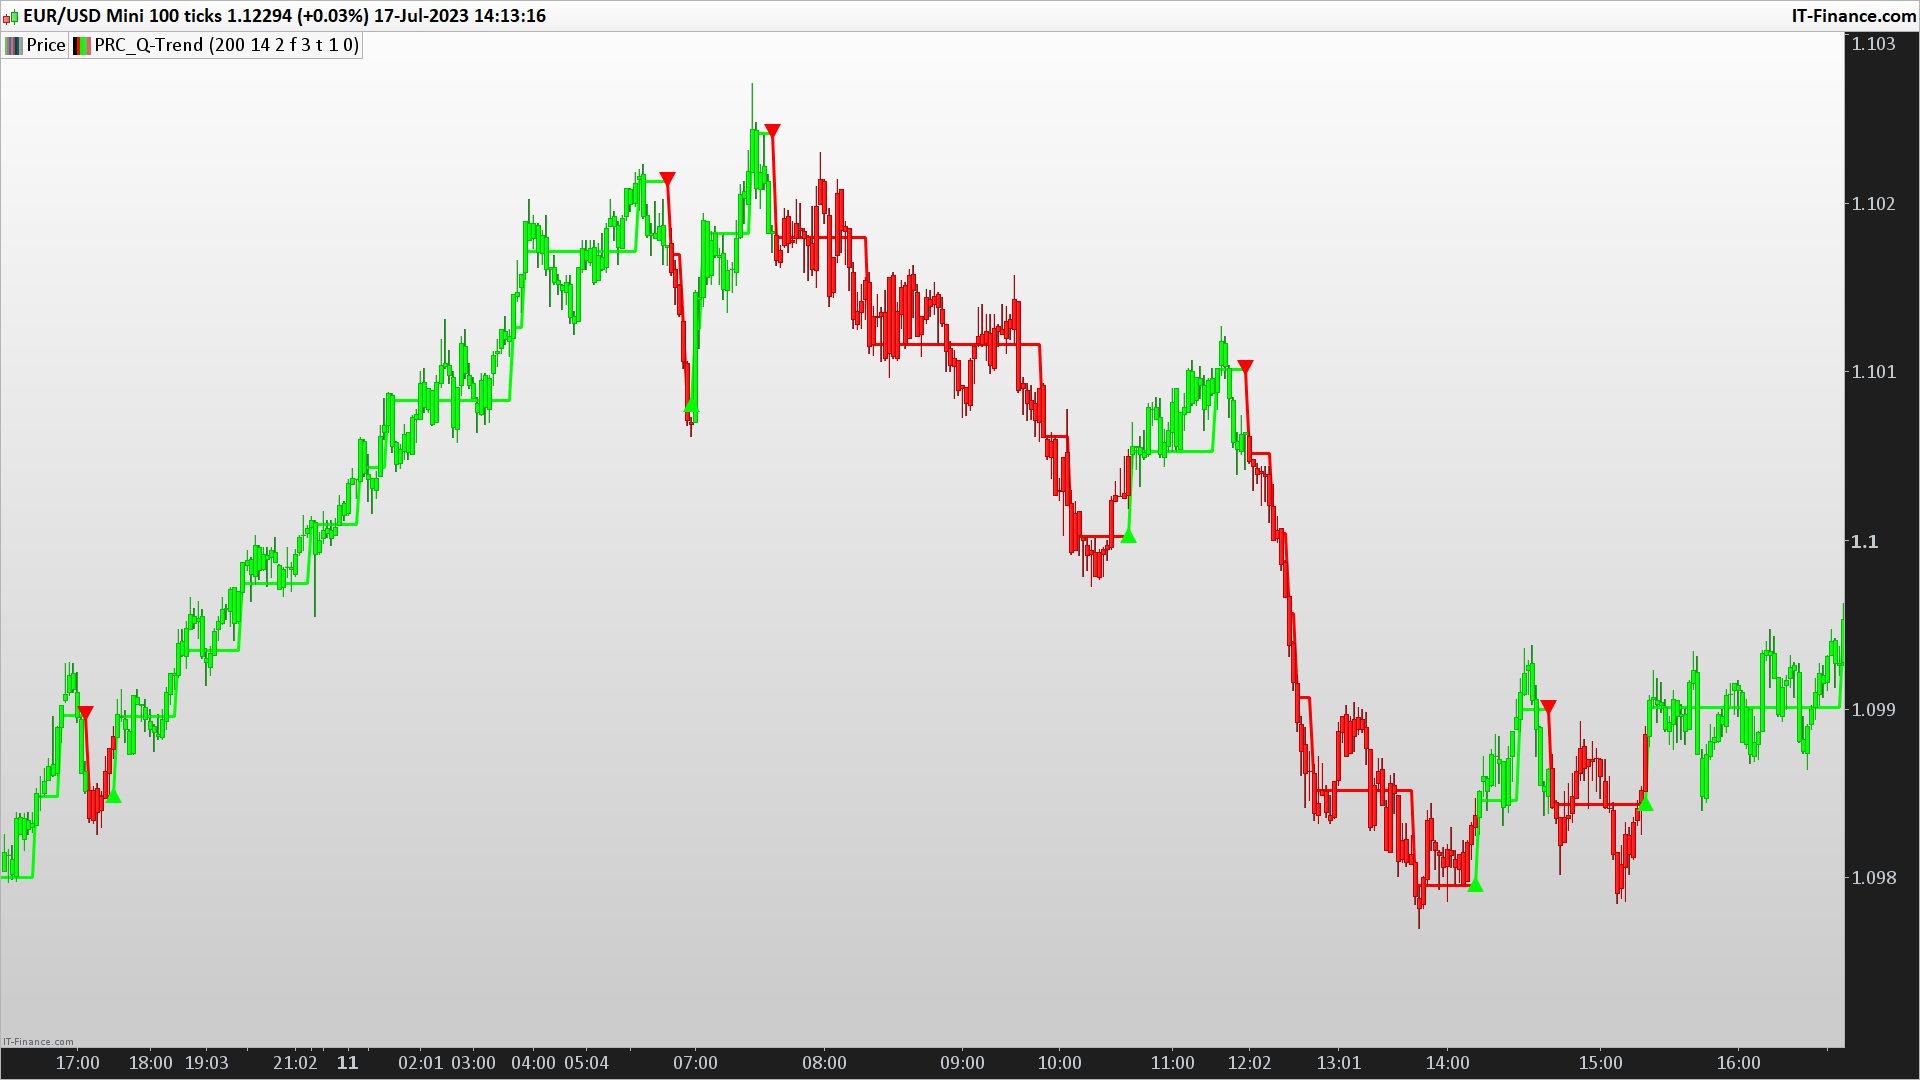
Q-Trend is an multipurpose indicatorm that can be used for swing- and trend-trading equally on any timeframe (non-volatile markets are better for this thing).
Settings:
- Trend period – used to calculate trend line in the special moments(will explain below);
- ATR Multiplier – changes sensitivity. The higher the multiplier = the more sensitive it is.
- Also option to smooth source data (helps get cleaner signals, as always).
How to use?
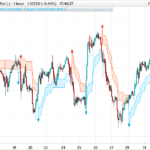
Signals are given on the chart. Also ou can use trend line as S/R line.
The idea behind:
Terms:
SRС = Source
TL = trend line;
MP = ATR multiplier;
ATR = ATR 🙂
TL = (highest of source P-bars back + lowest of source P-bars back) / 2
Epsilon = MP * ATR
I was thinking for a week about combining volatility and relation between highest and lowest price point. That why I called indicator Q-Trend = Quantitative Trend, as I was trying to think about price in a mathematical way.
Okay, time to go philosophical:
1) TL is shows good price trend, but as it is slow enough and not enough informative, we need add additional conditions to produce signals.
2) Okay, so what can we add as conditions? We need to take volatility into account, as it is crucial in the moments of market uncertainty. So let’s use ATR (Average True Range) somehow. My idea is that if SRC breaks TL + ATR, then it means that there will be upmove and we update our TL. Analogically for SRC breaking TL – ATR (breaks are crosses of TL +- ATR lines).
Conclusion:
– if SRC breaks TL + ATR, it is a BUY signal and update of trend line;
– if SRC breaks TL – ATR, it is a SELL signal and update of trend line;
(description from original author: tarasenko_)
//PRC_Q-Trend | indicator
//17.07.23
//Nicolas @ www.prorealcode.com
//Sharing ProRealTime knowledge

// ---settings
//p = 200 //Trend period
//atrp = 14 //ATR Period
//mult = 1.0 //ATR Multiplier
//mode = 1 //Signal mode options = [1="Type A", 2="Type B"]
//useemasmoother = 0 //Smooth source with EMA? 0=false ; 1=true
//srcemaperiod = 3 //EMA Smoother period
//colorbars = 0 //Color bars? 0=false ; 1=true
//signalsview = 0 //0 = trend inversion ; 1 = strong buy / strong sell only
// --- end of settings

source = customclose

// Calculations
if useemasmoother then
src = average[srcemaperiod,1](source)
else
src=source
endif

hh = highest[p](src) // Highest of src p-bars back;
ll = lowest[p](src) // Lowest of src p-bars back.
d = hh - ll

if barindex>p then
once m = (hh + ll) / 2 // Initial trend line;
atr = AverageTrueRange[atrp][1] // ATR;
epsilon = mult * atr // Epsilon is a mathematical variable used in many different theorems in order to simplify work with mathematical object. Here it used as sensitivity measure.

if mode=2 then  //type B
changeup = src crosses over m+epsilon or src crosses under m+epsilon
changedown = src crosses over m-epsilon or src crosses under m-epsilon
else
changeup = src crosses over m+epsilon or src > m+epsilon
changedown = src crosses under m-epsilon or src < m-epsilon
endif

sb = open < ll + d / 8 and open >= ll
ss = open > hh - d / 8 and open <= hh
strongbuy = sb or sb[1] or sb[2] or sb[3] or sb[4]
strongsell = ss or ss[1] or ss[2] or ss[3] or ss[4]

if (changeup or changedown) then
if changeup then
m=m + epsilon
elsif changedown then
m=m - epsilon
endif
else
m=m[1]
endif

if changeup then
r=0
g=255
elsif changedown then
r=255
g=0
endif

if colorbars then
drawcandle(open,high,low,close)coloured(r,g,0)
endif

if signalsview=1 then
if strongbuy and ls<>1 then
drawtext("▲",barindex,low) coloured("lime")
ls=1
endif
if strongsell and ls<>-1 then
drawtext("▼",barindex,high) coloured("red")
ls=-1
endif
else
if r<>r[1]and r>0 then
drawtext("▼",barindex[1],m[1]) coloured("red")
endif
if r<>r[1]and r=0 then
drawtext("▲",barindex[1],m[1]) coloured("lime")
endif
endif
endif


RETURN m style(line,3) coloured(r,g,0)
Comments
You must be logged in to post a comment.

Hello, I am trying to use this singal (in fact I have converted it to an indicateur giving Bull/Bear phases, but I would like to have it more sensitive, i.e would accept a higher lagging time before the indicator changes from Bull to Bear (or changes from green to red in the original version) does anybody have a clue on which parameters I should act ? Thanks in advance

Hello, Congratulations on this programming, it seems incredible to me, I am new to this but I would like to know if you have this automated Q-trend indicator, I think it is proorder, that it makes the entries and exits automatically in the color change, and if not Do you have it, how could I get it?... Thank you.


how to add this indicator to mt4 please


Hello everyone, Great work, thank you Nicolas for this indicator that I really appreciate. Would it be possible to create a sreener with the possibility of displaying weak and/or strong signals? a topic is already open : https://www.prorealcode.com/topic/creer-un-screener-base-sur-q-trend Thanks // edit: the screener is in the topic, thanks What about the strategy please: https://www.prorealcode.com/topic/strategy-based-on-q-trend



Thanks for great indicator. Translated it to a algo. How come I can´t get the strongbut and strongsell to work? // ---settings p = 200 //Trend period atrp = 14 //ATR Period mult = 1.0 //ATR Multiplier mode = 1 //Signal mode options = [1="Type A", 2="Type B"] useemasmoother = 0 //Smooth source with EMA? 0=false ; 1=true srcemaperiod = 3 //EMA Smoother period colorbars = 0 //Color bars? 0=false ; 1=true signalsview = 1 //0 = trend inversion ; 1 = strong buy / strong sell only // --- end of settings Ls=1 source = customclose // Calculations if useemasmoother then src = average[srcemaperiod,1](source) else src=source endif hh = highest[p](src) // Highest of src p-bars back; ll = lowest[p](src) // Lowest of src p-bars back. d = hh - ll if barindex>p then once m = (hh + ll) / 2 // Initial trend line; atr = AverageTrueRange[atrp][1] // ATR; epsilon = mult * atr // Epsilon is a mathematical variable used in many different theorems in order to simplify work with mathematical object. Here it used as sensitivity measure. if mode=2 then //type B changeup = src crosses over m+epsilon or src crosses under m+epsilon changedown = src crosses over m-epsilon or src crosses under m-epsilon else changeup = src crosses over m+epsilon or src > m+epsilon changedown = src crosses under m-epsilon or src < m-epsilon endif sb = open < ll + d / 8 and open >= ll ss = open > hh - d / 8 and open <= hh strongbuy = sb or sb[1] or sb[2] or sb[3] or sb[4] strongsell = ss or ss[1] or ss[2] or ss[3] or ss[4] endif if (changeup or changedown) then if changeup then m=m + epsilon elsif changedown then m=m - epsilon endif else m=m[1] endif if changeup then r=0 g=255 elsif changedown then r=255 g=0 endif if signalsview=1 then if strongbuy and ls<>1 then buy at market endif if strongsell and ls<>-1 then sell at market endif //if r<>r[1]and r>0 then //sell at market //endif //if r<>r[1]and r=0 then //buy at market //endif endif


Buenos dias,alguien me podria decir como se descargar el archivo o el indicador Q-Trend??,ya que solo se me ha descargado un archivo ue no puedo abrir con el nombre PRC_Q-Trend.itf???