

myOpening Range, one for EU and USA
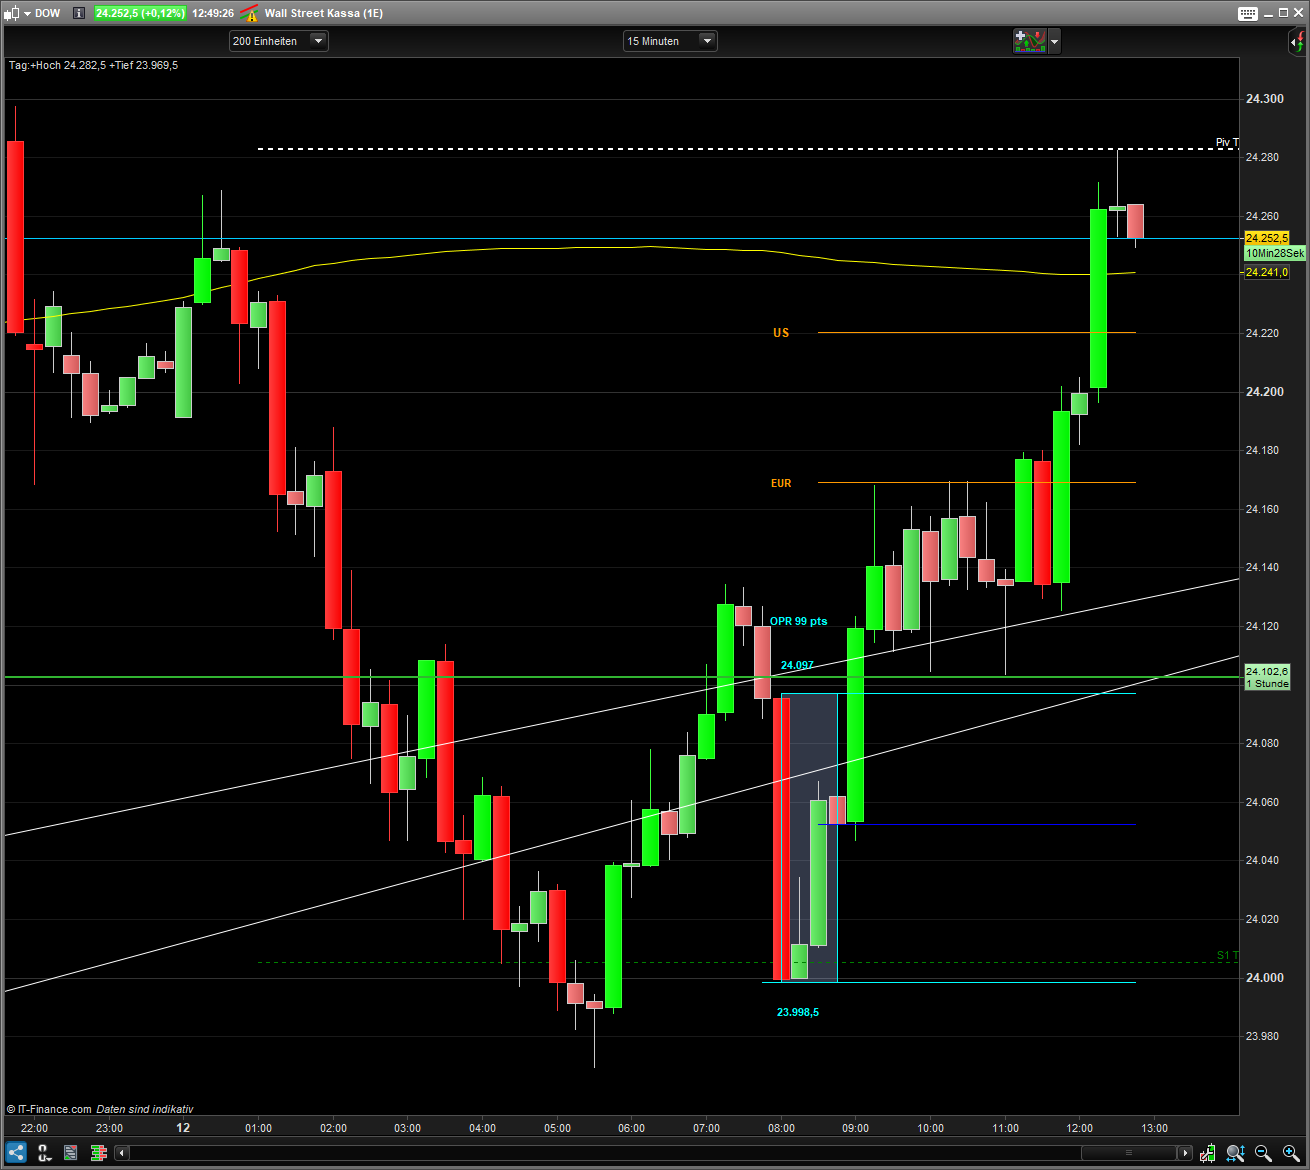
► This Indicator draws a rectangle around the candlesticks formed during the Pre-opening of the European Session, it provides the minimum, maximum values as well as the difference and draws segments from the highest and the lowest until the closing of the American Session…
Checkboxes
– “Info” Shows or hides alphanumeric information
– “HighLow” Shows or hides the lines (higher / lower)
– “Box” Shows or hides the rectangle of Pre-opening Range
– “OpenClose” Schows or hides the open and close as line
Two variables used to
– “Alpha” Adjust the transparency of text and lines (0 to 255)
– “Delta” Adjusts the information (above and below) of the rectangle
(to adjust according to the selected asset)
Time variables have to be adjusted in the code, if necessary or desired.
!!!!!!! ONLY TIMEFRAME 1, 5, 10, 15 or 30 minutes !!!!!!
Sometimes there is an error “highest” in the EUR version. I do not find any errors and assume it comes from the data feed.
This is an update from https://www.prorealcode.com/prorealtime-indicators/opening-range-eur-with-close-and-open-timeframedetection-for-configuration-with-1-5-10-15-30min-charts/
I trade this in combination with myCandle V 1.4, MyOutsidebar+Stop, MyThermometer
// Opening Range EUR with Close and Open.
// Added some changes and features.
// - segment for opening price;
// - segment for yesterday's closing price;
// - Automatic detection of the timeframe;
// - Automatic configuration for 1-5-10-15-30min charts.
// 17.06.2019 (Release 1.1)
// 10.05.2020 (Release 1.2)
// Thomas Geisler
// Sharing ProRealTime knowledge
// Original basis was Pre-Market EUR (Opening Range) | Graph Indicator Ver. 1.0
// from Swapping

// --- property settings
//Info    = 1   // show pints and range of OPR
//Delta   = 10  // gap number/rectangle
//Alpha   = 255 // transparency letter
//HighLow = 1   // show line OPR
//Box     = 1   // show OPR Box
//OpenClose = 1  // show opening and close as line
// --- end

DefParam CalculateOnLastBars = 1400 // enough for one day (23h) when using 1min timeframe

// --- init
alpha = max(alpha,0)
alpha = min(alpha,255)
// --- end

//TP = round(AverageTrueRange[10](close[0]))/2

//Automatic time detection
once NbBar = 1
if BarIndex < NbBar+2 then
MyDay=openday
dayminutes = 1440*(MyDay-MyDay[1])
MyHour=openhour
hourminutes = 60*(MyHour-MyHour[1])
MyMin=openminute
barminutes = MyMin - MyMin[1] + hourminutes + dayminutes
barminutes=abs(barminutes)
Mybarminutes = lowest[NbBar](barminutes)[1]
endif

// Select timeframe between 1 and max 30 minutes to define the parameters for drawing
if Mybarminutes = 1  then
Frame = 60
myStart = 080100
elsif Mybarminutes = 5 then // 5 minutes
Frame = 12 // 12 candels
myStart = 080500 // opening plus 5 min
elsif Mybarminutes = 10 then
Frame = 6
myStart = 081000
elsif Mybarminutes = 15 then
Frame = 4
myStart = 081500
elsif Mybarminutes = 30 then
Frame = 2
myStart = 083000
endif

starttime = myStart // 08h00 Depending on the timeframe
endtime = 090000   // 09h00

if time = starttime then
startbar = barindex
endif
if time = endtime then
endbar = barindex
endif

if time >= starttime and time <= endtime then
if high > hh then
hh = high
endif
if low < ll or ll = 0 then
ll = low
endif
endif

if intradaybarindex = 0 then
hh = 0
ll = 0
endif

//EUR Close
if time = 173000 then //Close Yesterday at time 17:30
cleu = close
endif
// US Close
if time = 220000 then //Close Yesterday at time 17:30
clus = close
endif
If Box = 1 then
if date = today and time > endtime then //draw Box OpenRange (OPR) only for today
DrawRectangle(startbar,hh,endbar,ll) coloured(0,255,255,alpha) // alpha (transparence)
endif
endif

if date = today and time = endtime then // High/Low/Opening only for today
upper = highest[Frame](high)
lower = lowest[Frame](low)
op = close
dif = round(abs(upper-lower))
info = info // draw the info OPR, High, Low, Using Timeframe as text
elsif date = today and info = 1 then
DrawText("OPR #dif#pts",startbar+1,upper+(delta+15),Dialog,Bold,11) coloured(0,255,255,alpha)
DrawText("#hh#",startbar+1,upper+(delta),Dialog,Bold,11) coloured(0,255,255,alpha)
DrawText("#ll#",startbar+1,lower-(delta),Dialog,Bold,11) coloured(0,255,255,alpha)
endif

if date = today and time >= endtime and time <= 210000 then
If HighLow = 1 then  // Draw Segment High,Low and Opening from OPR, as Support/Resist
//DrawSegment(barindex-HighLow,upper,barindex,upper) coloured(0,255,255,alpha) // High OPR
//DrawSegment(barindex-HighLow,lower,barindex,lower) coloured(0,255,255,alpha) // Low OPR
DrawSegment(startbar,upper,barindex,upper) coloured(0,255,255,alpha) // High OPR
DrawSegment(startbar-HighLow,lower,barindex,lower) coloured(0,255,255,alpha) // Low OPR
endif
If OpenClose = 1 then// Draw Segment High,Low and Opening from OPR, as Support/Resist, to select time
DrawSegment(barindex-OpenClose,op,barindex,op) coloured(0,0,255,alpha) // Opening
DrawSegment(barindex-OpenClose,cleu,barindex,cleu) coloured(255,153,0,alpha)  //Close EUR Yesterday
DrawText("EUR",startbar,cleu,Dialog,Bold,11) coloured(255,153,0,alpha)
DrawSegment(barindex-OpenClose,clus,barindex,clus) coloured(255,153,0,alpha)  //Close US Yesterday
DrawText("US",startbar,clus,SansSerif,Bold,12) coloured(255,153,0,alpha)
endif
endif

return