
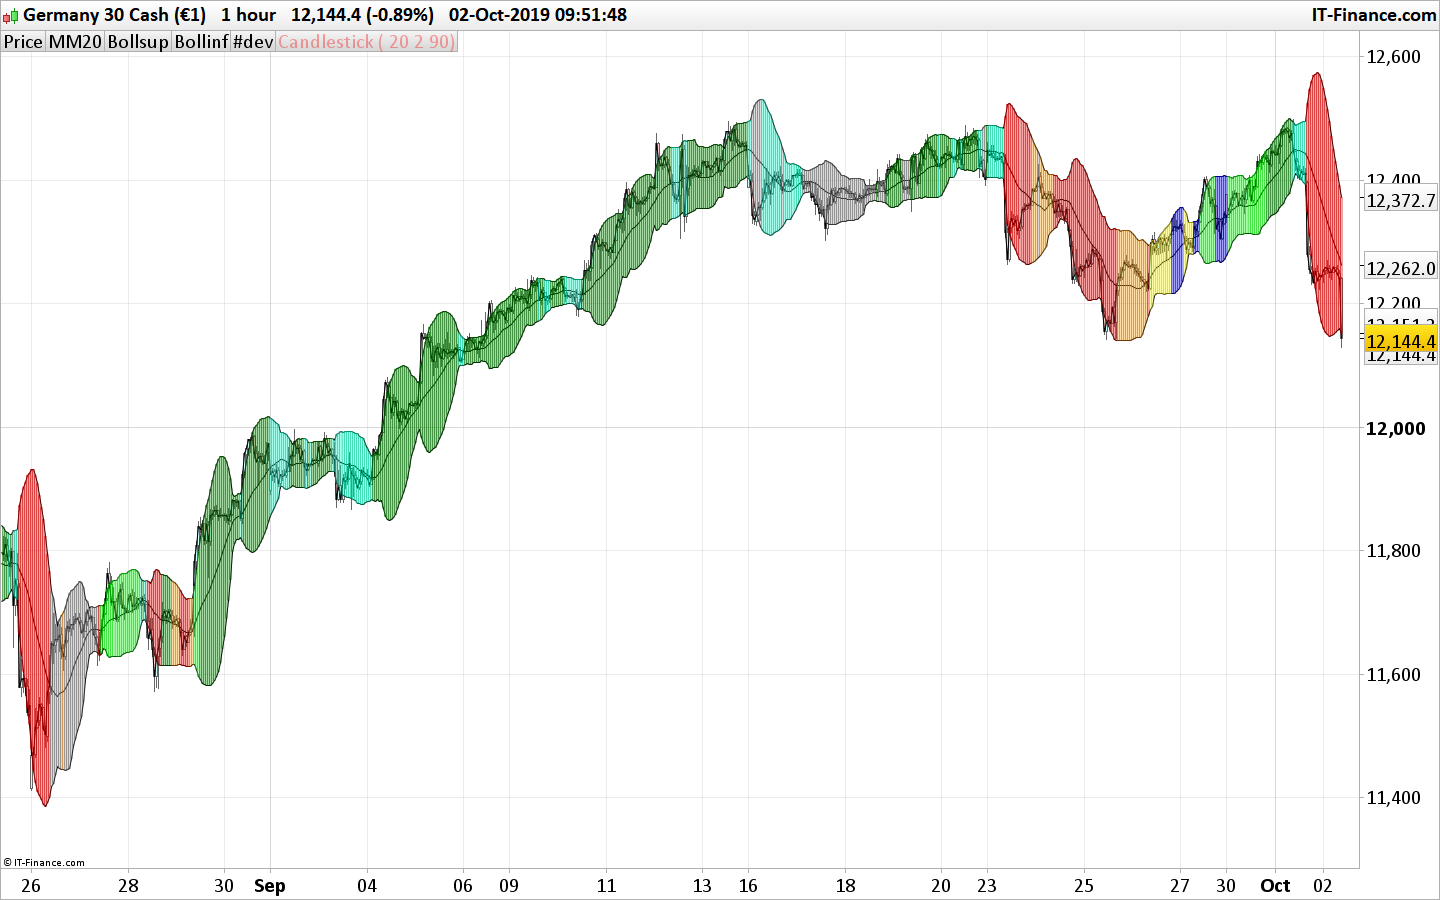
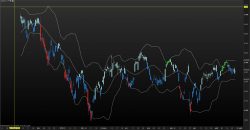
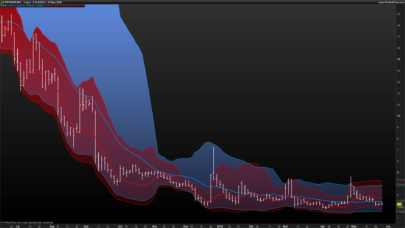
Multicolour Bollinger Bands indicator that indicates market phases. It plots on the price chart, thanks to different color zones between the bands, a breakdown of the different phases that the price operates during a trend.
The different zones are identified as follows:
- red color zone: trend is bearish, price is below the 200 periods moving average
- orange color zone: price operate a technical rebound below the 200 periods moving average
- yellow color zone: (phase 1 which indicate a new bearish cycle)
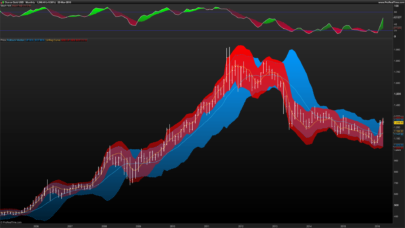
- light green zone: (phase 2 which indicate a new bullish cycle)
- dark green zone: trend is bullish, price is above the 200 periods moving average
- grey color zone: calm phase of price
- dark blue color zone: price is consolidating in either bullish or bearish trend
- light blue zones: price will revert to a new opposite trend (either long or short new trend)
By identifying clearly the different market phases with the multicolour bollinger bands, the market entries by either a the beginning of a new trend or just after a rebound or a consolidating phase is easier to spot on.
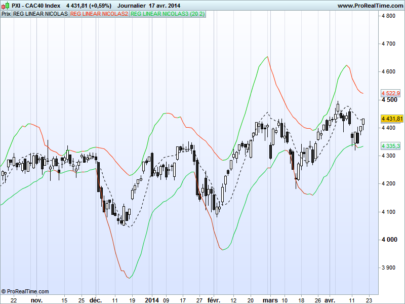
A lot of other indicators with bollinger bands can be found in the prorealtime codes library on the website. Be sure to look at them to perfectly understand how the multicolour bollinger bands can help you in your trading, whatever trading style suit you the most!
Definition of bollinger bands in wikipedia: https://en.wikipedia.org/wiki/Bollinger_Bands
|
1 2 3 4 5 6 7 8 9 10 11 12 13 14 15 16 17 18 19 20 21 22 23 24 25 26 27 28 29 30 31 32 33 34 35 36 37 38 39 40 41 42 43 44 45 46 47 48 49 50 51 52 53 54 55 56 57 58 59 60 61 62 63 64 65 66 67 68 69 70 71 72 73 74 75 76 77 78 79 80 81 82 83 84 85 86 87 88 89 90 |
// BB20 MULTICOLORE 30/09/2019 p = 20 //bb20 period dev = 2.0 //std deviation factor x = 90 //background alpha MM20=average[20](close) MM50=average[50](close) MM100=average[100](close) MM200=average[200](close) BollSup =Average[p](close)+dev*std[p](close) BollInf = Average[p](close)-dev*std[p](close) //rouge (baissier prix sous moyenne mobile 200 c1= (close<MM200) if c1 then Indicateur = close//Indicateur=1 r=250 g=0 b=0 ENDIF //orange( rebond technique) c2= c1 and(MM20<close) if c2 then Indicateur=close //=1 r=255 g=160 b=0 ENDIF //jaune (phase1 nouveau cycle) c3= c1 and(MM50<close)and(mm50<mm200)and(close<mm200) if c3 then Indicateur=close //=1 r=800 g=250 b=0 ENDIF //vert fluo ( phase 2 nouveau cycle) c4= (MM200<close)and(MM50<close)and(MM50<MM200) if c4 then Indicateur=close //=1 r=0 g=300 b=0 ENDIF //vert foncé ( au dessus de tte moyenne mobile, cycle mur) C5= (MM200<MM50)and(MM50<close)and(MM20<close) if c5 then Indicateur=close //=1 r=0 g=150 b=0 ENDIF //bleu (retournement de tendance) c6= (MM100<MM200) and(MM50<MM200)and (close<MM200)and(MM100<close)and(MM50<MM100) if c6 then Indicateur=close //=1 r=0 g=0 b=300 ENDIF //bleu (retournement de tendance 2 ) c6bis= (MM100<MM200) and(MM50<MM200)and (close<MM200)and(MM50<close)and(MM100<MM50) if c6bis then Indicateur=close //=1 r=0 g=0 b=300 ENDIF //gris (phase 5 affaiblissement ou retournement à la baisse, neutre) c7= (MM200<close) and(close<MM100)and (MM200<MM100)and(MM200<MM50) if c7 then Indicateur=close //=1 r=150 g=150 b=150 ENDIF //bleu bouteille (consolidation) c8=(MM200<MM50)and(MM200<close)and(MM100<close)and((close<MM50)or(close<MM20)) if c8 then Indicateur=close //=1 r=0 g=250 b=200 ENDIF max1=Bollsup min1=Bollinf DRAWCANDLE(max1, min1, max1, min1)coloured(R,G,B,x) RETURN MM20 style(line) as "MM20" , Bollsup as "Bollsup",Bollinf as "Bollinf", indicateur |
Share this
No information on this site is investment advice or a solicitation to buy or sell any financial instrument. Past performance is not indicative of future results. Trading may expose you to risk of loss greater than your deposits and is only suitable for experienced investors who have sufficient financial means to bear such risk.
ProRealTime ITF files and other attachments :
Find other exclusive trading pro-tools on ![]()
PRC is also on YouTube, subscribe to our channel for exclusive content and tutorials


Could you suggest any trading concepts with this indicator ?
Hello Jan
All is discribe into the code , you may translate french to netherland if you want
have a nice day
What I meant is if you could suggest a trading concept: for instance if the color becomes dark green, open long buy, sell when become light blue or grey.
(your corresponding code (//vert foncé ( au dessus de tte moyenne mobile, cycle mur) C5= (MM200<MM50)and(MM50<close)and(MM20<close))
With combining moving averages, often delayed trade triggers are generated ( the actual close have moved too far in the direction), which will reduce or erase profits
So I wonder if you could suggest a general trading concept which generally speaking generates acceptable trade signals, based upon using this model.
Thanks in advance
Hello Jan
You must use this code in correspondence with other indicators, a code alone does not mean anything.
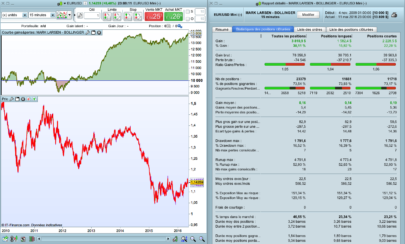
However looking at the history of a value one can observe areas of purchase or sale.
everyone can interpret them
good trades
Hi, this looks very good is this something you worked towards a strategy?
Bonjour
comment mettre ce programme sur un graphique le lien est en JPG et sur crewation il y un message d erreur manque return mais cette indication existe sur le programme cordialement
Hola! El archivo itf donde esta?