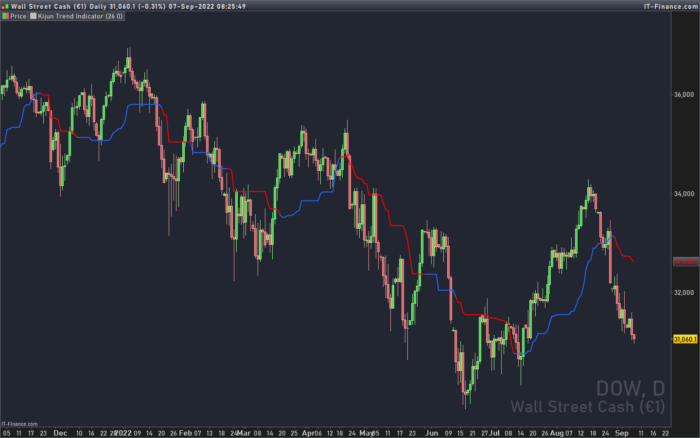
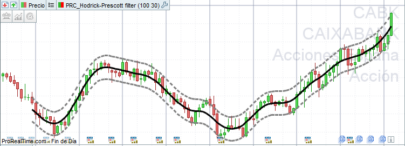
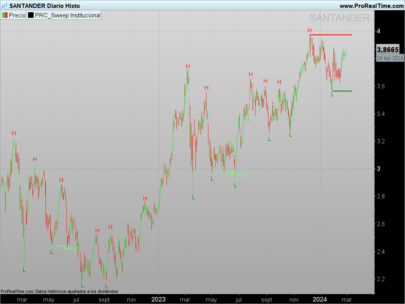
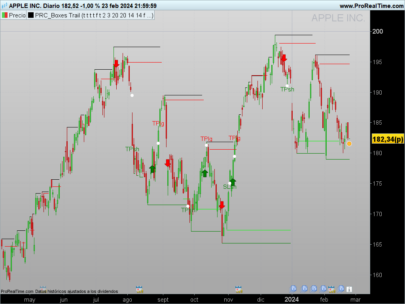
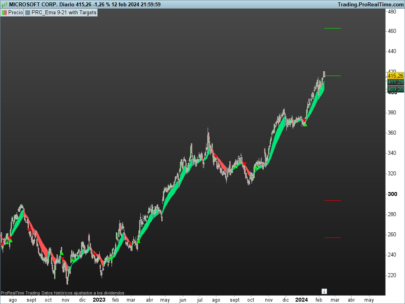
Suggested usage: In a trending market, to understand when it is good to enter short (red line) and when to enter long (blue line).
Technical Analysis: The original idea was taken from Larry Williams: an uptrend is identified when the price is above an 18-period simple moving average ( SMA ) and when at least two candles do not touch the simple moving average with their lows. The opposite is true for a downtrend.
Corrado Rondelli has therefore reinterpreted with Ichimoku aka “ichimokized” replacing the 18-period Simple Moving Average with the 26-period Kijun – as per the original Ichimoku settings.
In order to make the indicator more flexible an Exponential Moving Average ( EMA ) has also been added.
The indicator plots the chosen line that becomes red when it is good to enter short and blue when it is good to enter long.
Configuration:
– Length: period to be used to calculate the line.
– Type: the line type that can be the Kijun (26-period) or SMA / EMA (18-period)
(description from the original author: TheSocialCryptoClub)
|
1 2 3 4 5 6 7 8 9 10 11 12 13 14 15 16 17 18 19 20 21 22 23 24 25 26 27 28 29 30 31 32 33 34 35 36 37 38 39 |
//PRC_KijunTrend indicator | indicator //07.09.2022 //Nicolas @ www.prorealcode.com //Sharing ProRealTime knowledge //converted from pinescript // --- settings mylineperiods = 26 //Length mylinetype = 0 //0=Kijun, 1=SMA, 2=EMA // --- end of settings // default line is Kijun if mylinetype=0 then myline = KijunSen[9,mylineperiods,52] // or SMA elsif mylinetype=1 then myline = average[mylineperiods] // or EMA else myline = average[mylineperiods,1] endif // filter conditions long = low[1]>myline[1] and low[2]>myline[2] and low[3] <= myline[3] short = high[1]<myline[1] and high[2]<myline[2] and high[3]>= myline[3] // color the line if long then r=41 g=98 b=255 elsif short then r=255 g=0 b=0 endif // plot return myline coloured(r,g,b) style(line,2) as "Kijun Trend Indicator" |
Share this
No information on this site is investment advice or a solicitation to buy or sell any financial instrument. Past performance is not indicative of future results. Trading may expose you to risk of loss greater than your deposits and is only suitable for experienced investors who have sufficient financial means to bear such risk.
ProRealTime ITF files and other attachments :
Find other exclusive trading pro-tools on ![]()
PRC is also on YouTube, subscribe to our channel for exclusive content and tutorials


Nicolas,
buongiorno.
Grazie del cortese aiuto.
Buona giornata.
Carlo
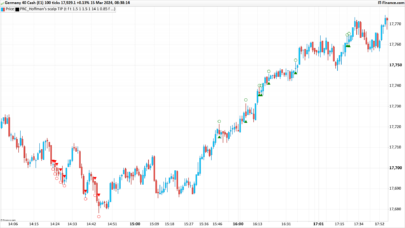
Thanks Nicolas, it seems to work well on 1H TF on Dax. !!!