





FVG Breaker Zones: Fair Value Gaps That Flip Into Breakers
Introduction
A fair value gap (FVG) is the hole a fast candle leaves behind: three candles in a row where the wicks of the first and the third do not overlap. Many traders treat that hole as a zone price is likely to come back to.
What happens when price does come back and goes straight through it? The zone does not simply stop mattering. A bullish gap that has been broken from above often works as resistance on the next visit, and a broken bearish gap as support. That flipped zone is called a breaker.
FVG Breaker Zones follows every gap through that whole life: it detects it, tracks it while it holds, turns it into a breaker when it breaks, and removes the breaker once price goes back through its other side. Older zones that overlap the newest ones are hidden, so the chart keeps only the levels that still mean something.
Theory Behind the Indicator
1. Detecting the gap
- Bullish FVG: the low of the current bar is above the high of two bars back.
- Bearish FVG: the high of the current bar is below the low of two bars back.
An optional filter, the ATR threshold, looks at the middle candle of the three: for a bullish gap it must close above its own low by at least that many ATR(200), and for a bearish gap below its own high. With the default value of 0 the filter only rejects a middle candle that closes exactly on its low (or high).
The gap is registered one bar after the pattern is complete. Its top and bottom are the two wicks that leave the hole, and the zone starts on the first of the three candles. The indicator needs 200 bars of history for its ATR before it starts detecting gaps.
2. From gap to breaker
On every bar, each gap that has not been broken yet is checked against the current candle with the chosen mitigation method:
- Close: the candle body (the lower of open and close for a bullish gap, the higher for a bearish one) crosses beyond the zone.
- Wick: the wick crosses beyond the zone.
- Avg: the wick crosses the zone midpoint.
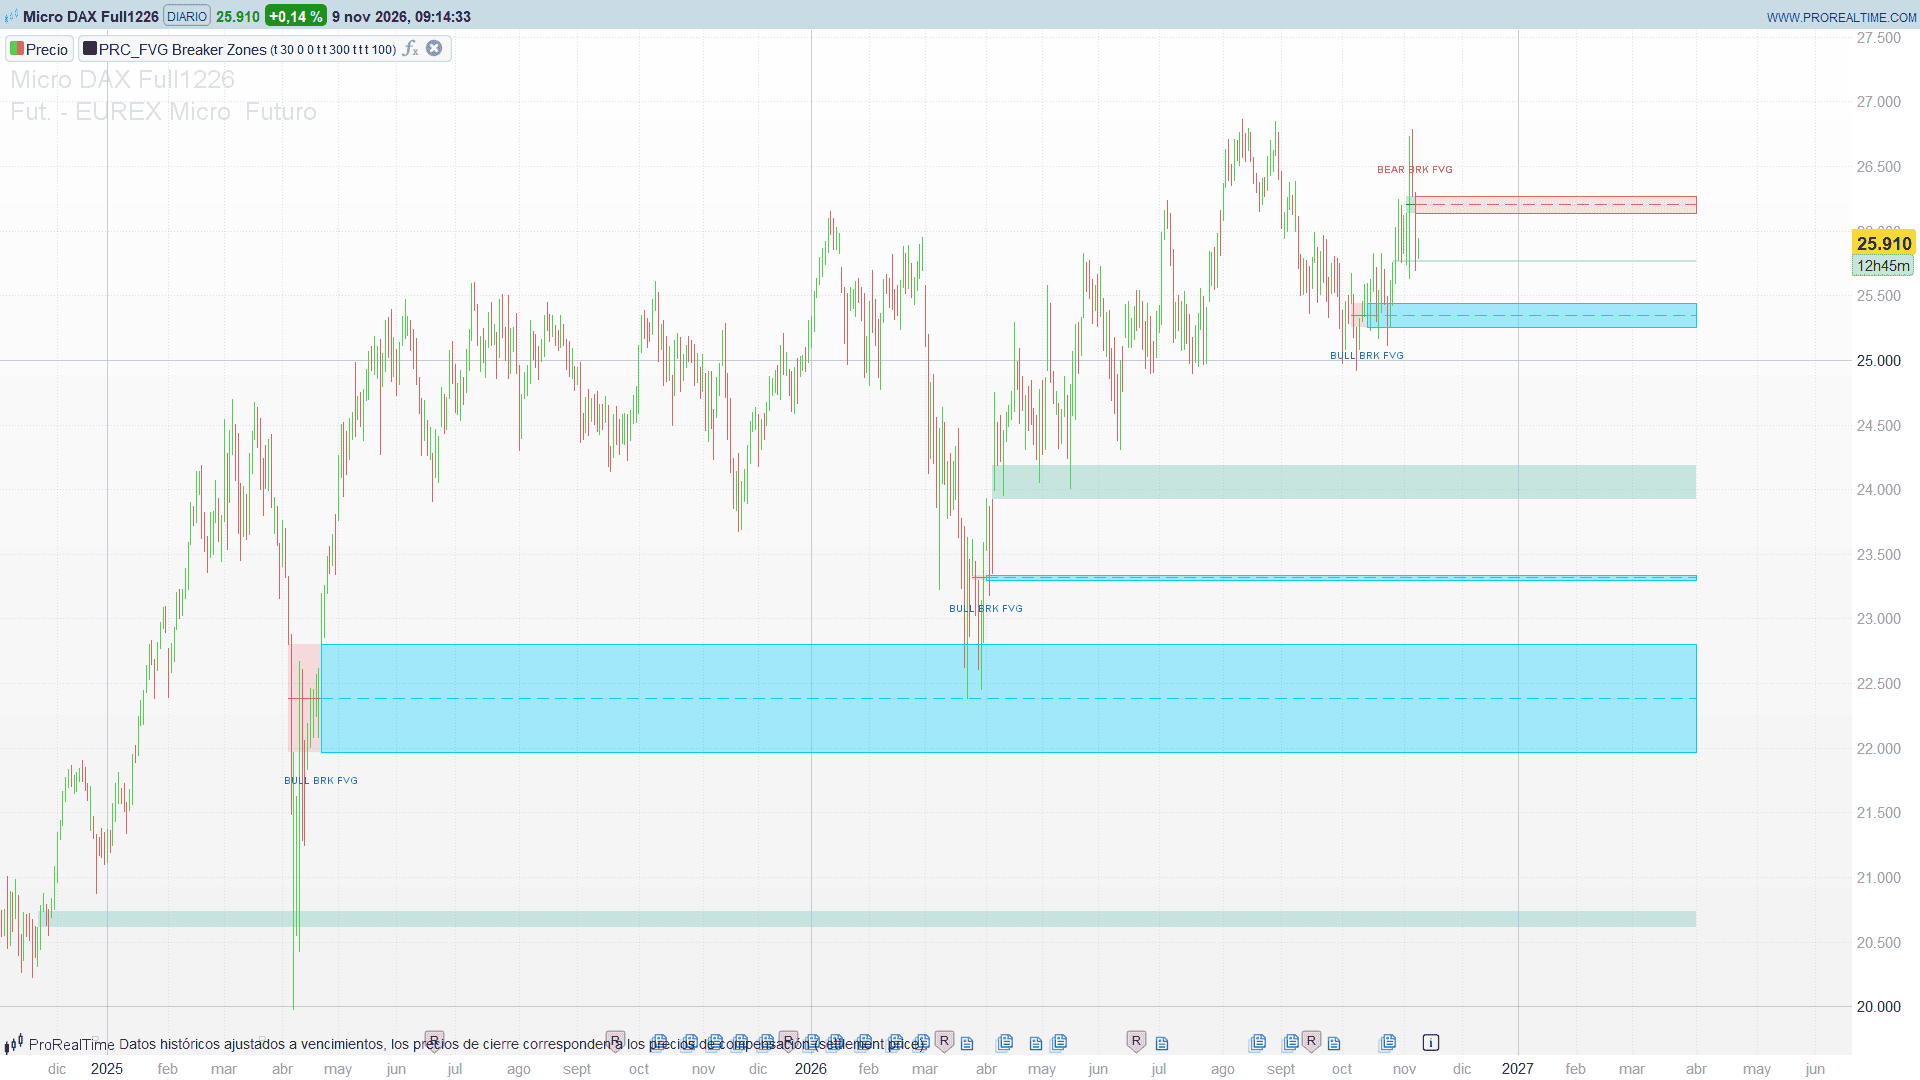
A bullish gap broken downwards becomes a bearish breaker; a bearish gap broken upwards becomes a bullish breaker. The original gap is drawn up to the bar of the break, and the breaker from there on, with a border, a dashed midline and a “BULL BRK FVG” or “BEAR BRK FVG” label.
3. When a breaker stops counting
A breaker is removed when price goes back through its other side, using the same method: a bearish breaker (an old bullish gap) disappears when price climbs back above its top, and a bullish breaker when price falls back below its bottom.
4. Overlap filter
With Hide Overlap on, after the breaks are processed:
- older zones that overlap the newest zone of the same side are removed;
- bullish zones that overlap the newest bearish zone are removed;
- bearish zones that overlap the newest remaining bullish zone are removed.
This is what keeps the chart readable in a trend: each new gap replaces the older ones it sits on top of.
Key Features at a Glance
- Bullish and bearish fair value gaps with an optional ATR(200) filter.
- Automatic conversion of broken gaps into breakers, with three mitigation methods (body, wick, midpoint).
- Breakers removed when price goes back through them.
- Overlap filter inside each side and across sides.
- The last N zones per side, extended to the right or ending at the current bar.
- Solid midline before the break, dashed after it, and “BULL BRK FVG” / “BEAR BRK FVG” labels.
How to Read the Indicator
- Green box: a bullish FVG that price has not broken yet.
- Red box: a bearish FVG that price has not broken yet.
- Box that changes colour with a border: a breaker. The first part, in the colour of the original gap, shows how long the gap held; the bordered part starts on the candle that broke it.
- Light blue breaker, “BULL BRK FVG” below it: an old bearish gap that price broke upwards, now a possible support.
- Pink breaker, “BEAR BRK FVG” above it: an old bullish gap that price broke downwards, now a possible resistance.
- Dashed midline: the middle of the breaker. With the Avg method this is the level that decides when the zone stops counting.
Practical Applications
- Retest entries: wait for price to come back to a breaker from the other side and look for a reaction there, rather than buying or selling the first touch of a fresh gap.
- Bias filter: a series of bullish breakers under price, with the bearish ones being removed, describes a market that keeps absorbing supply.
- Choosing the method: Close (body) keeps zones alive through wicks and suits noisy intraday charts; Wick reacts on the first touch; Avg sits in between, using the midpoint.
These are reading ideas, not tested trading rules.
Indicator Configuration
All parameters sit at the top of the code. Declare them as variables to change them from the indicator settings:
- showRegularFVG (default: 1): show gaps that have not been broken yet.
- showLast (default: 30): number of zones drawn per side, newest first (1 to 100).
- fvgThreshold (default: 0): ATR(200) multiple the middle candle must close beyond its low or high (0 to 2).
- mitigationMethod (default: 0): 0 = Close (candle body), 1 = Wick, 2 = Avg (zone midpoint).
- hideOverlap (default: 1): remove older zones that overlap the newest ones.
- extendFVG (default: 1): extend the live zones to the right (by extendBars, 100 bars).
- maxTracked (default: 300): zones kept in memory per side (20 to 1000).
- showBreakers (default: 1): show breaker zones.
- showMidline (default: 1): midline, solid before the break and dashed after it.
- showLabels (default: 1): “BULL BRK FVG” / “BEAR BRK FVG” labels.
Colours are set in the drawing section at the end of the code.
Code
//--------------------------------------------
// PRC_FVG Breaker Zones
// version = 0
// 02.11.2026
// Iván González @ www.prorealcode.com
// Sharing ProRealTime knowledge
//--------------------------------------------
// Fair value gaps that flip into breakers.
// - A bullish FVG (low above the high of two bars back) turns into a
//   BEARISH breaker when price breaks below it. A bearish FVG turns
//   into a BULLISH breaker when price breaks above it.
// - A breaker is removed when price goes back through its other side.
// - Older zones that overlap the newest ones are hidden.
// - An FVG is registered one bar after its 3-candle pattern completes.
//--------------------------------------------
DEFPARAM DRAWONLASTBARONLY = true

// ===================== FAIR VALUE GAPS =====================
showRegularFVG = 1    // 1 = show FVGs that have not been broken yet
showLast = 30         // zones drawn per direction, newest first (1 to 100)
fvgThreshold = 0      // ATR(200) multiple the middle candle must close beyond its low/high (0 to 2)
mitigationMethod = 0  // 0 = Close (candle body), 1 = Wick, 2 = Avg (zone midpoint)
hideOverlap = 1       // 1 = remove older zones that overlap the newest ones
extendFVG = 1         // 1 = extend live zones to the right
maxTracked = 300      // zones kept in memory per direction (20 to 1000)

// ===================== BREAKER FVG =====================
showBreakers = 1      // 1 = show breaker FVGs
showMidline = 1       // 1 = midline, solid before the break and dashed after it
showLabels = 1        // 1 = "BULL BRK FVG" / "BEAR BRK FVG" labels

// ===================== STYLE =====================
// Bullish FVG 8,153,129 / Bearish FVG 242,54,69 (fill alpha 51)
// Bullish breaker 0,207,255 (fill alpha 89) / Bearish breaker 231,130,130 (fill alpha 51)
// Labels use a darker shade of the breaker colour so they read on a light background
extendBars = 100      // how far extended zones reach to the right (bars)

nLast = min(100, max(1, round(showLast)))
maxTrk = min(1000, max(20, round(maxTracked)))
stride = maxTrk + 2

// ===================== ATR =====================
IF barindex >= 199 THEN
   atrV = averagetruerange[200](close)
ENDIF
atr14 = averagetruerange[14](close)

// ===================== FVG DETECTION =====================
upFvg = 0
dnFvg = 0
IF barindex >= 200 THEN
   blth = low[1] + atrV[1] * fvgThreshold
   brth = high[1] - atrV[1] * fvgThreshold
   IF low > high[2] AND close[1] > blth THEN
      upFvg = 1
   ENDIF
   IF low[2] > high AND brth > close[1] THEN
      dnFvg = 1
   ENDIF
ENDIF

// ===================== ZONE STATE =====================
// Two pools, p = 0 bullish FVGs and p = 1 bearish FVGs, oldest first.
// Each pool has TWO copies, one per bar parity: a bar reads the copy left
// by the previous bar and rebuilds its own, so every tick of the live bar
// starts again from the state at the previous close (arrays are NOT rewound
// between ticks the way scalars are).
// Slot fields: $zT top, $zB bottom, $zL first bar, $zX bar of the break,
// $zK state: 0 = FVG, 1 = breaker, -1 = removed during this bar.
pb = barindex MOD 2
IF barindex = 0 THEN
   n0 = 0
   n1 = 0
ENDIF
FOR p = 0 TO 1 DO
   IF p = 0 THEN
      nOld = n0
   ELSE
      nOld = n1
   ENDIF
   bNow = (2 * p + pb) * stride
   bPrev = (2 * p + 1 - pb) * stride
   // copy the zones alive at the previous close, keeping the newest maxTrk
   nAlive = 0
   IF nOld > 0 THEN
      FOR i = 0 TO nOld - 1 DO
         IF $zK[bPrev + i] >= 0 THEN
            nAlive = nAlive + 1
         ENDIF
      NEXT
   ENDIF
   nSkip = max(0, nAlive - maxTrk)
   nNew = 0
   IF nOld > 0 THEN
      FOR i = 0 TO nOld - 1 DO
         IF $zK[bPrev + i] >= 0 THEN
            IF nSkip > 0 THEN
               nSkip = nSkip - 1
            ELSE
               $zT[bNow + nNew] = $zT[bPrev + i]
               $zB[bNow + nNew] = $zB[bPrev + i]
               $zL[bNow + nNew] = $zL[bPrev + i]
               $zX[bNow + nNew] = $zX[bPrev + i]
               $zK[bNow + nNew] = $zK[bPrev + i]
               nNew = nNew + 1
            ENDIF
         ENDIF
      NEXT
   ENDIF
   IF p = 0 THEN
      n0 = nNew
   ELSE
      n1 = nNew
   ENDIF
NEXT

// ===================== NEW ZONES =====================
// registered one bar after the pattern: top/bottom from bars 1 and 3 back
IF upFvg[1] = 1 THEN
   k = pb * stride + n0
   $zT[k] = low[1]
   $zB[k] = high[3]
   $zL[k] = barindex - 3
   $zX[k] = 0
   $zK[k] = 0
   n0 = n0 + 1
ENDIF
IF dnFvg[1] = 1 THEN
   k = (2 + pb) * stride + n1
   $zT[k] = low[3]
   $zB[k] = high[1]
   $zL[k] = barindex - 3
   $zX[k] = 0
   $zK[k] = 0
   n1 = n1 + 1
ENDIF

// ===================== BREAK AND INVALIDATION =====================
// A bullish FVG broken downwards becomes a bearish breaker, which is
// removed when price goes back above it. Mirror logic for bearish FVGs.
bodyLow = min(close, open)
bodyHigh = max(close, open)
FOR p = 0 TO 1 DO
   IF p = 0 THEN
      nP = n0
   ELSE
      nP = n1
   ENDIF
   bNow = (2 * p + pb) * stride
   IF nP > 0 THEN
      FOR i = 0 TO nP - 1 DO
         k = bNow + i
         zT = $zT[k]
         zB = $zB[k]
         zM = (zT + zB) / 2
         IF mitigationMethod = 0 THEN
            hitDown = zB > bodyLow
            hitUp = bodyHigh > zT
         ELSIF mitigationMethod = 1 THEN
            hitDown = zB > low
            hitUp = high > zT
         ELSE
            hitDown = zM > low
            hitUp = high > zM
         ENDIF
         IF p = 0 THEN
            zBreak = hitDown
            zKill = hitUp
         ELSE
            zBreak = hitUp
            zKill = hitDown
         ENDIF
         IF $zK[k] = 0 THEN
            IF zBreak = 1 THEN
               $zK[k] = 1
               $zX[k] = barindex
            ENDIF
         ELSE
            IF zKill = 1 THEN
               $zK[k] = -1
            ENDIF
         ENDIF
      NEXT
   ENDIF
NEXT

// ===================== OVERLAP FILTER =====================
// step 0: bullish zones overlapping the newest bullish zone are removed
// step 1: bearish zones overlapping the newest bearish zone are removed
// step 2: bullish zones overlapping the newest bearish zone are removed
// step 3: bearish zones overlapping the newest remaining bullish zone are removed
IF hideOverlap = 1 THEN
   FOR stp = 0 TO 3 DO
      p = stp MOD 2
      IF 2 > stp THEN
         q = p
      ELSE
         q = 1 - p
      ENDIF
      IF p = 0 THEN
         nP = n0
      ELSE
         nP = n1
      ENDIF
      IF q = 0 THEN
         nQ = n0
      ELSE
         nQ = n1
      ENDIF
      bP = (2 * p + pb) * stride
      bQ = (2 * q + pb) * stride
      // newest live zone of the reference pool
      kc = -1
      IF nQ > 0 THEN
         FOR i = nQ - 1 DOWNTO 0 DO
            IF 0 > kc THEN
               IF $zK[bQ + i] >= 0 THEN
                  kc = bQ + i
               ENDIF
            ENDIF
         NEXT
      ENDIF
      IF kc >= 0 AND nP > 0 THEN
         cT = $zT[kc]
         cB = $zB[kc]
         FOR i = 0 TO nP - 1 DO
            k = bP + i
            IF NOT (k = kc) THEN
               IF $zK[k] >= 0 THEN
                  sT = $zT[k]
                  sB = $zB[k]
                  ov = (sB > cB AND cT > sB) OR (cT > sT AND sB > cB) OR (sT > cT AND cB > sB) OR (cT > sT AND sT > cB)
                  IF ov = 1 THEN
                     $zK[k] = -1
                  ENDIF
               ENDIF
            ENDIF
         NEXT
      ENDIF
   NEXT
ENDIF

// ===================== DRAWING ON THE LAST BAR =====================
IF islastbarupdate THEN
   IF extendFVG = 1 THEN
      xEnd = barindex + extendBars
   ELSE
      xEnd = barindex
   ENDIF
   lblOff = 0.5 * atr14
   nShow = min(nLast, maxTrk)
   FOR p = 0 TO 1 DO
      IF p = 0 THEN
         // bullish FVGs: their breakers are bearish
         nP = n0
         fR = 8
         fG = 153
         fB = 129
         kR = 231
         kG = 130
         kB = 130
         kA = 51
         txR = 190
         txG = 60
         txB = 60
      ELSE
         // bearish FVGs: their breakers are bullish
         nP = n1
         fR = 242
         fG = 54
         fB = 69
         kR = 0
         kG = 207
         kB = 255
         kA = 89
         txR = 0
         txG = 130
         txB = 170
      ENDIF
      bP = (2 * p + pb) * stride
      nDone = 0
      IF nP > 0 THEN
         FOR i = nP - 1 DOWNTO 0 DO
            k = bP + i
            IF nShow > nDone THEN
               IF $zK[k] >= 0 THEN
                  nDone = nDone + 1
                  zT = $zT[k]
                  zB = $zB[k]
                  zL = $zL[k]
                  IF $zK[k] = 1 THEN
                     IF showBreakers = 1 THEN
                        zX = $zX[k]
                        zM = (zT + zB) / 2
                        // original FVG up to the break, then the breaker
                        DRAWRECTANGLE(zL, zT, zX, zB) COLOURED(fR, fG, fB, 0) FILLCOLOR(fR, fG, fB, 51)
                        DRAWRECTANGLE(zX, zT, xEnd, zB) COLOURED(kR, kG, kB, 255) FILLCOLOR(kR, kG, kB, kA)
                        IF showMidline = 1 THEN
                           DRAWSEGMENT(zL, zM, zX, zM) COLOURED(fR, fG, fB, 255)
                           DRAWSEGMENT(zX, zM, xEnd, zM) COLOURED(kR, kG, kB, 255) STYLE(dottedline2, 1)
                        ENDIF
                        IF showLabels = 1 THEN
                           IF p = 0 THEN
                              DRAWTEXT("BEAR BRK FVG", zX, zT + lblOff, SansSerif, Bold, 10) COLOURED(txR, txG, txB, 255)
                           ELSE
                              DRAWTEXT("BULL BRK FVG", zX, zB - lblOff, SansSerif, Bold, 10) COLOURED(txR, txG, txB, 255)
                           ENDIF
                        ENDIF
                     ENDIF
                  ELSE
                     IF showRegularFVG = 1 THEN
                        DRAWRECTANGLE(zL, zT, xEnd, zB) COLOURED(fR, fG, fB, 0) FILLCOLOR(fR, fG, fB, 51)
                     ENDIF
                  ENDIF
               ENDIF
            ENDIF
         NEXT
      ENDIF
   NEXT
ENDIF

RETURN
Conclusion
FVG Breaker Zones keeps the fair value gap idea and adds what happens after the gap fails: the broken zone becomes a level of its own and stays on the chart until price invalidates it as well. With the overlap filter on, the chart shows the few zones that are still active instead of a stack of old rectangles.