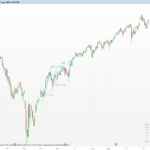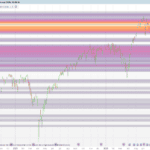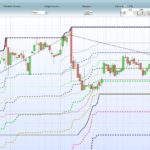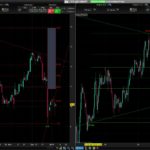






Drop-Retracement ZigZag
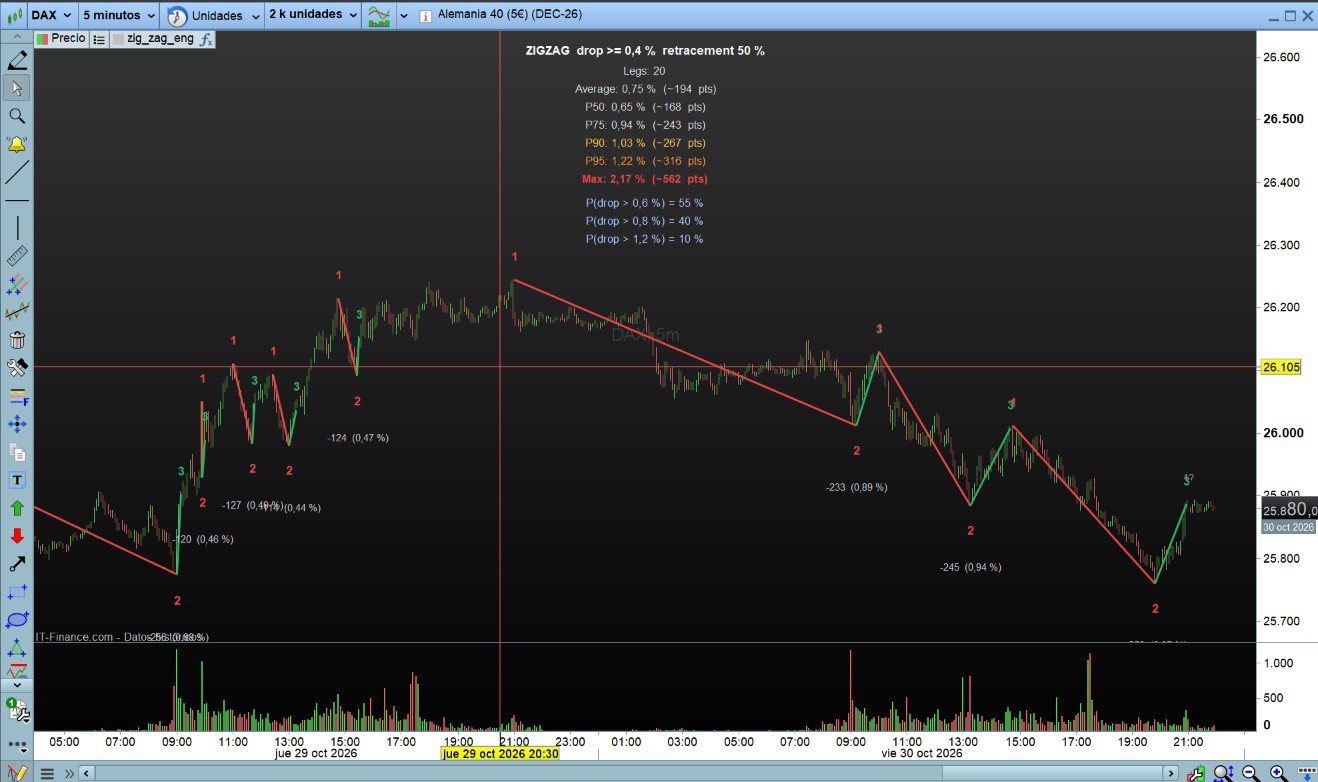
An indicator that finds bearish legs of a minimum size and the retracement that follows them. It also measures, on all loaded history, how deep those legs went before bouncing.
The goal is to support a scaling-in (averaging down) strategy during a decline:
- The first long entry is taken once price has dropped a minimum % from a swing high, without significant corrections.
- The target is a bounce back to at least 50 % of that drop.
- If price keeps falling, the depth statistics of past legs help decide where to add further entries and where historically almost no leg went.
The idea behind it: markets move in trend–correction swings. In the vast majority of cases, a bearish leg is followed by a bounce that retraces at least 50 % of it, often more. This holds on indices, forex, commodities and stocks alike, which is why the leg size is defined as a percentage instead of points.
How it works
PointDefinition1Swing High where the bearish leg starts.2Lowest Low of the leg, once the drop from P1 is ≥ dropPct %.3Bar whose High reaches P2 + (P1 − P2) × retracePct / 100.
Rules
- Searching P1. Starting from the last point 3 (or the first bar), the indicator tracks the highest High and the lowest Low since that High.
- If a new High exceeds the current P1 before the drop reaches
dropPct, the old P1 is invalidated and the new High becomes P1. - Intermediate bounces that do not exceed P1 do not invalidate the leg. Example: drop 70, bounce 50, then drop to −120 from P1 → valid leg of 120.
- Leg validated. When
P1 − lowest Low ≥ P1 × dropPct / 100, the bearish leg is confirmed. - Provisional P2. P2 follows every new Low, and the P3 target is recalculated each time. P2 only becomes final when P3 is hit.
- P3. When the High touches the target, on a bar after the P2 bar, the zigzag 1-2-3 is complete. It is stored, and a new P1 search starts from that bar.
What is displayed
- Completed zigzags:
- labels 1, 2 and 3;
- a red segment 1→2 and a green segment 2→3;
- leg depth under each point 2, in points and %.
- Current leg (orange, dotted):
- P1, provisional P2 (
2?) and the current depth; - a dotted green line at the P3 target.
- Candidate P1 (
1?, grey) while no leg has been validated yet. - Statistics table (top center), computed on all completed legs in the loaded history:
- number of legs;
- average, median (P50), P75, P90, P95 and maximum depth, in % and in points at the current price;
- historical probability that a valid leg exceeds 1.5×, 2× and 3×
dropPct; - Current leg: the % of historical legs that dropped further than the current one. This is the key figure when deciding whether to add another entry.
Parameters
VariableDefaultDescriptiondropPct0.4Minimum drop (%) from P1 to validate a leg. For the DAX at ~25,000 this is ~100 points.retracePct50% of the 1-2 drop that must be recovered to mark P3.showDepth11 = write the depth under every point 2.showTable11 = show the statistics table.maxDrawings300Maximum number of zigzags drawn (most recent). Statistics always use the full history.tableX0Horizontal table offset in pixels from the chart center (+ right / − left).
To optimize dropPct and retracePct, create them in the indicator’s Variables tab and delete the corresponding lines at the top of the code.
Installation
- Create a new indicator in ProRealTime and paste the code.
- Add it on the price chart (not in a separate panel).
- Load as many bars as possible: more history means more reliable statistics.
- Developed and tested on DAX 1-minute. Because the drop is expressed in %, it works on any instrument and timeframe.
Requirements: ProRealTime v11 or later, because the code uses arrays and ARRAYSORT.
Notes and limitations
- On the bar where P2 is set, P3 cannot be triggered. The intrabar order of High and Low is unknown on a single bar.
- Only completed legs (1-2-3) enter the statistics. The current leg is shown separately.
[!WARNING] Risk disclaimer. The 50 % bounce is a strong historical tendency, not a guarantee.
- By construction, every leg in the statistics did bounce. A leg that never bounces simply never shows up as completed.
- The maximum depth seen in the past is not a limit. Crashes, gaps and news events can and will exceed it.
- Averaging down without a maximum number of entries or a hard stop can lead to unlimited losses.
Use the depth percentiles to size and space your entries and to define a stop beyond the deepest levels. Do not treat them as a promise of a bounce.
This indicator is for educational and research purposes only and is not financial advice.
The Code
// =====================================================================
// DROP-RETRACEMENT ZIGZAG  (ProBuilder / ProRealTime v11+)
// ---------------------------------------------------------------------
// Point 1 : swing high (High) where a bearish leg starts
// Point 2 : low (Low) of the bearish leg, once the drop >= dropPct %
// Point 3 : the High reaches retracePct % of the 1-2 drop
// After point 3, a new point 1 is searched from that bar onwards.
// If price exceeds P1 before the drop reaches dropPct, P1 is invalidated
// and the new high becomes P1 (intermediate bounces that do NOT exceed
// P1 do NOT invalidate the leg).
// ---------------------------------------------------------------------
// Apply it ON the price chart. Everything is drawn on the last bar
// from the zigzags stored in arrays.
// =====================================================================
DEFPARAM DRAWONLASTBARONLY = true


// ---------------- PARAMETERS ----------------------------------------
// To optimize them: create these variables in the indicator
// "Variables" tab and delete (or comment out) these lines.
dropPct       = 0.4    // minimum drop in % from P1 to validate the leg
retracePct    = 50     // % of the 1-2 drop to be recovered to mark P3
showDepth     = 1      // 1 = write the depth of each leg
showTable     = 1      // 1 = show statistics table
maxDrawings   = 300    // max number of zigzags drawn (most recent ones)
tableX        = 0      // horizontal table offset in pixels from center (+ right / - left)
// --------------------------------------------------------------------


atrGap = AverageTrueRange[200](close)


ONCE state       = 0      // 0 = searching P1 / 1 = leg validated, searching P3
ONCE p1          = high
ONCE p1x         = barindex
ONCE lowSinceP1  = low
ONCE lowSinceP1x = barindex
ONCE p2          = low
ONCE p2x         = barindex
ONCE n           = 0
p3Level = 0


// ===================== ZIGZAG LOGIC =================================
IF state = 0 THEN
// Search / update P1
IF high > p1 THEN
// P1 exceeded -> previous P1 is invalidated
p1          = high
p1x         = barindex
lowSinceP1  = low
lowSinceP1x = barindex
ELSIF low < lowSinceP1 THEN
lowSinceP1  = low
lowSinceP1x = barindex
ENDIF
// Bearish leg validated
IF p1 - lowSinceP1 >= p1 * dropPct / 100 THEN
state = 1
p2    = lowSinceP1
p2x   = lowSinceP1x
ENDIF
ENDIF


IF state = 1 THEN
// Provisional P2: moves with every new low
IF low < p2 THEN
p2  = low
p2x = barindex
ENDIF
p3Level = p2 + (p1 - p2) * retracePct / 100
// P3: the High touches the P3 level (on a bar after the P2 bar)
IF barindex > p2x AND high >= p3Level THEN
$z1x[n]      = p1x
$z1y[n]      = p1
$z2x[n]      = p2x
$z2y[n]      = p2
$z3x[n]      = barindex
$z3y[n]      = p3Level
$depthPct[n] = (p1 - p2) / p1 * 100
$depthPts[n] = p1 - p2
n = n + 1
// Reset: new P1 from the P3 bar
state       = 0
p1          = high
p1x         = barindex
lowSinceP1  = high
lowSinceP1x = barindex
ENDIF
ENDIF


// ===================== DRAWING (last bar only) ======================
IF ISLASTBARUPDATE THEN
gap = atrGap * 2


// ---------- Completed zigzags ----------
IF n > 0 THEN
startIdx = max(0, n - maxDrawings)
FOR i = startIdx TO n - 1 DO
x1 = $z1x[i]
y1 = $z1y[i]
x2 = $z2x[i]
y2 = $z2y[i]
x3 = $z3x[i]
y3 = $z3y[i]
DRAWSEGMENT(x1, y1, x2, y2) COLOURED(230, 70, 70) STYLE(line, 2)
DRAWSEGMENT(x2, y2, x3, y3) COLOURED(40, 180, 100) STYLE(line, 2)
DRAWTEXT("1", x1, y1 + gap, SansSerif, Bold, 12) COLOURED(230, 70, 70)
DRAWTEXT("2", x2, y2 - gap, SansSerif, Bold, 12) COLOURED(230, 70, 70)
DRAWTEXT("3", x3, y3 + gap, SansSerif, Bold, 12) COLOURED(40, 180, 100)
IF showDepth THEN
tPct = round($depthPct[i] * 100) / 100
tPts = round($depthPts[i])
DRAWTEXT("-#tPts# (#tPct#%)", x2, y2 - 2.5 * gap, SansSerif, Standard, 10) COLOURED(200, 200, 200)
ENDIF
NEXT
ENDIF


// ---------- Current leg ----------
IF state = 1 THEN
DRAWSEGMENT(p1x, p1, p2x, p2) COLOURED(255, 150, 50) STYLE(dottedline, 2)
DRAWSEGMENT(p2x, p3Level, barindex, p3Level) COLOURED(40, 180, 100) STYLE(dottedline, 1)
DRAWTEXT("1", p1x, p1 + gap, SansSerif, Bold, 12) COLOURED(255, 150, 50)
DRAWTEXT("2?", p2x, p2 - gap, SansSerif, Bold, 12) COLOURED(255, 150, 50)
curPct    = round((p1 - p2) / p1 * 10000) / 100
curPts    = round(p1 - p2)
p3LevelR  = round(p3Level * 10) / 10
DRAWTEXT("Current: -#curPts# (#curPct#%)  P3 level: #p3LevelR#", p2x, p2 - 2.5 * gap, SansSerif, Bold, 10) COLOURED(255, 150, 50)
ELSE
DRAWTEXT("1?", p1x, p1 + gap, SansSerif, Standard, 10) COLOURED(150, 150, 150)
ENDIF


// ---------- Statistics table ----------
IF showTable AND n > 0 THEN
sumDepth = 0
FOR i = 0 TO n - 1 DO
$sorted[i] = $depthPct[i]
sumDepth = sumDepth + $depthPct[i]
NEXT
ARRAYSORT($sorted, ASCEND)


avgD = round(sumDepth / n * 100) / 100
maxD = round($sorted[n - 1] * 100) / 100
p50  = round($sorted[round(0.50 * (n - 1))] * 100) / 100
p75  = round($sorted[round(0.75 * (n - 1))] * 100) / 100
p90  = round($sorted[round(0.90 * (n - 1))] * 100) / 100
p95  = round($sorted[round(0.95 * (n - 1))] * 100) / 100


// equivalent in points at current price
ptAvg = round(avgD * close / 100)
ptMax = round(maxD * close / 100)
pt50  = round(p50  * close / 100)
pt75  = round(p75  * close / 100)
pt90  = round(p90  * close / 100)
pt95  = round(p95  * close / 100)


// Historical probability of a valid leg exceeding k times dropPct
c15 = 0
c2  = 0
c3  = 0
FOR i = 0 TO n - 1 DO
IF $depthPct[i] > 1.5 * dropPct THEN
c15 = c15 + 1
ENDIF
IF $depthPct[i] > 2 * dropPct THEN
c2 = c2 + 1
ENDIF
IF $depthPct[i] > 3 * dropPct THEN
c3 = c3 + 1
ENDIF
NEXT
pr15 = round(c15 / n * 1000) / 10
pr2  = round(c2  / n * 1000) / 10
pr3  = round(c3  / n * 1000) / 10
k15  = round(1.5 * dropPct * 100) / 100
k2   = round(2   * dropPct * 100) / 100
k3   = round(3   * dropPct * 100) / 100


DRAWTEXT("ZIGZAG  drop >= #dropPct#%  retracement #retracePct#%", tableX, -20, SansSerif, Bold, 12) ANCHOR(TOP, XSHIFT, YSHIFT) COLOURED(255, 255, 255)
DRAWTEXT("Legs: #n#", tableX, -40, SansSerif, Standard, 11) ANCHOR(TOP, XSHIFT, YSHIFT) COLOURED(220, 220, 220)
DRAWTEXT("Average: #avgD#%  (~#ptAvg# pts)", tableX, -58, SansSerif, Standard, 11) ANCHOR(TOP, XSHIFT, YSHIFT) COLOURED(220, 220, 220)
DRAWTEXT("P50: #p50#%  (~#pt50# pts)", tableX, -76, SansSerif, Standard, 11) ANCHOR(TOP, XSHIFT, YSHIFT) COLOURED(220, 220, 220)
DRAWTEXT("P75: #p75#%  (~#pt75# pts)", tableX, -94, SansSerif, Standard, 11) ANCHOR(TOP, XSHIFT, YSHIFT) COLOURED(220, 220, 220)
DRAWTEXT("P90: #p90#%  (~#pt90# pts)", tableX, -112, SansSerif, Standard, 11) ANCHOR(TOP, XSHIFT, YSHIFT) COLOURED(255, 200, 80)
DRAWTEXT("P95: #p95#%  (~#pt95# pts)", tableX, -130, SansSerif, Standard, 11) ANCHOR(TOP, XSHIFT, YSHIFT) COLOURED(255, 150, 50)
DRAWTEXT("Max: #maxD#%  (~#ptMax# pts)", tableX, -148, SansSerif, Bold, 11) ANCHOR(TOP, XSHIFT, YSHIFT) COLOURED(230, 70, 70)
DRAWTEXT("P(drop > #k15#%) = #pr15#%", tableX, -172, SansSerif, Standard, 11) ANCHOR(TOP, XSHIFT, YSHIFT) COLOURED(180, 200, 255)
DRAWTEXT("P(drop > #k2#%) = #pr2#%", tableX, -190, SansSerif, Standard, 11) ANCHOR(TOP, XSHIFT, YSHIFT) COLOURED(180, 200, 255)
DRAWTEXT("P(drop > #k3#%) = #pr3#%", tableX, -208, SansSerif, Standard, 11) ANCHOR(TOP, XSHIFT, YSHIFT) COLOURED(180, 200, 255)


// Current leg: % of historical legs that dropped MORE than the current one
IF state = 1 THEN
curDepth = (p1 - p2) / p1 * 100
cDeeper = 0
FOR i = 0 TO n - 1 DO
IF $depthPct[i] > curDepth THEN
cDeeper = cDeeper + 1
ENDIF
NEXT
pctDeeper = round(cDeeper / n * 1000) / 10
DRAWTEXT("Current leg: #pctDeeper#% of historical legs dropped further", tableX, -232, SansSerif, Bold, 11) ANCHOR(TOP, XSHIFT, YSHIFT) COLOURED(255, 150, 50)
ENDIF
ENDIF
ENDIF


RETURN