Rising & Falling Wedge Detector
Introduction
A wedge is one of those patterns everybody recognises on a printed chart and almost nobody can define. Two lines that get closer. Fine — but how much closer? Over how many bars? Starting where? Ask three traders to draw the same wedge and you get three different wedges, three different breakout levels and three different targets.
The Rising & Falling Wedge Detector by HexaTrades answers those questions with numbers. It anchors both boundaries to confirmed swing points, then puts the resulting shape through six geometric tests before it is allowed to call itself a wedge. Only after the shape survives all six does it start watching for the break, and only then does it print a level.
The interesting part is not that it draws wedges. It is that every wedge it draws is falsifiable: you can read the exact reason a given shape was accepted or thrown away.
What the Two Wedges Mean
A rising wedge has highs and lows that are both climbing, but the lows climb faster than the highs. Price is still making progress upward while the room it has to move in keeps shrinking — buyers are working harder for less. It is a bearish structure, and it is confirmed when price closes below the lower boundary.
A falling wedge is the mirror image. Highs and lows are both dropping, but the highs drop faster. Selling pressure is fading even though price is still going down. It is a bullish structure, confirmed when price closes above the upper boundary.
Note what this implies: in both cases the confirmation comes from the boundary that is moving slower. The fast line is the one doing the squeezing; the slow line is the one that gives way.
Building the Two Boundaries
Everything starts with swing points. The indicator confirms a swing high when a bar’s high is strictly above the pivotLen bars on each side of it:
IF high[pivotLen] > highest[pivotLen](high) AND high[pivotLen] > highest[pivotLen](high)[pivotLen+1] THEN
   phOldV = phNewV
   phOldX = phNewX
   phNewV = high[pivotLen]
   phNewX = barindex - pivotLen
   nPh = nPh + 1
ENDIF
highest[pivotLen](high) includes the current bar, so it covers the pivotLen bars after the candidate; shifted by [pivotLen+1] the same expression covers the pivotLen bars before it. Two comparisons, both sides checked, and the swing is confirmed pivotLen bars after it printed. That delay is the price of certainty: the pivot never moves once it is set, so the wedge built on it never redraws itself.
Only the last two swing highs and the last two swing lows are kept. From each pair you get a slope, and from the slope a straight line you can evaluate at any bar:
upSlope = (phNewV - phOldV) / max(phNewX - phOldX, 1)
dnSlope = (plNewV - plOldV) / max(plNewX - plOldX, 1)

curUpper = phOldV + upSlope * (barindex - phOldX)
curLower = plOldV + dnSlope * (barindex - plOldX)
Keeping only two pivots per side is a deliberate limitation and worth stating plainly: the detector uses the most recent pair, not the best pair. A wedge whose upper boundary would be better described by the third and first swing highs, skipping the second, will not be found. That is why it prints fewer wedges than your eye does — and why the ones it prints are reproducible.
The Six Geometry Gates
Before a shape counts as a wedge it has to clear all six of these. Each one kills a specific kind of false positive.
1. Minimum height. The widest part of the figure, measured at its left edge, must be at least minSizeATR times ATR(14). This throws away flat little shapes that technically converge but have no room inside them for a tradable move.
2. Not crossed. The width must be positive both at the left edge and at the current bar. If the lines have already crossed, whatever this is, it is not a wedge any more.
3. Net narrowing. The width now must be smaller than the width at the start. Obvious, but it has to be stated: two converging slopes do not guarantee that the visible figure has actually narrowed over the span you are drawing.
4. Minimum contraction. Narrowing is not enough — it must have narrowed by at least minContract of its original width, 10% by default. This separates a genuine wedge from a channel that happens to tilt slightly.
5. Apex ahead. The apex is where the two boundaries would meet. It is found by setting the two line equations equal:
apexX = (plOldV - phOldV - dnSlope * plOldX + upSlope * phOldX) / (upSlope - dnSlope)
If that bar index is already behind us, the figure has run out of room and the pattern is stale. Only wedges whose apex is still in the future are accepted.
6. Duration. The span must be at least pivotLen bars and at most maxBars. The lower bound stops the detector calling three adjacent candles a wedge; the upper bound rejects over-stretched figures where the two “boundaries” are really just noise several hundred bars apart.
The Convergence Test
This is the single condition that separates a wedge from a channel, and it deserves a careful read because the sign of the slopes flips the direction of the comparison:
risingShape  : dnSlope > upSlope * convStrict
fallingShape : upSlope < dnSlope * convStrict
For a rising wedge both slopes are positive, so multiplying by convStrict = 1.05 raises the bar: the lower boundary must climb at least 5% faster than the upper one.
For a falling wedge both slopes are negative, so multiplying by 1.05 makes the number more negative: the upper boundary must fall at least 5% faster than the lower one.
The same constant does the right thing in both cases purely through the arithmetic of signs. Raise convStrict and you demand a more aggressive squeeze — fewer wedges, cleaner ones. Set it to 1.0 and any convergence at all qualifies.
Confirmation
A valid shape is not a signal. The signal is the break, and it must be a fresh one:
brkDown = 0
IF close < curLower AND close[1] >= prevLower THEN
   brkDown = 1
ENDIF
brkUp = 0
IF close > curUpper AND close[1] <= prevUpper THEN
   brkUp = 1
ENDIF
prevUpper and prevLower are the same two boundaries evaluated one bar back. Requiring the previous close to have been on the correct side means the indicator fires on the crossing, once, instead of every bar price spends outside the figure.
Three optional filters sit on top of it:
- EMA trend filter (
useEma, off by default). A falling wedge — the bullish one — is only confirmed with price above the EMA; a rising wedge only with price below it. This is the filter to turn on if you are getting counter-trend signals you do not want. - Volume confirmation (
useVol, off by default). Volume on the breakout bar must exceedvolMulttimes its 20-period average. Useful on stocks and futures, meaningless on instruments with no real volume feed — the indicator detects that case and skips the test rather than blocking every signal. - Breakout candle size (
useBrkSize, on by default). The body of the breakout candle must be at leastbrkSizeATRtimes ATR. This is the cheapest and most effective of the three: it rejects the doji that closes one tick outside the line.
Targets and Stop
When a wedge is confirmed the indicator projects a measured move using the height of the figure at its widest point:
- Rising wedge (bearish): target = lower boundary at the break minus the height; stop = the upper boundary.
- Falling wedge (bullish): target = upper boundary at the break plus the height; stop = the lower boundary.
This is the classical measured-move rule applied mechanically. Both levels are drawn as horizontal dotted lines extending to the right of the last signal, labelled with the price rounded to the instrument’s tick size. Treat them as reference geometry, not as instructions — the indicator makes no claim about how often the target is reached before the stop.
Reading the Chart
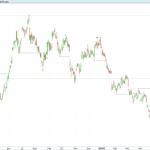
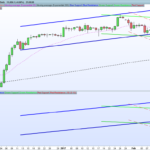
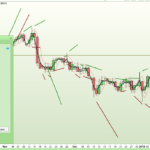
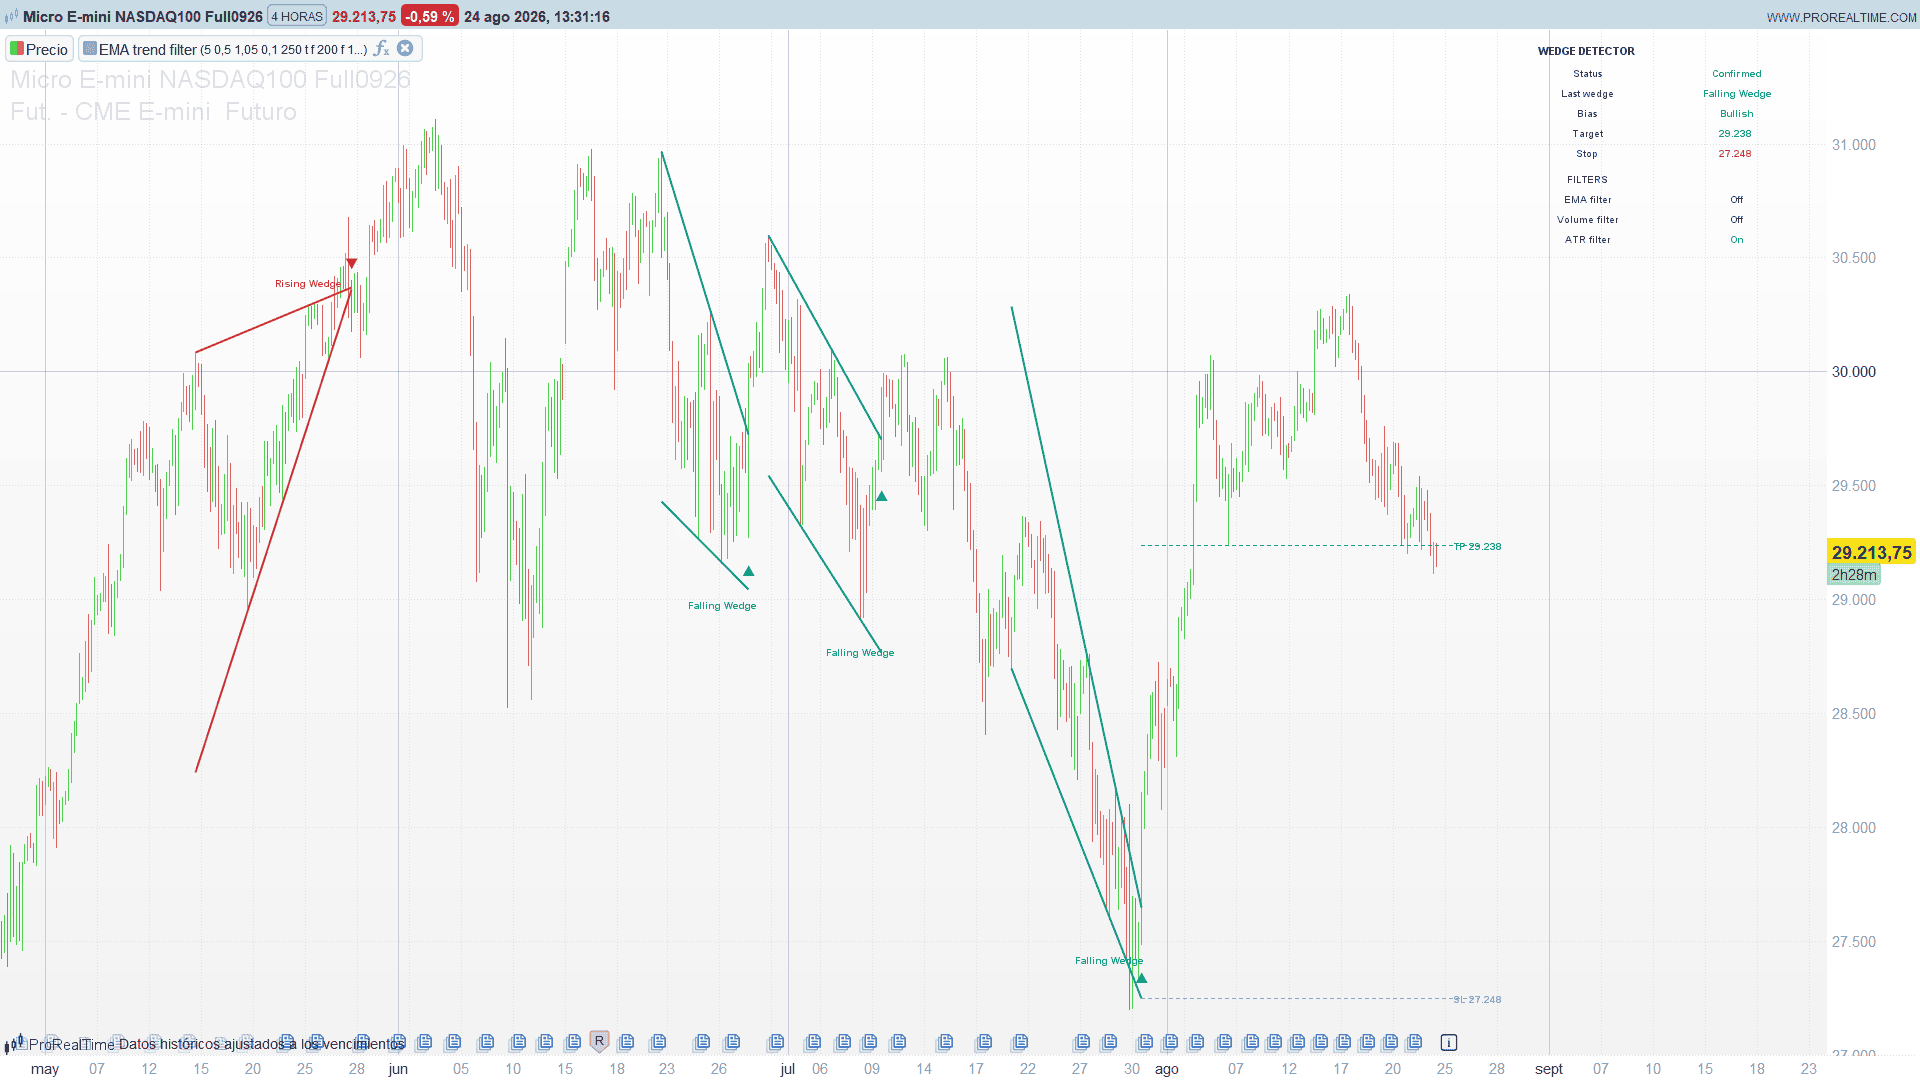
- Two solid lines plus a label and an arrow: a confirmed wedge. The arrow sits on the breakout bar. Red for a rising wedge breaking down, green for a falling wedge breaking up.
- Two grey dotted lines: a wedge in formation. The shape has passed all six gates but has not broken yet. This preview updates every bar and disappears the moment the shape stops qualifying.
- Dotted horizontal lines with TP / SL labels: the target and stop of the most recent confirmed signal only.
- Panel, top right: current status (Forming / Confirmed), the last wedge and its bias, its target and stop, and which of the three filters are switched on.
The last maxWedges confirmed wedges stay on the chart, so you can scroll back and see how the pattern behaved historically on the instrument you are looking at. That is worth doing before trusting it live — wedge reliability varies enormously between instruments and timeframes.
Settings
pivotLen(5) — bars each side required to confirm a swing. Lower values find more, smaller wedges; higher values find fewer, larger ones. This is the main sensitivity dial.minSizeATR(0.5) — minimum height of the figure in ATR units.convStrict(1.05) — how much faster the converging boundary must move. 1.0 accepts any convergence.minContract(0.10) — minimum fraction by which the figure must have narrowed.maxBars(250) — maximum duration of a wedge.showForming(1) — draw the wedge in formation.useEma(0) /emaLen(200) — trend filter and its length.useVol(0) /volMult(1.3) — volume confirmation on the breakout bar.useBrkSize(1) /brkSizeATR(0.2) — minimum body size of the breakout candle.showTarget(1) /showStop(1) — target and stop lines of the latest signal.showDash(1) — status panel.maxWedges(20) — how many confirmed wedges are kept on the chart.extRight(15) — how far the target and stop lines extend to the right. Reduce it if the labels fall outside your chart’s right margin.dashX(-330) /dashY(-20) /dashCol(150) — panel position in pixels from the top right corner, and the gap between its two columns. Adjust these if the panel collides with the price scale on your screen.
The Code
Insert it as an indicator and tick “on price” so it draws over the candles.
//----------------------------------------------------------------------//
//PRC_Rising & Falling Wedge Detector [HexaTrades]
//version = 0
//24.08.26
//Ivan Gonzalez @ www.prorealcode.com
//Sharing ProRealTime knowledge
//----------------------------------------------------------------------//
DEFPARAM drawonlastbaronly = true


//-----Detection--------------------------------------------------------//
pivotLen    = 5       //bars left/right to confirm a swing. Lower = more wedges
minSizeATR  = 0.5     //reject wedges whose widest part is under this many ATR
convStrict  = 1.05    //how much faster the converging line must move (1.0 = any)
minContract = 0.10    //wedge must narrow by at least this fraction of its width
maxBars     = 250     //reject wedges spanning more than this many bars
showForming = 1       //1 = draw the forming wedge (preview)


//-----Filters----------------------------------------------------------//
useEma      = 0       //1 = only confirm breakouts aligned with the EMA
emaLen      = 200     //EMA length
useVol      = 0       //1 = volume confirmation on the breakout candle
volMult     = 1.3     //volume > x average
useBrkSize  = 1       //1 = minimum breakout candle size
brkSizeATR  = 0.2     //breakout candle body >= this many ATR


//-----Visuals----------------------------------------------------------//
showTarget  = 1       //1 = target line of the latest signal
showStop    = 1       //1 = stop line of the latest signal
showDash    = 1       //1 = dashboard
maxWedges   = 20      //confirmed wedges kept on the chart (ring buffer)
extRight    = 15      //bars the target/stop lines extend to the right
dashX       = 0 - 330 //dashboard: label column, pixels from the right edge
dashCol     = 150     //dashboard: gap between the label and value columns
dashY       = 0 - 20  //dashboard: pixels from the top edge
//----------------------------------------------------------------------//


//-----Colours----------------------------------------------------------//
bullR = 8
bullG = 153
bullB = 129
bearR = 242
bearG = 54
bearB = 69
formR = 130
formG = 130
formB = 130
lblR  = 80
lblG  = 80
lblB  = 80


//-----Core measures----------------------------------------------------//
atrV   = averagetruerange[14](close)
volAvg = average[20](volume)
emaVal = average[emaLen,1](close)


tickSz = pointsize
IF tickSz <= 0 THEN
   tickSz = 0.01
ENDIF


//Warm-up guard: no signal until every series used below has a value
minBars = 2 * pivotLen + 21
IF useEma = 1 THEN
   minBars = max(minBars, emaLen + 1)
ENDIF


//----------------------------------------------------------------------//
//1. PIVOTS (confirmed only, pivotLen bars behind = non repainting)
//----------------------------------------------------------------------//
once nPh = 0
once nPl = 0
once phOldV = 0
once phOldX = 0
once phNewV = 0
once phNewX = 0
once plOldV = 0
once plOldX = 0
once plNewV = 0
once plNewX = 0


pivWin = 2 * pivotLen + 1


IF barindex > pivWin THEN
   IF high[pivotLen] > highest[pivotLen](high) AND high[pivotLen] > highest[pivotLen](high)[pivotLen+1] THEN
      phOldV = phNewV
      phOldX = phNewX
      phNewV = high[pivotLen]
      phNewX = barindex - pivotLen
      nPh = nPh + 1
   ENDIF
   IF low[pivotLen] < lowest[pivotLen](low) AND low[pivotLen] < lowest[pivotLen](low)[pivotLen+1] THEN
      plOldV = plNewV
      plOldX = plNewX
      plNewV = low[pivotLen]
      plNewX = barindex - pivotLen
      nPl = nPl + 1
   ENDIF
ENDIF


//----------------------------------------------------------------------//
//2. STATE
//----------------------------------------------------------------------//
once nWedge    = 0    //total confirmed wedges (drives the ring buffer slot)
once lastState = 0    //0 = none, 1 = a wedge has already been confirmed
once sigDir    = 0    //direction of the latest signal: 1 bull, -1 bear
once sigTp     = 0
once sigSl     = 0
once sigBar    = 0


//forming-wedge state, rebuilt from scratch on every bar
formDir = 0
formX1  = 0
formYU1 = 0
formYL1 = 0
formX2  = 0
formYU2 = 0
formYL2 = 0


//----------------------------------------------------------------------//
//3. WEDGE GEOMETRY AND BREAKOUT
//----------------------------------------------------------------------//
IF barindex > minBars AND nPh >= 2 AND nPl >= 2 AND phNewX > phOldX AND plNewX > plOldX THEN


   upSlope = (phNewV - phOldV) / max(phNewX - phOldX, 1)
   dnSlope = (plNewV - plOldV) / max(plNewX - plOldX, 1)


   //both trendlines projected to any bar: y = base + slope * (x - baseBar)
   curUpper  = phOldV + upSlope * (barindex - phOldX)
   curLower  = plOldV + dnSlope * (barindex - plOldX)
   prevUpper = phOldV + upSlope * (barindex - 1 - phOldX)
   prevLower = plOldV + dnSlope * (barindex - 1 - plOldX)


   startBar   = min(phOldX, plOldX)
   spanBars   = barindex - startBar
   upperStart = phOldV + upSlope * (startBar - phOldX)
   lowerStart = plOldV + dnSlope * (startBar - plOldX)


   wedgeH   = upperStart - lowerStart   //widest part, left side
   widthNow = curUpper - curLower       //narrowest part, right side


   sizeOk = 0
   IF wedgeH >= atrV * minSizeATR THEN
      sizeOk = 1
   ENDIF


   //apex must still be ahead: the two lines have not crossed yet
   slopeDiff = upSlope - dnSlope
   apexAhead = 1
   IF slopeDiff <> 0 THEN
      apexX = (plOldV - phOldV - dnSlope * plOldX + upSlope * phOldX) / slopeDiff
      IF apexX <= barindex THEN
         apexAhead = 0
      ENDIF
   ENDIF


   geomOk = 0
   IF wedgeH > 0 AND widthNow > 0 AND widthNow < wedgeH AND apexAhead = 1 THEN
      IF (wedgeH - widthNow) / wedgeH >= minContract AND spanBars >= pivotLen AND spanBars <= maxBars THEN
         geomOk = 1
      ENDIF
   ENDIF


   //-----Shapes--------------------------------------------------------//
   //rising wedge: both lines up, the lower one rising faster
   risingShape = 0
   IF phNewV > phOldV AND plNewV > plOldV AND upSlope > 0 AND dnSlope > 0 THEN
      IF dnSlope > upSlope * convStrict AND sizeOk = 1 AND geomOk = 1 THEN
         risingShape = 1
      ENDIF
   ENDIF


   //falling wedge: both lines down, the upper one falling faster
   fallingShape = 0
   IF phNewV < phOldV AND plNewV < plOldV AND upSlope < 0 AND dnSlope < 0 THEN
      IF upSlope < dnSlope * convStrict AND sizeOk = 1 AND geomOk = 1 THEN
         fallingShape = 1
      ENDIF
   ENDIF


   //-----Breakouts-----------------------------------------------------//
   brkDown = 0
   IF close < curLower AND close[1] >= prevLower THEN
      brkDown = 1
   ENDIF
   brkUp = 0
   IF close > curUpper AND close[1] <= prevUpper THEN
      brkUp = 1
   ENDIF


   //-----Filters-------------------------------------------------------//
   volOk = 1
   IF useVol = 1 AND volAvg > 0 THEN
      volOk = 0
      IF volume > volAvg * volMult THEN
         volOk = 1
      ENDIF
   ENDIF


   brkSizeOk = 1
   IF useBrkSize = 1 THEN
      brkSizeOk = 0
      IF abs(close - open) >= atrV * brkSizeATR THEN
         brkSizeOk = 1
      ENDIF
   ENDIF


   emaOkBull = 1
   emaOkBear = 1
   IF useEma = 1 THEN
      emaOkBull = 0
      IF close > emaVal THEN
         emaOkBull = 1
      ENDIF
      emaOkBear = 0
      IF close < emaVal THEN
         emaOkBear = 1
      ENDIF
   ENDIF


   filtersOk = 0
   IF volOk = 1 AND brkSizeOk = 1 THEN
      filtersOk = 1
   ENDIF


   //-----Confirmed rising wedge (bearish breakdown)---------------------//
   IF risingShape = 1 AND brkDown = 1 AND filtersOk = 1 AND emaOkBear = 1 THEN
      nWedge = nWedge + 1
      wSlot = nWedge - floor((nWedge - 1) / maxWedges) * maxWedges
      $wX1[wSlot]  = startBar
      $wYU1[wSlot] = upperStart
      $wYL1[wSlot] = lowerStart
      $wX2[wSlot]  = barindex
      $wYU2[wSlot] = curUpper
      $wYL2[wSlot] = curLower
      $wLbX[wSlot] = phNewX
      $wLbY[wSlot] = phNewV + atrV * 0.5
      $wArY[wSlot] = high + atrV * 0.4
      $wDir[wSlot] = 0 - 1
      sigTp     = curLower - wedgeH
      sigSl     = curUpper
      sigBar    = barindex
      sigDir    = 0 - 1
      lastState = 1
   ENDIF


   //-----Confirmed falling wedge (bullish breakout)---------------------//
   IF fallingShape = 1 AND brkUp = 1 AND filtersOk = 1 AND emaOkBull = 1 THEN
      nWedge = nWedge + 1
      wSlot = nWedge - floor((nWedge - 1) / maxWedges) * maxWedges
      $wX1[wSlot]  = startBar
      $wYU1[wSlot] = upperStart
      $wYL1[wSlot] = lowerStart
      $wX2[wSlot]  = barindex
      $wYU2[wSlot] = curUpper
      $wYL2[wSlot] = curLower
      $wLbX[wSlot] = plNewX
      $wLbY[wSlot] = plNewV - atrV * 0.5
      $wArY[wSlot] = low - atrV * 0.4
      $wDir[wSlot] = 1
      sigTp     = curUpper + wedgeH
      sigSl     = curLower
      sigBar    = barindex
      sigDir    = 1
      lastState = 1
   ENDIF


   //-----Forming preview (shape complete, not broken yet)---------------//
   IF showForming = 1 THEN
      IF risingShape = 1 AND brkDown = 0 THEN
         formDir = 0 - 1
      ENDIF
      IF fallingShape = 1 AND brkUp = 0 THEN
         formDir = 1
      ENDIF
      IF formDir <> 0 THEN
         formX1  = startBar
         formYU1 = upperStart
         formYL1 = lowerStart
         formX2  = barindex
         formYU2 = curUpper
         formYL2 = curLower
      ENDIF
   ENDIF


ENDIF


//----------------------------------------------------------------------//
//4. DRAWING (full repaint of the state, once per bar)
//----------------------------------------------------------------------//
IF islastbarupdate THEN


   //-----Confirmed wedges kept in the ring buffer-----------------------//
   nShow = min(nWedge, maxWedges)
   IF nShow > 0 THEN
      FOR wIx = 1 TO nShow DO
         IF $wDir[wIx] < 0 THEN
            wR = bearR
            wG = bearG
            wB = bearB
         ELSE
            wR = bullR
            wG = bullG
            wB = bullB
         ENDIF
         DRAWSEGMENT($wX1[wIx], $wYU1[wIx], $wX2[wIx], $wYU2[wIx]) COLOURED(wR, wG, wB, 255) STYLE(line, 2)
         DRAWSEGMENT($wX1[wIx], $wYL1[wIx], $wX2[wIx], $wYL2[wIx]) COLOURED(wR, wG, wB, 255) STYLE(line, 2)
         IF $wDir[wIx] < 0 THEN
            DRAWTEXT("Rising Wedge", $wLbX[wIx], $wLbY[wIx], sansserif, bold, 10) COLOURED(wR, wG, wB, 255)
            DRAWTEXT("▼", $wX2[wIx], $wArY[wIx], sansserif, bold, 14) COLOURED(wR, wG, wB, 255)
         ELSE
            DRAWTEXT("Falling Wedge", $wLbX[wIx], $wLbY[wIx], sansserif, bold, 10) COLOURED(wR, wG, wB, 255)
            DRAWTEXT("▲", $wX2[wIx], $wArY[wIx], sansserif, bold, 14) COLOURED(wR, wG, wB, 255)
         ENDIF
      NEXT
   ENDIF


   //-----Forming wedge preview------------------------------------------//
   IF formDir <> 0 THEN
      DRAWSEGMENT(formX1, formYU1, formX2, formYU2) COLOURED(formR, formG, formB, 255) STYLE(dottedline, 1)
      DRAWSEGMENT(formX1, formYL1, formX2, formYL2) COLOURED(formR, formG, formB, 255) STYLE(dottedline, 1)
   ENDIF


   //-----Target and stop of the latest signal----------------------------//
   IF sigDir <> 0 THEN
      leftX  = max(sigBar, barindex - 480)
      rightX = barindex + extRight
      IF sigDir > 0 THEN
         tpR = bullR
         tpG = bullG
         tpB = bullB
      ELSE
         tpR = bearR
         tpG = bearG
         tpB = bearB
      ENDIF
      IF showTarget = 1 THEN
         tpShow = round(sigTp / tickSz) * tickSz
         DRAWSEGMENT(leftX, sigTp, rightX, sigTp) COLOURED(tpR, tpG, tpB, 255) STYLE(dottedline, 1)
         DRAWTEXT("TP #tpShow#", rightX, sigTp, sansserif, bold, 10) COLOURED(tpR, tpG, tpB, 255)
      ENDIF
      IF showStop = 1 THEN
         slShow = round(sigSl / tickSz) * tickSz
         DRAWSEGMENT(leftX, sigSl, rightX, sigSl) COLOURED(140, 140, 140, 255) STYLE(dottedline, 1)
         DRAWTEXT("SL #slShow#", rightX, sigSl, sansserif, bold, 10) COLOURED(140, 140, 140, 255)
      ENDIF
   ENDIF


   //-----Dashboard-------------------------------------------------------//
   IF showDash = 1 THEN
      DRAWTEXT("WEDGE DETECTOR", dashX, dashY, sansserif, bold, 11) COLOURED(lblR, lblG, lblB, 255) ANCHOR(topright, xshift, yshift)


      DRAWTEXT("Status", dashX, dashY - 22, sansserif, standard, 10) COLOURED(lblR, lblG, lblB, 255) ANCHOR(topright, xshift, yshift)
      IF formDir <> 0 THEN
         DRAWTEXT("Forming", dashX + dashCol, dashY - 22, sansserif, bold, 10) COLOURED(255, 152, 0, 255) ANCHOR(topright, xshift, yshift)
      ELSIF lastState = 1 THEN
         DRAWTEXT("Confirmed", dashX + dashCol, dashY - 22, sansserif, bold, 10) COLOURED(bullR, bullG, bullB, 255) ANCHOR(topright, xshift, yshift)
      ELSE
         DRAWTEXT("-", dashX + dashCol, dashY - 22, sansserif, bold, 10) COLOURED(lblR, lblG, lblB, 255) ANCHOR(topright, xshift, yshift)
      ENDIF


      DRAWTEXT("Last wedge", dashX, dashY - 42, sansserif, standard, 10) COLOURED(lblR, lblG, lblB, 255) ANCHOR(topright, xshift, yshift)
      DRAWTEXT("Bias", dashX, dashY - 62, sansserif, standard, 10) COLOURED(lblR, lblG, lblB, 255) ANCHOR(topright, xshift, yshift)
      IF sigDir > 0 THEN
         DRAWTEXT("Falling Wedge", dashX + dashCol, dashY - 42, sansserif, bold, 10) COLOURED(bullR, bullG, bullB, 255) ANCHOR(topright, xshift, yshift)
         DRAWTEXT("Bullish", dashX + dashCol, dashY - 62, sansserif, bold, 10) COLOURED(bullR, bullG, bullB, 255) ANCHOR(topright, xshift, yshift)
      ELSIF sigDir < 0 THEN
         DRAWTEXT("Rising Wedge", dashX + dashCol, dashY - 42, sansserif, bold, 10) COLOURED(bearR, bearG, bearB, 255) ANCHOR(topright, xshift, yshift)
         DRAWTEXT("Bearish", dashX + dashCol, dashY - 62, sansserif, bold, 10) COLOURED(bearR, bearG, bearB, 255) ANCHOR(topright, xshift, yshift)
      ELSE
         DRAWTEXT("-", dashX + dashCol, dashY - 42, sansserif, bold, 10) COLOURED(lblR, lblG, lblB, 255) ANCHOR(topright, xshift, yshift)
         DRAWTEXT("-", dashX + dashCol, dashY - 62, sansserif, bold, 10) COLOURED(lblR, lblG, lblB, 255) ANCHOR(topright, xshift, yshift)
      ENDIF


      DRAWTEXT("Target", dashX, dashY - 82, sansserif, standard, 10) COLOURED(lblR, lblG, lblB, 255) ANCHOR(topright, xshift, yshift)
      DRAWTEXT("Stop", dashX, dashY - 102, sansserif, standard, 10) COLOURED(lblR, lblG, lblB, 255) ANCHOR(topright, xshift, yshift)
      IF sigDir <> 0 THEN
         tgShow = round(sigTp / tickSz) * tickSz
         spShow = round(sigSl / tickSz) * tickSz
         DRAWTEXT("#tgShow#", dashX + dashCol, dashY - 82, sansserif, bold, 10) COLOURED(bullR, bullG, bullB, 255) ANCHOR(topright, xshift, yshift)
         DRAWTEXT("#spShow#", dashX + dashCol, dashY - 102, sansserif, bold, 10) COLOURED(bearR, bearG, bearB, 255) ANCHOR(topright, xshift, yshift)
      ELSE
         DRAWTEXT("-", dashX + dashCol, dashY - 82, sansserif, bold, 10) COLOURED(lblR, lblG, lblB, 255) ANCHOR(topright, xshift, yshift)
         DRAWTEXT("-", dashX + dashCol, dashY - 102, sansserif, bold, 10) COLOURED(lblR, lblG, lblB, 255) ANCHOR(topright, xshift, yshift)
      ENDIF


      DRAWTEXT("FILTERS", dashX, dashY - 128, sansserif, bold, 10) COLOURED(lblR, lblG, lblB, 255) ANCHOR(topright, xshift, yshift)


      DRAWTEXT("EMA filter", dashX, dashY - 148, sansserif, standard, 10) COLOURED(lblR, lblG, lblB, 255) ANCHOR(topright, xshift, yshift)
      IF useEma = 1 THEN
         DRAWTEXT("On", dashX + dashCol, dashY - 148, sansserif, bold, 10) COLOURED(bullR, bullG, bullB, 255) ANCHOR(topright, xshift, yshift)
      ELSE
         DRAWTEXT("Off", dashX + dashCol, dashY - 148, sansserif, bold, 10) COLOURED(lblR, lblG, lblB, 255) ANCHOR(topright, xshift, yshift)
      ENDIF


      DRAWTEXT("Volume filter", dashX, dashY - 168, sansserif, standard, 10) COLOURED(lblR, lblG, lblB, 255) ANCHOR(topright, xshift, yshift)
      IF useVol = 1 THEN
         DRAWTEXT("On", dashX + dashCol, dashY - 168, sansserif, bold, 10) COLOURED(bullR, bullG, bullB, 255) ANCHOR(topright, xshift, yshift)
      ELSE
         DRAWTEXT("Off", dashX + dashCol, dashY - 168, sansserif, bold, 10) COLOURED(lblR, lblG, lblB, 255) ANCHOR(topright, xshift, yshift)
      ENDIF


      DRAWTEXT("ATR filter", dashX, dashY - 188, sansserif, standard, 10) COLOURED(lblR, lblG, lblB, 255) ANCHOR(topright, xshift, yshift)
      IF useBrkSize = 1 THEN
         DRAWTEXT("On", dashX + dashCol, dashY - 188, sansserif, bold, 10) COLOURED(bullR, bullG, bullB, 255) ANCHOR(topright, xshift, yshift)
      ELSE
         DRAWTEXT("Off", dashX + dashCol, dashY - 188, sansserif, bold, 10) COLOURED(lblR, lblG, lblB, 255) ANCHOR(topright, xshift, yshift)
      ENDIF
   ENDIF


ENDIF


//----------------------------------------------------------------------//
//5. EMA TREND FILTER REFERENCE LINE (plotted only when the filter is on)
//----------------------------------------------------------------------//
IF useEma = 1 THEN
   emaPlot = emaVal
ELSE
   emaPlot = undefined
ENDIF


RETURN emaPlot AS "EMA trend filter" COLOURED(255, 152, 0) STYLE(line, 1)