



 ProRealCode - Trading & Coding with ProRealTime™



Auto Range Detector
Introduction
Every range detector has the same problem, and it is not the one people think it is.
The obvious problem is choosing a length. Set it to 20 and you find every three-day pause inside a trend. Set it to 100 and you miss everything except the multi-week consolidations. The usual answer is to run two of them.
The real problem is subtler: width alone does not tell you it was a range. A V-shaped reversal spans exactly the same distance as a rectangle of the same height. It has a high, it has a low, and a naive detector will happily draw a box around it. So will a detector that only checks whether price stayed inside a band, because a V does stay inside its own band — it just never traded there twice.
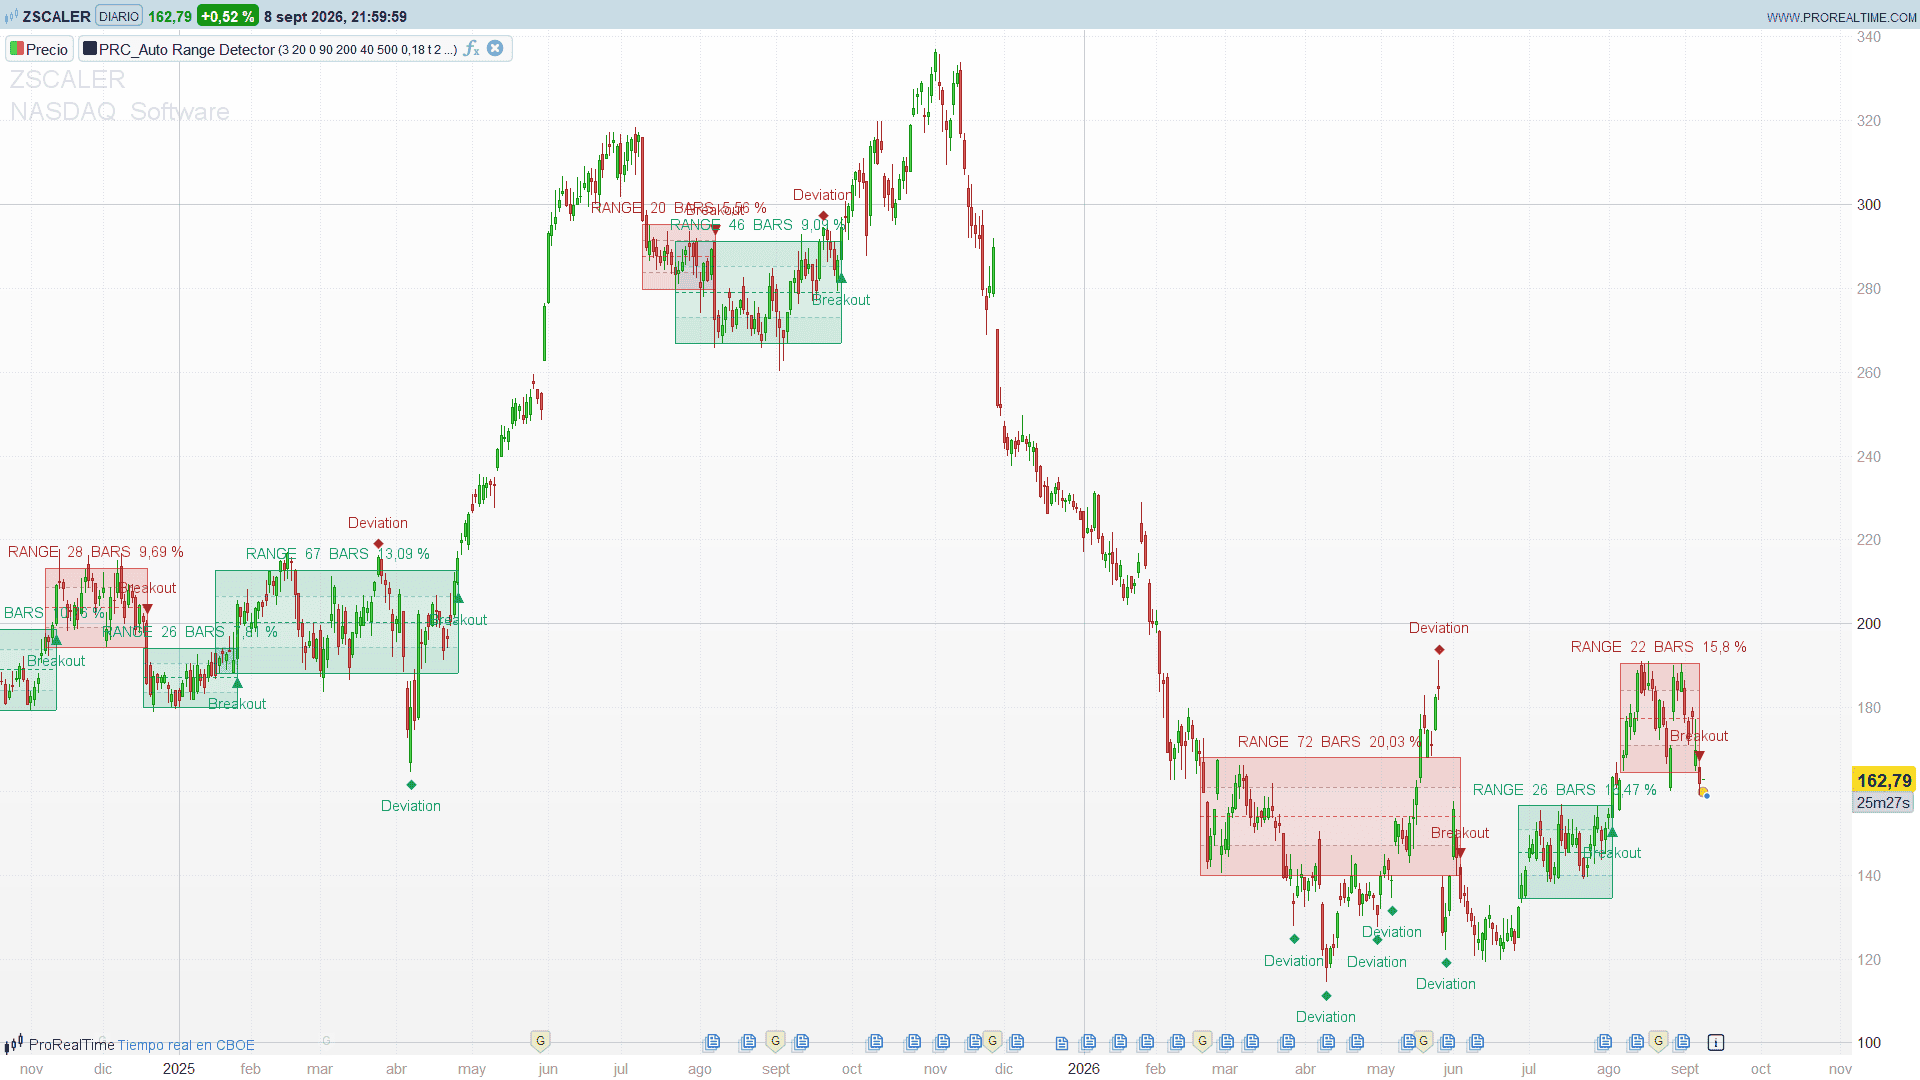
Auto Range Detector attacks both problems. It scans three nested windows on every closed bar and lets the longest qualifying one define the structure, and it applies six filters that a rectangle passes and a reversal does not. Then it does something most detectors do not do at all: when the box breaks and price comes straight back inside, the box comes back to life and the failed break is marked as a level that was swept.
Theory Behind the Indicator
1. Three windows, and the longest one wins
On every closed bar the detector tests a base window, twice the base, and three times the base — 20, 40 and 60 bars by default. Each is evaluated independently against the full filter set, and the longest one that passes defines the range.
That ordering matters. If both the 20 and the 60 qualify, taking the 60 means the box covers the whole consolidation rather than the last third of it. Short coils and long consolidations are covered by one configuration instead of two instances of the indicator.
2. Six filters, and why width alone is not enough
A window is accepted only if it clears all six at once.
Compression. Band height divided by ATR and by the square root of the window length. The square root is what makes the three scales comparable: random walk range grows roughly with the square root of time, so dividing by it removes the length from the measurement. That raw number is then ranked against its own history on the current symbol and interval — the last 500 bars by default. At a setting of 40, a window qualifies when it is tighter than 60 % of what that market normally produces. This is the piece that makes one setting mean the same thing on a currency pair and on a small cap.
Rotation. How many times the closes crossed the midline of the window, per bar. This is the filter that kills the V. A V-shaped move crosses its own midline about twice: once on the way down, once on the way back. Price rotating between two boundaries crosses it constantly. The default of 0.18 asks for roughly one crossing every five and a half bars, with a hard floor of three crossings so a short window cannot qualify on two.
Boundary touches. How many bars actually reached each edge, within a tolerance expressed in ATR. At the default of 2, a single spike high paired with a single spike low no longer forms a range — the edges have to have been visited.
Drift. The regression slope across the window, expressed as a fraction of band height. At 0 the structure is perfectly flat. At 1 the trend line travelled the entire height of the box. The default of 0.45 accepts a gently tilted range and rejects a channel.
Containment. The share of closes that sat between the two boundaries. Rotation establishes that price turned repeatedly; containment establishes that it did so inside the band rather than passing through it. The two together are what a rectangle has and a reversal does not.
History. The window has to be full.
3. Where the boundaries sit
Three options, and the default is the interesting one.
Percentile band places the upper boundary at a high percentile of the highs and the lower one at the mirrored percentile of the lows — the 90th and the 10th by default. The value is interpolated between the two nearest bars, so a boundary can rest slightly away from any single wick. The effect is that an isolated spike does not get to define the box: the edge sits where the market actually traded, and you get more boundary touches registered against a tighter, more honest box. At 100 it collapses onto the absolute extremes.
Absolute extremes puts the edges on the highest high and lowest low. Body extremes uses opens and closes only, which suits instruments with erratic wicks — thin crypto pairs, illiquid session opens.
4. Anchoring the left edge
The box is not drawn across the window that was scanned. Once a structure qualifies, the left edge walks backwards while earlier bars stay inside the band, wick and all, tolerating as much excursion as the containment setting permits before it stops.
The detail that makes this work: the edge only lands on a bar that was held entirely inside the boundaries. So the box begins on a candle that belonged to the structure, not on the candle that arrived into it. That is the difference between a box that starts at the consolidation and a box that starts wherever your scan window happened to end.
5. Absorbing overshoot
A wick that poked marginally outside the boundary does not end the range. Instead the boundary stretches to take it in, up to a limit in ATR. Beyond that distance the move registers as genuine expansion and the range ends.
Without this, a rigid box closes on a two-tick overshoot and immediately reopens a few ticks wider — you get two structures where the market only made one. It applies under close-beyond confirmation only, since wick-beyond treats any trade through the boundary as a break by definition.
6. Failed breaks: deviations
This is the part that separates it from every other box drawer.
When a confirmed range breaks, it is not deleted. It goes dormant for a number of bars. If price closes back between the boundaries during that window, the range revives: the box resumes from its original left edge, the breakout marker is withdrawn, and the extreme of the excursion is marked with a deviation tag.
What you are left with is one structure with a failed break inside it, and a marker sitting on the exact level that was swept. That level is the useful output. It is where stops were taken and where the market demonstrated it was not ready to leave.
If price does not come back within the deviation window, the break stands and the box retires with its breakout marker in place.
How to Read It
A box with a faint dashed-looking border and no shading is provisional — the structure has been detected but has not held long enough to be confirmed. A break at that stage clears it silently, with no marker. Only structures that held stay on the chart.
A box with a solid border and a fade toward its middle is live and confirmed. The tag on top gives you the state, the number of candles the structure contains, and its height as a percentage of price. That last figure is the one to watch across instruments: a 0.4 % box on an index and a 4 % box on a small cap are not the same trade.
The equilibrium line is not decoration. It is the exact line the rotation filter counted crossings against, so it tells you where the structure’s own centre of gravity is. The quartiles mark where a rotation is already extended relative to the structure — price at the 75 % level inside a range has already made most of the move to the top.
Three configurations worth recognising:
A box that keeps growing to the right with price rotating inside it. The structure is doing what it says. The boundaries are your levels and the equilibrium is your mean.
A breakout marker on a box that just retired. The range resolved. Note the box still extends over the bar that broke it so the marker sits on that candle, but the bar itself is not counted in the tag — the figure on the retired box matches the last reading it showed while live.
A deviation marker. A break failed and the range came back. The marker sits on the high or low of the excursion, not on the bar price returned on. That is the level that was swept, and it is usually the better level of the two.
The Code
//---------------------------------------------------------------------------//
//PRC_Auto Range Detector
//version = 1
//09.09.2026
//Ivan Gonzalez @ www.prorealcode.com
//Original author: Zeiierman
//Sharing ProRealTime knowledge
//---------------------------------------------------------------------------//
//Multi-scale consolidation detector. Three nested windows are tested on every
//closed bar; the longest one that passes every structure filter defines the
//range. Boxes are provisional until they have held long enough, they absorb
//marginal overshoots, and a failed break that returns inside the band revives
//the range and is tagged as a deviation.
//---------------------------------------------------------------------------//
DEFPARAM drawonlastbaronly = true
//-----Detection-------------------------------------------------------------//
scanScaling = 3 //Scan Scaling: 1 = Base only, 2 = Base + 2x, 3 = Base + 2x + 3x
baseLength = 20 //Base Scan Length
boundaryBasis = 0 //Boundary Basis: 0 = Percentile band, 1 = Absolute extremes, 2 = Body extremes
bandPct = 90 //Boundary Percentile (70..100)
atrLen = 200 //ATR Length
//-----Structure filters-----------------------------------------------------//
compPct = 40 //Compression Percentile
calibLen = 500 //Calibration Lookback
minRotation = 0.18 //Min Rotation Rate
touchWick = 1 //Touch Definition: 1 = Wick reaches, 0 = Close reaches
minTouches = 2 //Min Boundary Touches
touchTol = 0.10 //Touch Tolerance (ATR)
maxDrift = 0.45 //Max Drift
minContain = 0.70 //Min Containment
//-----Range behavior--------------------------------------------------------//
anchorExtend = 1 //Range Anchoring: 1 = Extend to containment, 0 = Scan window only
anchorLB = 300 //Anchor Lookback
minRangeBars = 10 //Minimum Range Bars
absorbOver = 1 //Absorb Overshoot
overTol = 0.25 //Overshoot Tolerance (ATR)
wickBreak = 0 //Break Confirmation: 0 = Close beyond, 1 = Wick beyond
breakBuf = 0.15 //Breakout Buffer (ATR)
mergeDev = 1 //Merge Deviations
devWindow = 10 //Deviation Window
cooldownBars = 3 //Cooldown Bars
maxRangeAge = 0 //Max Range Age (0 = no limit)
//-----Visual settings-------------------------------------------------------//
maxRanges = 15 //Retired ranges kept on the chart
maxDevs = 20 //Deviation markers kept on the chart
gradSteps = 4 //Gradient Steps
fillTrans = 80 //Fill Transparency (0..100, higher = lighter)
showEq = 1 //Show Equilibrium Line
showQuart = 1 //Show Quartile Levels
showLabel = 1 //Show Range Labels
showBreak = 1 //Show Breakout Markers
showDev = 1 //Show Deviation Markers
bullR = 0 //Bullish colour
bullG = 150
bullB = 90
bearR = 210 //Bearish colour
bearG = 45
bearB = 45
rngR = 105 //Live range colour
rngG = 105
rngB = 105
//---------------------------------------------------------------------------//
// DERIVED CONSTANTS //
//---------------------------------------------------------------------------//
lenA = baseLength
lenB = baseLength * 2
lenC = baseLength * 3
useB = 0
IF scanScaling >= 2 THEN
useB = 1
ENDIF
useC = 0
IF scanScaling >= 3 THEN
useC = 1
ENDIF
lenMax = lenA
IF useC = 1 THEN
lenMax = lenC
ELSIF useB = 1 THEN
lenMax = lenB
ENDIF
//Rank position of the percentile boundary, counted inwards from the extreme.
//It lands between two ordered values: jf is the one outside, fr the distance
//to the next one in. At percentile 100 it collapses onto the extreme itself.
pcA = (100 - bandPct) / 100 * (lenA - 1)
pcB = (100 - bandPct) / 100 * (lenB - 1)
pcC = (100 - bandPct) / 100 * (lenC - 1)
jfA = max(0, round(pcA - 0.5))
jfB = max(0, round(pcB - 0.5))
jfC = max(0, round(pcC - 0.5))
frA = min(1, max(0, pcA - jfA))
frB = min(1, max(0, pcB - jfB))
frC = min(1, max(0, pcC - jfC))
rgRing = maxRanges + 1
dvRing = maxDevs + 1
bigNum = 1000000000.0
ONCE nRg = 0
ONCE nDv = 0
ONCE rgActive = 0
ONCE rgConf = 0
ONCE rgDorm = 0
ONCE coolLeft = 0
ONCE dormDir = 0
ONCE dormSince = 0
ONCE dormRight = 0
ONCE dormHeld = 0
ONCE dormHpct = 0.0
ONCE dormMkY = 0.0
ONCE rgTop = 0.0
ONCE rgBot = 0.0
ONCE rgLeft = 0
ONCE rgOpen = 0
ONCE devPrice = 0.0
ONCE devBar = 0
//---------------------------------------------------------------------------//
// CLOSED-BAR ENGINE: every input is read one bar back //
//---------------------------------------------------------------------------//
cIdx = barindex - 1
cOpen = open[1]
cHigh = high[1]
cLow = low[1]
cClose = close[1]
atrSer = averagetruerange[atrLen](close)
atrV = atrSer[1]
ctxOk = 0
IF cIdx > atrLen + 2 THEN
IF atrV > 0 THEN
ctxOk = 1
ENDIF
ENDIF
//Boundary source. Body extremes ignore the wicks on both sides.
hiSrc = high
loSrc = low
IF boundaryBasis = 2 THEN
hiSrc = max(open, close)
loSrc = min(open, close)
ENDIF
hiSerA = highest[lenA](hiSrc)
loSerA = lowest[lenA](loSrc)
hiSerB = highest[lenB](hiSrc)
loSerB = lowest[lenB](loSrc)
hiSerC = highest[lenC](hiSrc)
loSerC = lowest[lenC](loSrc)
topA = hiSerA[1]
botA = loSerA[1]
topB = hiSerB[1]
botB = loSerB[1]
topC = hiSerC[1]
botC = loSerC[1]
//---------------------------------------------------------------------------//
// PERCENTILE BOUNDARIES //
// Successive descent walks the ordered values inwards from each extreme. //
// The pass that reaches jf + 1 leaves both neighbours of the rank position //
// in hand, so the interpolation between them costs nothing extra. //
// On partial history the boundaries stay on the absolute extremes above, //
// which is what the native functions already return there. //
//---------------------------------------------------------------------------//
IF boundaryBasis = 0 AND cIdx >= lenMax THEN
limHiA = topA
limLoA = botA
prvHiA = topA
prvLoA = botA
FOR kj = 1 TO jfA + 1 DO
nxtHiA = 0 - bigNum
nxtLoA = bigNum
FOR ii = 1 TO lenA DO
vH = hiSrc[ii]
vL = loSrc[ii]
IF vH < limHiA AND vH > nxtHiA THEN
nxtHiA = vH
ENDIF
IF vL > limLoA AND vL < nxtLoA THEN
nxtLoA = vL
ENDIF
NEXT
prvHiA = limHiA
prvLoA = limLoA
IF nxtHiA > 0 - bigNum THEN
limHiA = nxtHiA
ENDIF
IF nxtLoA < bigNum THEN
limLoA = nxtLoA
ENDIF
NEXT
topA = prvHiA + frA * (limHiA - prvHiA)
botA = prvLoA + frA * (limLoA - prvLoA)
IF useB = 1 THEN
limHiB = topB
limLoB = botB
prvHiB = topB
prvLoB = botB
FOR kj = 1 TO jfB + 1 DO
nxtHiB = 0 - bigNum
nxtLoB = bigNum
FOR ii = 1 TO lenB DO
vH = hiSrc[ii]
vL = loSrc[ii]
IF vH < limHiB AND vH > nxtHiB THEN
nxtHiB = vH
ENDIF
IF vL > limLoB AND vL < nxtLoB THEN
nxtLoB = vL
ENDIF
NEXT
prvHiB = limHiB
prvLoB = limLoB
IF nxtHiB > 0 - bigNum THEN
limHiB = nxtHiB
ENDIF
IF nxtLoB < bigNum THEN
limLoB = nxtLoB
ENDIF
NEXT
topB = prvHiB + frB * (limHiB - prvHiB)
botB = prvLoB + frB * (limLoB - prvLoB)
ENDIF
IF useC = 1 THEN
limHiC = topC
limLoC = botC
prvHiC = topC
prvLoC = botC
FOR kj = 1 TO jfC + 1 DO
nxtHiC = 0 - bigNum
nxtLoC = bigNum
FOR ii = 1 TO lenC DO
vH = hiSrc[ii]
vL = loSrc[ii]
IF vH < limHiC AND vH > nxtHiC THEN
nxtHiC = vH
ENDIF
IF vL > limLoC AND vL < nxtLoC THEN
nxtLoC = vL
ENDIF
NEXT
prvHiC = limHiC
prvLoC = limLoC
IF nxtHiC > 0 - bigNum THEN
limHiC = nxtHiC
ENDIF
IF nxtLoC < bigNum THEN
limLoC = nxtLoC
ENDIF
NEXT
topC = prvHiC + frC * (limHiC - prvHiC)
botC = prvLoC + frC * (limLoC - prvLoC)
ENDIF
ENDIF
//---------------------------------------------------------------------------//
// COMPRESSION: band height normalised by ATR and by the square root of the //
// window, so the three scales rank against a comparable yardstick. //
//---------------------------------------------------------------------------//
bandHA = topA - botA
bandHB = topB - botB
bandHC = topC - botC
compA = 99.0
IF ctxOk = 1 AND bandHA > 0 THEN
compA = bandHA / (atrV * sqrt(lenA))
ENDIF
compB = 99.0
IF ctxOk = 1 AND bandHB > 0 THEN
compB = bandHB / (atrV * sqrt(lenB))
ENDIF
compC = 99.0
IF ctxOk = 1 AND bandHC > 0 THEN
compC = bandHC / (atrV * sqrt(lenC))
ENDIF
//Regression tilt of the window mean, as a fraction of band height.
slpSerA = LinearRegressionSlope[lenA](close)
slpSerB = LinearRegressionSlope[lenB](close)
slpSerC = LinearRegressionSlope[lenC](close)
drfA = 99.0
IF bandHA > 0 THEN
drfA = abs(slpSerA[1]) * lenA / bandHA
ENDIF
drfB = 99.0
IF bandHB > 0 THEN
drfB = abs(slpSerB[1]) * lenB / bandHB
ENDIF
drfC = 99.0
IF bandHC > 0 THEN
drfC = abs(slpSerC[1]) * lenC / bandHC
ENDIF
//---------------------------------------------------------------------------//
// The scan only runs when a new range could actually open. Everything below //
// this guard is the expensive part of the indicator. //
//---------------------------------------------------------------------------//
IF ctxOk = 1 AND coolLeft > 0 THEN
coolLeft = coolLeft - 1
ENDIF
scanOn = 0
IF ctxOk = 1 AND rgActive = 0 AND rgDorm = 0 AND coolLeft <= 0 AND cIdx > lenMax + 5 THEN
scanOn = 1
ENDIF
qualified = 0
qualA = 0
qualB = 0
qualC = 0
tolV = touchTol * atrV
IF scanOn = 1 THEN
//--- filter 1: drift and history. Both are free -- the slope is native and the
// rest is a comparison -- so they go first and usually end the scan here.
pasA = 0
IF drfA <= maxDrift AND cIdx > lenA + 5 THEN
pasA = 1
ENDIF
pasB = 0
IF useB = 1 AND drfB <= maxDrift AND cIdx > lenB + 5 THEN
pasB = 1
ENDIF
pasC = 0
IF useC = 1 AND drfC <= maxDrift AND cIdx > lenC + 5 THEN
pasC = 1
ENDIF
//--- filter 2: rotation, boundary touches and containment. One pass for all
// three, and only as far back as the longest window still alive.
lenScan = 0
IF pasA = 1 THEN
lenScan = lenA
ENDIF
IF pasB = 1 THEN
lenScan = lenB
ENDIF
IF pasC = 1 THEN
lenScan = lenC
ENDIF
crsA = 0
crsB = 0
crsC = 0
hitTA = 0
hitBA = 0
hitTB = 0
hitBB = 0
hitTC = 0
hitBC = 0
inA = 0
inB = 0
inC = 0
IF lenScan > 0 THEN
midA = (topA + botA) / 2
midB = (topB + botB) / 2
midC = (topC + botC) / 2
FOR ii = 1 TO lenScan DO
cl = close[ii]
clp = close[ii+1]
hh = high[ii]
ll = low[ii]
IF pasA = 1 AND ii <= lenA THEN
sdN = 0
IF cl > midA THEN
sdN = 1
ENDIF
sdP = 0
IF clp > midA THEN
sdP = 1
ENDIF
IF sdN <> sdP THEN
crsA = crsA + 1
ENDIF
tHit = 0
bHit = 0
IF touchWick = 1 THEN
IF hh >= topA - tolV THEN
tHit = 1
ENDIF
IF ll <= botA + tolV THEN
bHit = 1
ENDIF
ELSE
IF cl >= topA - tolV THEN
tHit = 1
ENDIF
IF cl <= botA + tolV THEN
bHit = 1
ENDIF
ENDIF
hitTA = hitTA + tHit
hitBA = hitBA + bHit
IF cl <= topA AND cl >= botA THEN
inA = inA + 1
ENDIF
ENDIF
IF pasB = 1 AND ii <= lenB THEN
sdN = 0
IF cl > midB THEN
sdN = 1
ENDIF
sdP = 0
IF clp > midB THEN
sdP = 1
ENDIF
IF sdN <> sdP THEN
crsB = crsB + 1
ENDIF
tHit = 0
bHit = 0
IF touchWick = 1 THEN
IF hh >= topB - tolV THEN
tHit = 1
ENDIF
IF ll <= botB + tolV THEN
bHit = 1
ENDIF
ELSE
IF cl >= topB - tolV THEN
tHit = 1
ENDIF
IF cl <= botB + tolV THEN
bHit = 1
ENDIF
ENDIF
hitTB = hitTB + tHit
hitBB = hitBB + bHit
IF cl <= topB AND cl >= botB THEN
inB = inB + 1
ENDIF
ENDIF
IF pasC = 1 AND ii <= lenC THEN
sdN = 0
IF cl > midC THEN
sdN = 1
ENDIF
sdP = 0
IF clp > midC THEN
sdP = 1
ENDIF
IF sdN <> sdP THEN
crsC = crsC + 1
ENDIF
tHit = 0
bHit = 0
IF touchWick = 1 THEN
IF hh >= topC - tolV THEN
tHit = 1
ENDIF
IF ll <= botC + tolV THEN
bHit = 1
ENDIF
ELSE
IF cl >= topC - tolV THEN
tHit = 1
ENDIF
IF cl <= botC + tolV THEN
bHit = 1
ENDIF
ENDIF
hitTC = hitTC + tHit
hitBC = hitBC + bHit
IF cl <= topC AND cl >= botC THEN
inC = inC + 1
ENDIF
ENDIF
NEXT
minCrsA = max(3, round(minRotation * lenA))
minCrsB = max(3, round(minRotation * lenB))
minCrsC = max(3, round(minRotation * lenC))
IF pasA = 1 AND (crsA < minCrsA OR hitTA < minTouches OR hitBA < minTouches OR inA < minContain * lenA) THEN
pasA = 0
ENDIF
IF pasB = 1 AND (crsB < minCrsB OR hitTB < minTouches OR hitBB < minTouches OR inB < minContain * lenB) THEN
pasB = 0
ENDIF
IF pasC = 1 AND (crsC < minCrsC OR hitTC < minTouches OR hitBC < minTouches OR inC < minContain * lenC) THEN
pasC = 0
ENDIF
ENDIF
//--- filter 3: compression rank against its own history on this symbol. This
// is the expensive one -- calibLen iterations -- so it runs last, on the
// windows that got this far and nothing else.
IF pasA = 1 OR pasB = 1 OR pasC = 1 THEN
nRank = max(1, min(calibLen, cIdx - atrLen))
cntRA = 0
cntRB = 0
cntRC = 0
FOR ii = 1 TO nRank DO
IF pasA = 1 AND compA[ii] <= compA THEN
cntRA = cntRA + 1
ENDIF
IF pasB = 1 AND compB[ii] <= compB THEN
cntRB = cntRB + 1
ENDIF
IF pasC = 1 AND compC[ii] <= compC THEN
cntRC = cntRC + 1
ENDIF
NEXT
IF pasA = 1 AND cntRA * 100.0 / nRank <= compPct THEN
qualA = 1
ENDIF
IF pasB = 1 AND cntRB * 100.0 / nRank <= compPct THEN
qualB = 1
ENDIF
IF pasC = 1 AND cntRC * 100.0 / nRank <= compPct THEN
qualC = 1
ENDIF
ENDIF
IF qualA = 1 OR qualB = 1 OR qualC = 1 THEN
qualified = 1
ENDIF
ENDIF
//The longest window that passed defines the range.
scanLen = lenA
scanTop = topA
scanBot = botA
IF qualB = 1 THEN
scanLen = lenB
scanTop = topB
scanBot = botB
ENDIF
IF qualC = 1 THEN
scanLen = lenC
scanTop = topC
scanBot = botC
ENDIF
//---------------------------------------------------------------------------//
// RANGE ENGINE //
//---------------------------------------------------------------------------//
IF ctxOk = 1 THEN
//--- open a new range ----------------------------------------------------//
IF rgActive = 0 AND rgDorm = 0 AND coolLeft <= 0 AND qualified = 1 THEN
//Walk the left edge back while earlier bars stay inside the band.
anchorBars = scanLen
IF anchorExtend = 1 THEN
limBack = min(anchorLB, cIdx)
allowOut = max(2, round((1 - minContain) * scanLen))
nOut = 0
offB = 0
WHILE offB < limBack AND nOut <= allowOut DO
cOff = close[offB+1]
closedIn = 0
IF cOff <= scanTop AND cOff >= scanBot THEN
closedIn = 1
ENDIF
IF closedIn = 1 THEN
nOut = max(0, nOut - 1)
IF high[offB+1] <= scanTop + tolV AND low[offB+1] >= scanBot - tolV AND offB + 1 >= scanLen THEN
anchorBars = offB + 1
ENDIF
ELSE
nOut = nOut + 1
ENDIF
offB = offB + 1
WEND
ENDIF
rgLeft = cIdx - anchorBars + 1
rgOpen = cIdx
rgTop = scanTop
rgBot = scanBot
rgActive = 1
rgConf = 0
ENDIF
//--- live range: absorb, break or retire by age --------------------------//
IF rgActive = 1 THEN
brkOff = breakBuf * atrV
absOff = overTol * atrV
IF absorbOver = 1 AND wickBreak = 0 AND cClose <= rgTop AND cClose >= rgBot THEN
IF cHigh > rgTop AND cHigh <= rgTop + absOff THEN
rgTop = cHigh
ENDIF
IF cLow < rgBot AND cLow >= rgBot - absOff THEN
rgBot = cLow
ENDIF
ENDIF
brkUp = 0
brkDn = 0
IF wickBreak = 1 THEN
IF cHigh > rgTop + brkOff THEN
brkUp = 1
ENDIF
IF cLow < rgBot - brkOff THEN
brkDn = 1
ENDIF
ELSE
IF cClose > rgTop + brkOff THEN
brkUp = 1
ENDIF
IF cClose < rgBot - brkOff THEN
brkDn = 1
ENDIF
ENDIF
rgAged = 0
IF maxRangeAge > 0 AND cIdx - rgOpen + 1 >= maxRangeAge THEN
rgAged = 1
ENDIF
IF brkUp = 1 OR brkDn = 1 OR rgAged = 1 THEN
brkDir = 0
IF brkUp = 1 THEN
brkDir = 1
ELSIF brkDn = 1 THEN
brkDir = -1
ENDIF
//A break still extends the box over the breaking bar, but that bar is
//not counted: the retired figure matches the last live reading.
heldBars = cIdx - rgLeft + 1
IF brkDir <> 0 THEN
heldBars = cIdx - rgLeft
ENDIF
rgHpct = 0.0
IF rgBot <> 0 THEN
rgHpct = (rgTop - rgBot) / rgBot * 100.0
ENDIF
holdMerge = 0
IF mergeDev = 1 AND brkDir <> 0 AND rgConf = 1 THEN
holdMerge = 1
ENDIF
//A provisional structure leaves nothing behind.
IF rgConf = 1 AND holdMerge = 0 THEN
mkY = cLow
IF brkDir <> 1 THEN
mkY = cHigh
ENDIF
slR = nRg MOD rgRing
$rgLf[slR] = rgLeft
$rgRt[slR] = cIdx
$rgTp[slR] = rgTop
$rgBt[slR] = rgBot
$rgDr[slR] = brkDir
$rgNb[slR] = heldBars
$rgHp[slR] = rgHpct
$rgMy[slR] = mkY
nRg = nRg + 1
ENDIF
IF holdMerge = 1 THEN
rgDorm = 1
dormSince = cIdx
dormDir = brkDir
dormRight = cIdx
dormHeld = heldBars
dormHpct = rgHpct
//Marker height frozen on the breaking bar, not read again later.
dormMkY = cLow
IF brkDir <> 1 THEN
dormMkY = cHigh
ENDIF
devPrice = cHigh
IF brkDir = -1 THEN
devPrice = cLow
ENDIF
devBar = cIdx
ENDIF
rgActive = 0
rgConf = 0
coolLeft = cooldownBars
ELSE
rgConf = 0
IF cIdx - rgLeft + 1 >= minRangeBars THEN
rgConf = 1
ENDIF
ENDIF
ENDIF
//--- dormant: a broken range waiting to be revived ------------------------//
IF rgDorm = 1 THEN
IF dormDir = 1 AND cHigh > devPrice THEN
devPrice = cHigh
devBar = cIdx
ENDIF
IF dormDir = -1 AND cLow < devPrice THEN
devPrice = cLow
devBar = cIdx
ENDIF
reEnt = 0
IF dormDir = 1 AND cClose <= rgTop THEN
reEnt = 1
ENDIF
IF dormDir = -1 AND cClose >= rgBot THEN
reEnt = 1
ENDIF
IF reEnt = 1 AND cIdx > dormSince THEN
slD = nDv MOD dvRing
$dvX[slD] = devBar
$dvY[slD] = devPrice
$dvD[slD] = dormDir
nDv = nDv + 1
rgActive = 1
rgConf = 1
rgDorm = 0
dormDir = 0
coolLeft = 0
ELSIF cIdx - dormSince >= devWindow THEN
slR = nRg MOD rgRing
$rgLf[slR] = rgLeft
$rgRt[slR] = dormRight
$rgTp[slR] = rgTop
$rgBt[slR] = rgBot
$rgDr[slR] = dormDir
$rgNb[slR] = dormHeld
$rgHp[slR] = dormHpct
$rgMy[slR] = dormMkY
nRg = nRg + 1
rgDorm = 0
dormDir = 0
ENDIF
ENDIF
ENDIF
//---------------------------------------------------------------------------//
// DRAWING: one pass over the ring buffer plus the live range, all repainted //
// from stored state so the defparam above can only help. //
//---------------------------------------------------------------------------//
IF islastbarupdate THEN
nShow = min(nRg, maxRanges)
istR = (nRg - nShow) MOD rgRing
liveOne = 0
IF rgActive = 1 OR rgDorm = 1 THEN
liveOne = 1
ENDIF
FOR q = 0 TO nShow - 1 + liveOne DO
IF q <= nShow - 1 THEN
slR = (istR + q) MOD rgRing
bxL = $rgLf[slR]
bxR = $rgRt[slR]
bxT = $rgTp[slR]
bxB = $rgBt[slR]
bxD = $rgDr[slR]
bxN = $rgNb[slR]
bxP = $rgHp[slR]
bxY = $rgMy[slR]
bxSt = 1
bxMrk = 1
ELSE
bxL = rgLeft
bxT = rgTop
bxB = rgBot
bxR = barindex
bxD = 0
bxN = barindex - rgLeft + 1
bxSt = rgConf
bxMrk = 0
bxY = cLow
//A dormant range has already broken: it keeps its marker until the
//break either merges back in as a deviation or the wait expires.
IF rgDorm = 1 THEN
bxR = dormRight
bxD = dormDir
bxN = dormHeld
bxSt = 1
bxMrk = 1
bxY = dormMkY
ENDIF
bxP = 0.0
IF bxB <> 0 THEN
bxP = (bxT - bxB) / bxB * 100.0
ENDIF
ENDIF
//Colour follows the side that gave way; a live range stays neutral.
cr = rngR
cg = rngG
cb = rngB
IF bxD = 1 THEN
cr = bullR
cg = bullG
cb = bullB
ELSIF bxD = -1 THEN
cr = bearR
cg = bearG
cb = bearB
ENDIF
//A provisional box is drawn with a faint border and no shading.
bdAlpha = 90
IF bxSt = 1 THEN
bdAlpha = 200
ENDIF
DRAWRECTANGLE(bxL, bxT, bxR, bxB) COLOURED(cr, cg, cb, bdAlpha) FILLCOLOR(0, 0, 0, 0)
IF bxSt = 1 AND bxT > bxB THEN
sliceH = (bxT - bxB) / gradSteps
FOR gi = 0 TO gradSteps - 1 DO
cDist = abs((gi + 0.5) / gradSteps - 0.5) * 2.0
trPine = min(99, max(0, fillTrans + (1.0 - cDist) * 10))
alph = round(255 * (100 - trPine) / 100)
DRAWRECTANGLE(bxL, bxT - sliceH * gi, bxR, bxT - sliceH * (gi + 1)) COLOURED(0, 0, 0, 0) FILLCOLOR(cr, cg, cb, alph)
NEXT
ENDIF
bxMid = (bxT + bxB) / 2
IF showEq = 1 THEN
DRAWSEGMENT(bxL, bxMid, bxR, bxMid) COLOURED(cr, cg, cb, 190) STYLE(dottedline, 1)
ENDIF
IF showQuart = 1 THEN
bxQ1 = bxB + (bxT - bxB) * 0.25
bxQ3 = bxB + (bxT - bxB) * 0.75
DRAWSEGMENT(bxL, bxQ1, bxR, bxQ1) COLOURED(cr, cg, cb, 110) STYLE(dottedline, 1)
DRAWSEGMENT(bxL, bxQ3, bxR, bxQ3) COLOURED(cr, cg, cb, 110) STYLE(dottedline, 1)
ENDIF
IF showLabel = 1 THEN
labX = round((bxL + bxR) / 2)
labY = bxT + 0.5 * atrV
bxPr = round(bxP * 100) / 100
IF bxSt = 1 THEN
DRAWTEXT("RANGE #bxN# BARS #bxPr#%", labX, labY) COLOURED(cr, cg, cb, 255)
ELSE
DRAWTEXT("FORMING #bxN# BARS #bxPr#%", labX, labY) COLOURED(cr, cg, cb, 255)
ENDIF
ENDIF
//Breakout marker. Symbol and caption go in two calls so the arrow lands
//on its own candle instead of drifting with the width of the text.
IF showBreak = 1 AND bxMrk = 1 AND bxD <> 0 THEN
IF bxD = 1 THEN
DRAWTEXT("▲", bxR, bxY - 0.35 * atrV) COLOURED(cr, cg, cb, 255)
DRAWTEXT("Breakout", bxR, bxY - 0.95 * atrV) COLOURED(cr, cg, cb, 255)
ELSE
DRAWTEXT("▼", bxR, bxY + 0.35 * atrV) COLOURED(cr, cg, cb, 255)
DRAWTEXT("Breakout", bxR, bxY + 0.95 * atrV) COLOURED(cr, cg, cb, 255)
ENDIF
ENDIF
NEXT
//--- deviation markers: the level that was swept, not the bar that returned //
IF showDev = 1 THEN
nShowD = min(nDv, maxDevs)
istD = (nDv - nShowD) MOD dvRing
FOR q = 0 TO nShowD - 1 DO
slD = (istD + q) MOD dvRing
dvX = $dvX[slD]
dvY = $dvY[slD]
dvD = $dvD[slD]
//A failed break of resistance resolves bearish, and the reverse.
dr = bullR
dg = bullG
db = bullB
IF dvD = 1 THEN
dr = bearR
dg = bearG
db = bearB
ENDIF
IF dvD = 1 THEN
DRAWTEXT("◆", dvX, dvY + 0.35 * atrV) COLOURED(dr, dg, db, 255)
DRAWTEXT("Deviation", dvX, dvY + 0.95 * atrV) COLOURED(dr, dg, db, 255)
ELSE
DRAWTEXT("◆", dvX, dvY - 0.35 * atrV) COLOURED(dr, dg, db, 255)
DRAWTEXT("Deviation", dvX, dvY - 0.95 * atrV) COLOURED(dr, dg, db, 255)
ENDIF
NEXT
ENDIF
ENDIF
RETURN
Settings Worth Touching
Base Scan Length is the one that changes the character of the indicator. At 20 you get the three windows at 20/40/60. Lower values open boxes sooner and catch brief pauses inside trends. Higher values reserve detection for extended consolidation. Be aware that the cost of the percentile boundary grows roughly with the square of this setting, so a base of 100 with all three scales is noticeably slower to load than a base of 20.
Compression Percentile is the volume dial. Raise it and you accept wider structures and get more boxes; lower it and you isolate tight coiling only. Because it is a rank against the instrument’s own history, the same number keeps its meaning when you move it to another market — which is not true of an ATR multiple.
Min Rotation Rate is the one people should touch and do not. If you are getting boxes drawn around what are obviously reversals, raise it. Three crossings is the floor, so on short windows the lowest settings all resolve to the same thing.
Boundary Basis is worth switching to Body extremes on anything with erratic wicks. It is also the fastest setting: it uses native highest/lowest and skips the percentile calculation entirely.
Deviation Window should scale with your interval. Ten bars on a daily chart is two weeks and recovers deep excursions; ten bars on a 5-minute chart is under an hour. No new range opens while one is dormant, so setting this too high on a fast chart makes the detector go quiet.
Honest Criticism
Six filters and eleven parameters is a lot of surface. With this many dials there is always a combination that draws beautiful boxes on any chart you point it at, and the boxes will look convincing because they are fitted to what already happened. The compression rank protects against the worst of it — it is measured against the instrument’s own history rather than a number you chose — but the rotation, touch, drift and containment thresholds are all yours to tune, and tuning them while looking at the chart is how you end up with an indicator that describes the past perfectly.
Minimum Range Bars does almost nothing at the defaults. Because the left edge anchors backwards over earlier history, a box is usually born already spanning more bars than the minimum requires, so it is confirmed on the bar it appears. In testing over synthetic series with planted consolidations, provisional boxes that got dropped before confirming were essentially non-existent. The setting only starts to bite above the anchored span — which means the provisional state, and the “only structures that held stay on the chart” promise that goes with it, is quieter than it sounds.
Deviations are more comfortable in hindsight than in real time. A range that survives eight failed breaks looks, on the finished chart, like one clean structure with eight stop hunts inside it. Live, it was eight breakout signals that did not work. The indicator is honest about this — it withdraws the marker when the break fails — but if you are trading the breakouts, the withdrawal happens after you were already in. The deviation marker is a good level. It is not a good excuse for the signal that preceded it.
The percentile boundary is the expensive part. It runs on every bar, on every scanned window, because the compression rank needs its own history to rank against. On a long chart with a large base length you will feel it on load. If speed matters more than spike rejection, Absolute or Body extremes removes that cost completely.
Conclusion
The idea worth stealing here is not the boxes. It is rotation as a filter.
Almost every consolidation detector measures width, or volatility, or how long price stayed inside a band. All three of those accept a V-shaped reversal, because a reversal is narrow, quiet and contained — it simply never came back. Counting midline crossings is a cheap, one-line measurement that separates the two, and you can bolt it onto any range logic you already run.
The second idea worth stealing is ranking your volatility measurement against its own history instead of against a multiple you picked. It costs a loop and it buys you a threshold that means the same thing on every instrument you apply it to.