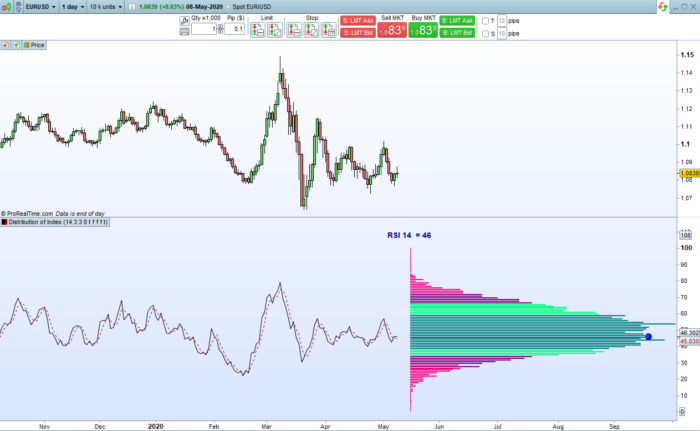
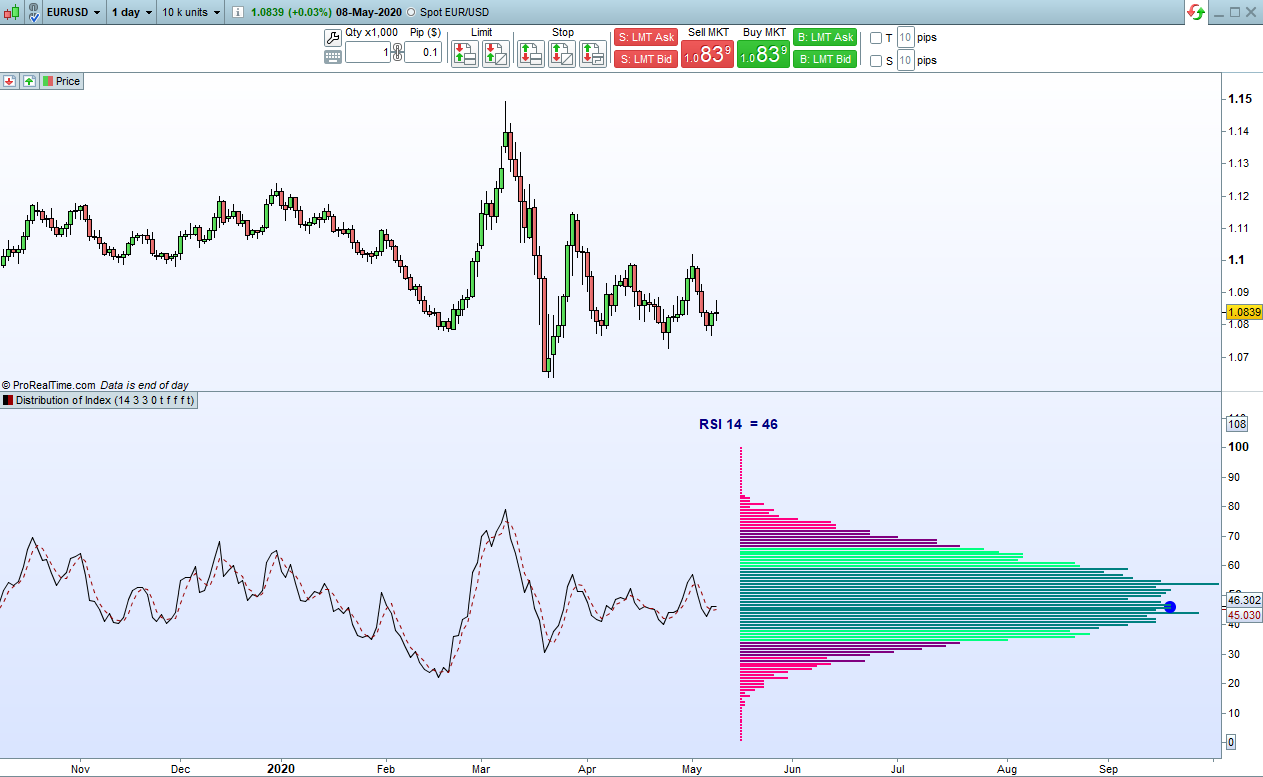
This indicator displays the distribution of values returned by the RSI, Stochastic, Williams%R and ADX indicators.
This indicator only works on v11 onwards.
Select which indicator you want to analyse with the ‘RSIndex’, ‘Stoch’, ‘WilliamsR’ and ‘ADX’ settings. The default is RSI if nothing is selected. If two are selected then it defaults to the last one selected.
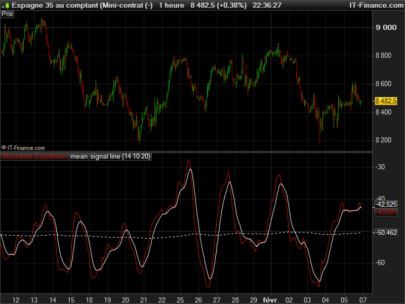
‘P’ is the period setting for the index. ‘K’ is the K% setting for the stochastic index. ‘D’ is the average period used in the signal line. The signal line is just a simple moving average of the index value and is not used in the distribution calculations. You can turn this signal line display on or off with the ‘SignalLine’ setting.
You can select a start date to analyse from or set ‘StartDate’ to zero to analyse all of the data.
The distribution chart shows you where the index spends most of its time and where it spends the least amount of time. The chart has a maximum score of 100% which represents the highest scoring distribution value. The displayed value and dot show you where the index currently is on the distribution curve and how it scores compared to the maximum score.
Note: The Williams%R returned values have been changed from -100 to zero and are shown as zero to 100 for ease of calculations in the code.
As always I advise downloading and importing the ITF file to get full functionality.
|
1 2 3 4 5 6 7 8 9 10 11 12 13 14 15 16 17 18 19 20 21 22 23 24 25 26 27 28 29 30 31 32 33 34 35 36 37 38 39 40 41 42 43 44 45 46 47 48 49 50 51 52 53 54 55 56 57 58 59 60 61 62 63 64 65 66 67 68 69 70 71 72 73 74 75 76 77 78 79 80 81 82 83 84 85 86 87 88 89 90 91 92 93 94 95 96 97 98 |
//Distribution of Index //PRT v11 onwards //By Vonasi //Date: 20200509 //p = 14 // Period used in indicator //k = 3 // K% setting for stochastic //d = 9 // Period used for signal line //RSIndex = 1 // Select RSI //Stoch = 0 // Select Stochastic //WilliamsR = 0 // Select Williams%R //ADXindex = 0 // Select ADX //SignalLine = 1 // Turn on/off display of signal line //StartDate = 19950101 // Date to start analysis from. Zero = all data p = max(1,p) k = max(1,k) d = max(1,d) if date >= startdate then once signal = undefined if RSIndex or (not Stoch and not WilliamsR and not ADXindex) then indicator = rsi[p] endif if Stoch then indicator = stochastic[p,k] endif if WilliamsR then indicator = williams[p]+100 endif if ADXindex then indicator = ADX[p] endif if signalline then signal = average[d](indicator) endif rindicator = round(indicator) for a = 1 to 100 if rindicator = a then $perc[a] = $perc[a]+1 maxval = max(maxval,$perc[a]) break endif next if islastbarupdate then for a = 1 to 100 thisperc = round(($perc[a]/maxval)*100) if rindicator = a then drawpoint(barindex+thisperc+5,a,3) coloured(0,0,255) drawtext("#thisperc#%",barindex+115,a,sansserif,bold,14) coloured(0,0,128) endif r = 255 g = 0 if thisperc >= 25 then r = 128 g = 0 endif if thisperc >= 50 then r = 0 g = 255 endif if thisperc >= 75 then r = 0 g = 128 endif drawrectangle(barindex+5,a,barindex+thisperc+5,a) coloured(r,g,128) next for a = 1 to 4 if ADXindex then drawtext("ADX #p# = #rindicator#",barindex+5,108,sansserif,bold,14) coloured(0,0,128) break endif if WilliamsR then drawtext("Williams%R #p# = #rindicator#",barindex+5,108,sansserif,bold,14) coloured(0,0,128) break endif if Stoch then drawtext("Stochastic #p##k##d# = #rindicator#",barindex+5,108,sansserif,bold,14) coloured(0,0,128) break endif if RSIndex or (not Stoch and not WilliamsR and not ADXindex) then drawtext("RSI #p# = #rindicator#",barindex+5,108,sansserif,bold,14) coloured(0,0,128) break endif next endif endif return 0 coloured(0,0,0,0) as "Line",108 coloured(0,0,0,0) as "Line",indicator as "Indicator",signal style(dottedline) as "Signal" |
Share this
No information on this site is investment advice or a solicitation to buy or sell any financial instrument. Past performance is not indicative of future results. Trading may expose you to risk of loss greater than your deposits and is only suitable for experienced investors who have sufficient financial means to bear such risk.
ProRealTime ITF files and other attachments :
Find other exclusive trading pro-tools on ![]()
PRC is also on YouTube, subscribe to our channel for exclusive content and tutorials


Hi Vonasi,
Could you explain what “$perc[a]” is? I tried to apply it but it keeps telling me there’s an error..
Code compatible only with version 11, as it is written in bold in the text of this post: This indicator only works on v11 onwards.
Ah I had hoped it was a problem unrelated to the version of prorealtime! We’ll keep waiting on the new release then 🙂
Superbe !
An updated version with a bug fix can be found here:
https://www.prorealcode.com/topic/distribution-of-index-indicator-bug-fix/
hey Vonasi
is it possible you can help me get this indicator to show how much a market moves in %?
does need updateing for v12