

Deviation Trend Profile indicator
1. Introduction
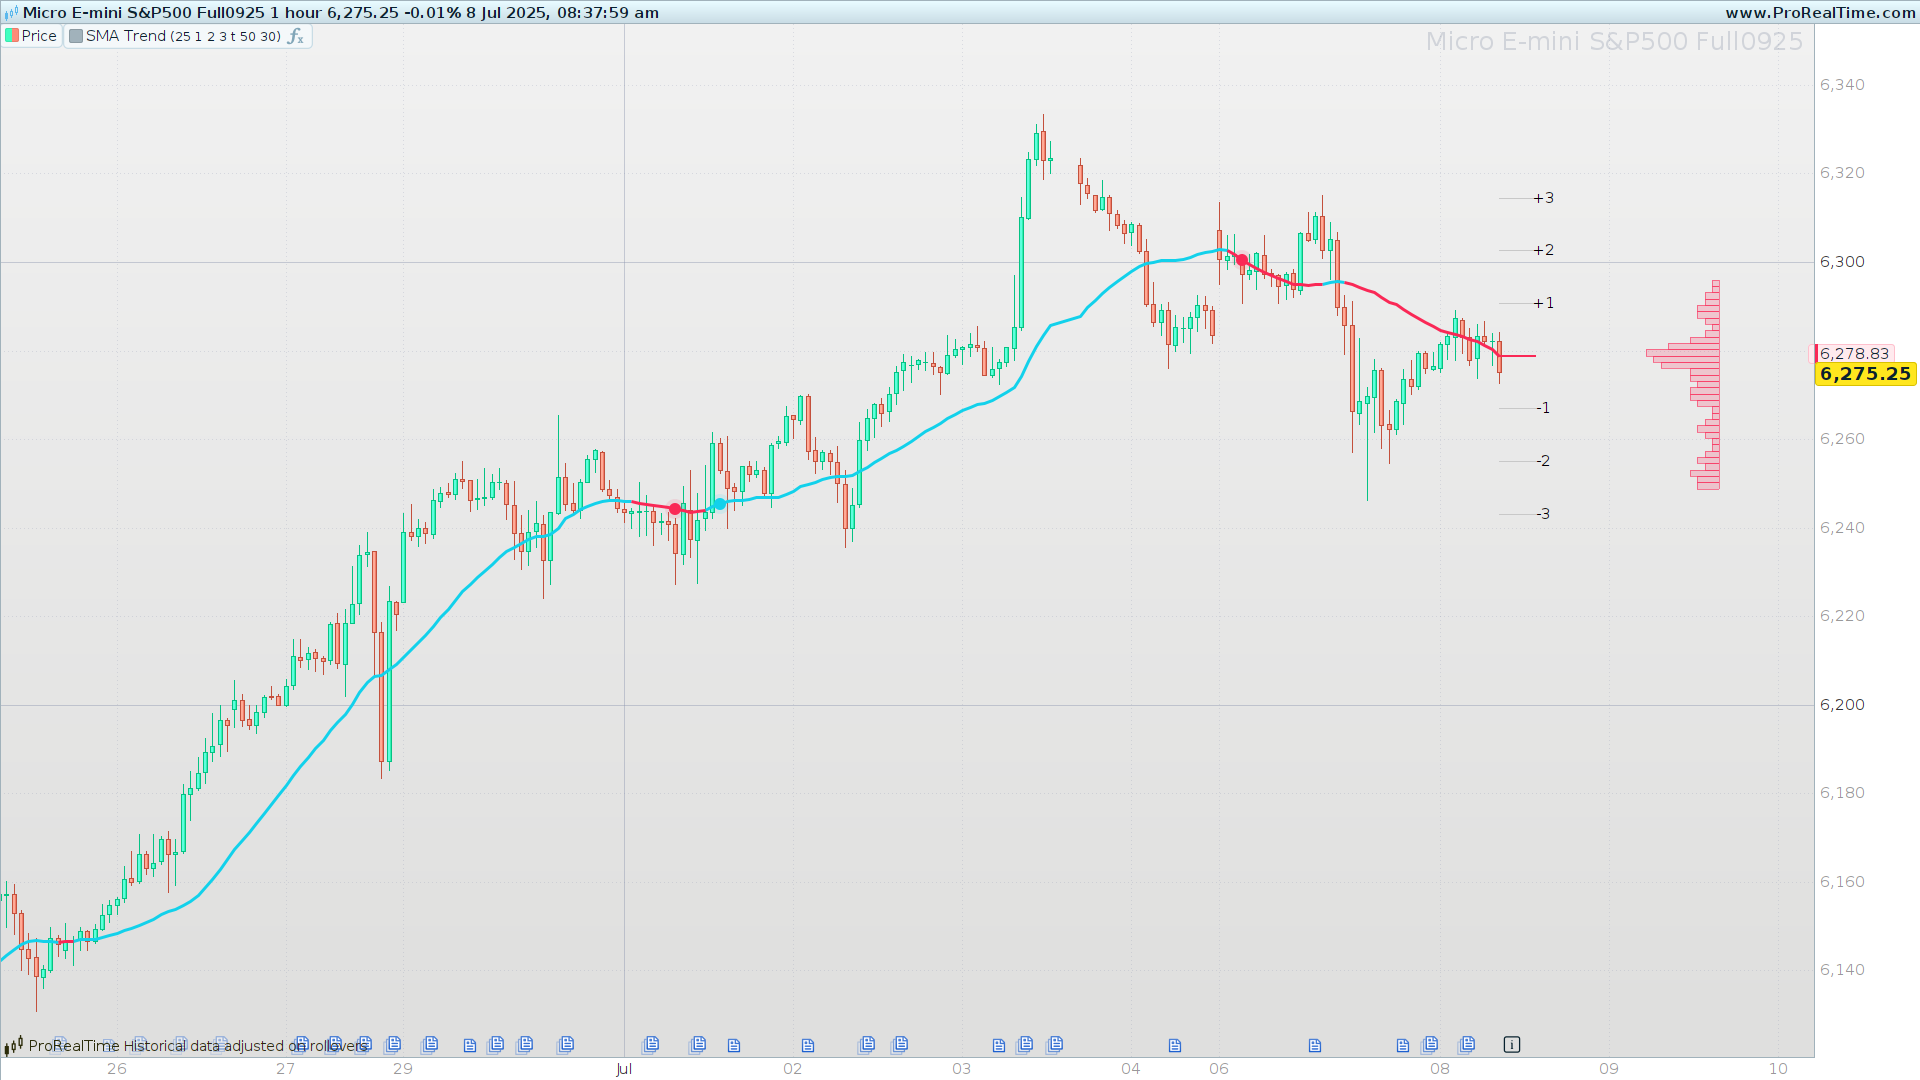
The Deviation Trend Profile indicator, developed by BigBeluga, merges trend analysis via a simple moving average (SMA) with a distribution profile based on ATR-scaled deviations. Its purpose is to highlight trend changes and zones of high or low price concentration, offering a visual map of volatility accumulation since the last market inflection.
2. What Is Deviation Trend Profile?
Deviation Trend Profile is a dual-purpose tool:
-
Trend: Plots an SMA whose color reflects momentum, and marks the exact bars where bullish or bearish turns begin.
-
Volatility & Distribution: Overlays six deviation lines (±1, ±2, ±3 ATR multiples) around the SMA, and generates a side histogram showing how many closes have fallen into each of a configurable number of bins between the maximum and minimum deviation levels.
This hybrid approach makes it easy to see when price deviates significantly from its mean and how those deviations are distributed over time.
3. How It Works
3.1. Calculation of SMA and ATR
-
SMA: Simple moving average of closes over a user-set period (
smaLength, default 50). -
ATR: 200-bar Average True Range, serving as the volatility baseline for scaling deviations.
3.2. Standard Deviation Levels
Six horizontal lines are drawn around the SMA:
-
Positive levels:
-
+1 = SMA + ATR × mult1
-
+2 = SMA + ATR × mult2
-
+3 = SMA + ATR × mult3
-
-
Negative levels:
-
–1 = SMA – ATR × mult1
-
–2 = SMA – ATR × mult2
-
–3 = SMA – ATR × mult3
-
These lines help distinguish “normal” price territory (±1 ATR) from stronger expansion zones (±2 and ±3 ATR).
3.3. Trend Change Detection
The indicator computes a normalized momentum:
A cross above +0.1 signals the start of a bullish trend; a cross below –0.1 signals the start of a bearish trend.
Each turn is marked with a point on the SMA.
4. Deep Dive into the Distribution Profile (Histogram)
This advanced feature works as follows:
-
Initialize bins
Create an array$binof lengthbins(default 50), filled with zeros. -
Populate bins with closes
For each bar since the last trend change (startIndex):-
Compute the dynamic range:
profileRange = maxDev − minDev. -
Compute each bin’s width:
step = profileRange / bins. -
Determine which bin a close
cfalls into by comparing it againstlower = minDev + step × iandupper = lower + step, then increment$bin[i].
-
-
Determine color scaling
FindmaxVal, the highest frequency among all bins. This value is used to set each rectangle’s transparency proportionally (val / maxVal). -
Draw rectangles
-
Position the histogram to the right by
profileOffsetbars. -
For each bin with
val > 0, draw a rectangle fromupperdown tolower, with width proportional toval, filled semi-transparently in the current trend color.
-
The result is a lateral histogram showing price-close concentration since the last turn, highlighting potential dynamic support/resistance zones.
5. Parameter Configuration
| Parameter | Description | Default |
|---|---|---|
smaLength |
Period of the simple moving average | 50 |
mult1 |
ATR multiplier for ±1 deviation | 1 |
mult2 |
ATR multiplier for ±2 deviation | 2 |
mult3 |
ATR multiplier for ±3 deviation | 3 |
showTp |
Show distribution profile (1 = yes, 0 = no) | 1 |
bins |
Number of histogram bins | 50 |
profileOffset |
Horizontal offset (bars) for the histogram | 30 |
colUpR/G/B |
RGB channels for bullish trend color | 18/209/235 |
colDnR/G/B |
RGB channels for bearish trend color | 250/40/86 |
6. Default Values and Recommendations
-
SMA (50) & ATR (200): a balanced medium-term setting.
-
Deviations 1–3: distinguish consolidation (±1) from strong expansions (±2, ±3).
-
Bins (50): balance detail and performance; reduce to 30–40 for faster charts, or increase to 70–100 for finer analysis.
-
Offset (30 bars): keeps the profile clear of price action; adjust to fit your chart width.
-
Colors: customize to match your template, ensuring good contrast against candles and other studies.
7. ProBuilder Code
defparam drawonlastbaronly=true
//---------------------------------------------//
//PRC_Deviation Trend Profile [BigBeluga]
//version = 0
//05.07.24
//Iván González @ www.prorealcode.com
//Sharing ProRealTime knowledge
//---------------------------------------------//
//---------------------------------------------//
// INPUTS - VARIABLE CONFIGURATION
//---------------------------------------------//

// >> SMA and Deviation Parameters
smaLength = 50 // SMA Length
mult1 = 1 // Standart Deviation 1
mult2 = 2 // Standart Deviation 2
mult3 = 3 // Standart Deviation 3

// >> Distribution Profile Parameters
showTp = 1
bins = 50
profileOffset = 30

// >> Theme Colors
colUpR = 18
colUpG = 209
colUpB = 235

colDnR = 250
colDnG = 40
colDnB = 86

//---------------------------------------------//
// PERSISTENT VARIABLES
//---------------------------------------------//
ONCE startIndex = -1
ONCE trend = 0

//---------------------------------------------//
// MAIN CALCULATIONS
//---------------------------------------------//

// --- Moving Average and Volatility
avg = Average[smaLength](close)
atr = AverageTrueRange[200]

// --- Deviation Levels using ATR
stdv1 = avg + atr * mult1
stdv2 = avg + atr * mult2
stdv3 = avg + atr * mult3

stdv1m = avg - atr * mult1
stdv2m = avg - atr * mult2
stdv3m = avg - atr * mult3

maxDev = stdv3
minDev = stdv3m

// --- Trend Detection
avgDiff = avg - avg[5]

IF atr > 0 THEN
avgCol = avgDiff / atr
ELSE
avgCol = 0
ENDIF

// --- Trend Change Logic
IF avgCol CROSSES OVER 0.1 AND trend <> 1 THEN
trend = 1
startIndex = barindex
ENDIF

IF avgCol CROSSES UNDER -0.1 AND trend <> -1 THEN
trend = -1
startIndex = barindex
ENDIF

// --- SMA Color Based on Momentum
r = 128
g = 128
b = 128

IF avgDiff > 0 THEN
r = colUpR
g = colUpG
b = colUpB
ELSE
r = colDnR
g = colDnG
b = colDnB
ENDIF

//---------------------------------------------//
// DRAWING LOGIC
//---------------------------------------------//

IF IsLastBarUpdate THEN

// Draw deviation lines and labels
// Nivel +1
DRAWSEGMENT(barindex, stdv1, barindex + 5, stdv1) COLOURED(200,200,200)
DRAWTEXT("+1", barindex + 6, stdv1)

// Nivel +2
DRAWSEGMENT(barindex, stdv2, barindex + 5, stdv2) COLOURED(200,200,200)
DRAWTEXT("+2", barindex + 6, stdv2)

// Nivel +3
DRAWSEGMENT(barindex, stdv3, barindex + 5, stdv3) COLOURED(200,200,200)
DRAWTEXT("+3", barindex + 6, stdv3)

// Nivel -1
DRAWSEGMENT(barindex, stdv1m, barindex + 5, stdv1m) COLOURED(200,200,200)
DRAWTEXT("-1", barindex + 6, stdv1m)

// Nivel -2
DRAWSEGMENT(barindex, stdv2m, barindex + 5, stdv2m) COLOURED(200,200,200)
DRAWTEXT("-2", barindex + 6, stdv2m)

// Nivel -3
DRAWSEGMENT(barindex, stdv3m, barindex + 5, stdv3m) COLOURED(200,200,200)
DRAWTEXT("-3", barindex + 6, stdv3m)

// Draw central SMA line
DRAWSEGMENT(barindex, avg, barindex + 5, avg) COLOURED(r, g, b) STYLE(Line, 2)

// --- Distribution Profile Logic
IF showTp = 1 AND startIndex > -1 THEN

UNSET($bin)

loockback = barindex - startIndex


IF loockback > 0 THEN

profileRange = maxDev - minDev
step = profileRange / bins

FOR k = 0 TO bins - 1 DO
$bin[k] = 0
NEXT

FOR l = 0 TO loockback - 1 DO
c = close[l]
mi = minDev[l]
s = (maxDev[l] - mi) / bins

IF s > 0 THEN
for i=0 to bins-1 do
lower=mi+s*i
upper=lower+s
if c>=lower-s and c<=upper+s then
$bin[i]=$bin[i]+1
endif
next
ENDIF
NEXT

maxVal = 0
FOR m = 0 TO bins - 1 DO
IF $bin[m] > maxVal THEN
maxVal = $bin[m]
ENDIF
NEXT

profileStart = barindex + profileOffset

FOR j = 0 TO bins - 1 DO
val = $bin[j]

IF val > 0 THEN
lower = minDev + step * j
upper = lower + step

DRAWRECTANGLE(profileStart - val, upper, profileStart, lower) COLOURED(r, g, b, 50) BORDERCOLOR(r,g,b,150)
ENDIF
NEXT
ENDIF
ENDIF

for i=0 to barindex do
// Draw SMA and trend-change points on all bars
IF trend[i] = 1 AND trend[i+1] <> 1 THEN
drawpoint(barindex[i], avg[i],3) COLOURED(colUpR, colUpG, colUpB)
drawpoint(barindex[i], avg[i],5) COLOURED(colUpR, colUpG, colUpB,30)
ENDIF

IF trend[i] = -1 AND trend[i+1] <> -1 THEN
drawpoint(barindex[i], avg[i],3) COLOURED(colDnR, colDnG, colDnB)
drawpoint(barindex[i], avg[i],5) COLOURED(colDnR, colDnG, colDnB,30)
ENDIF
next
ENDIF

//---------------------------------------------//
RETURN avg COLOURED(r, g, b) STYLE(Line, 3) AS "SMA Trend"
