

Delorean Trend Detection Oscillator v.1.1
July 18, 2025, 10:33 AM
Indicators
1 Comment
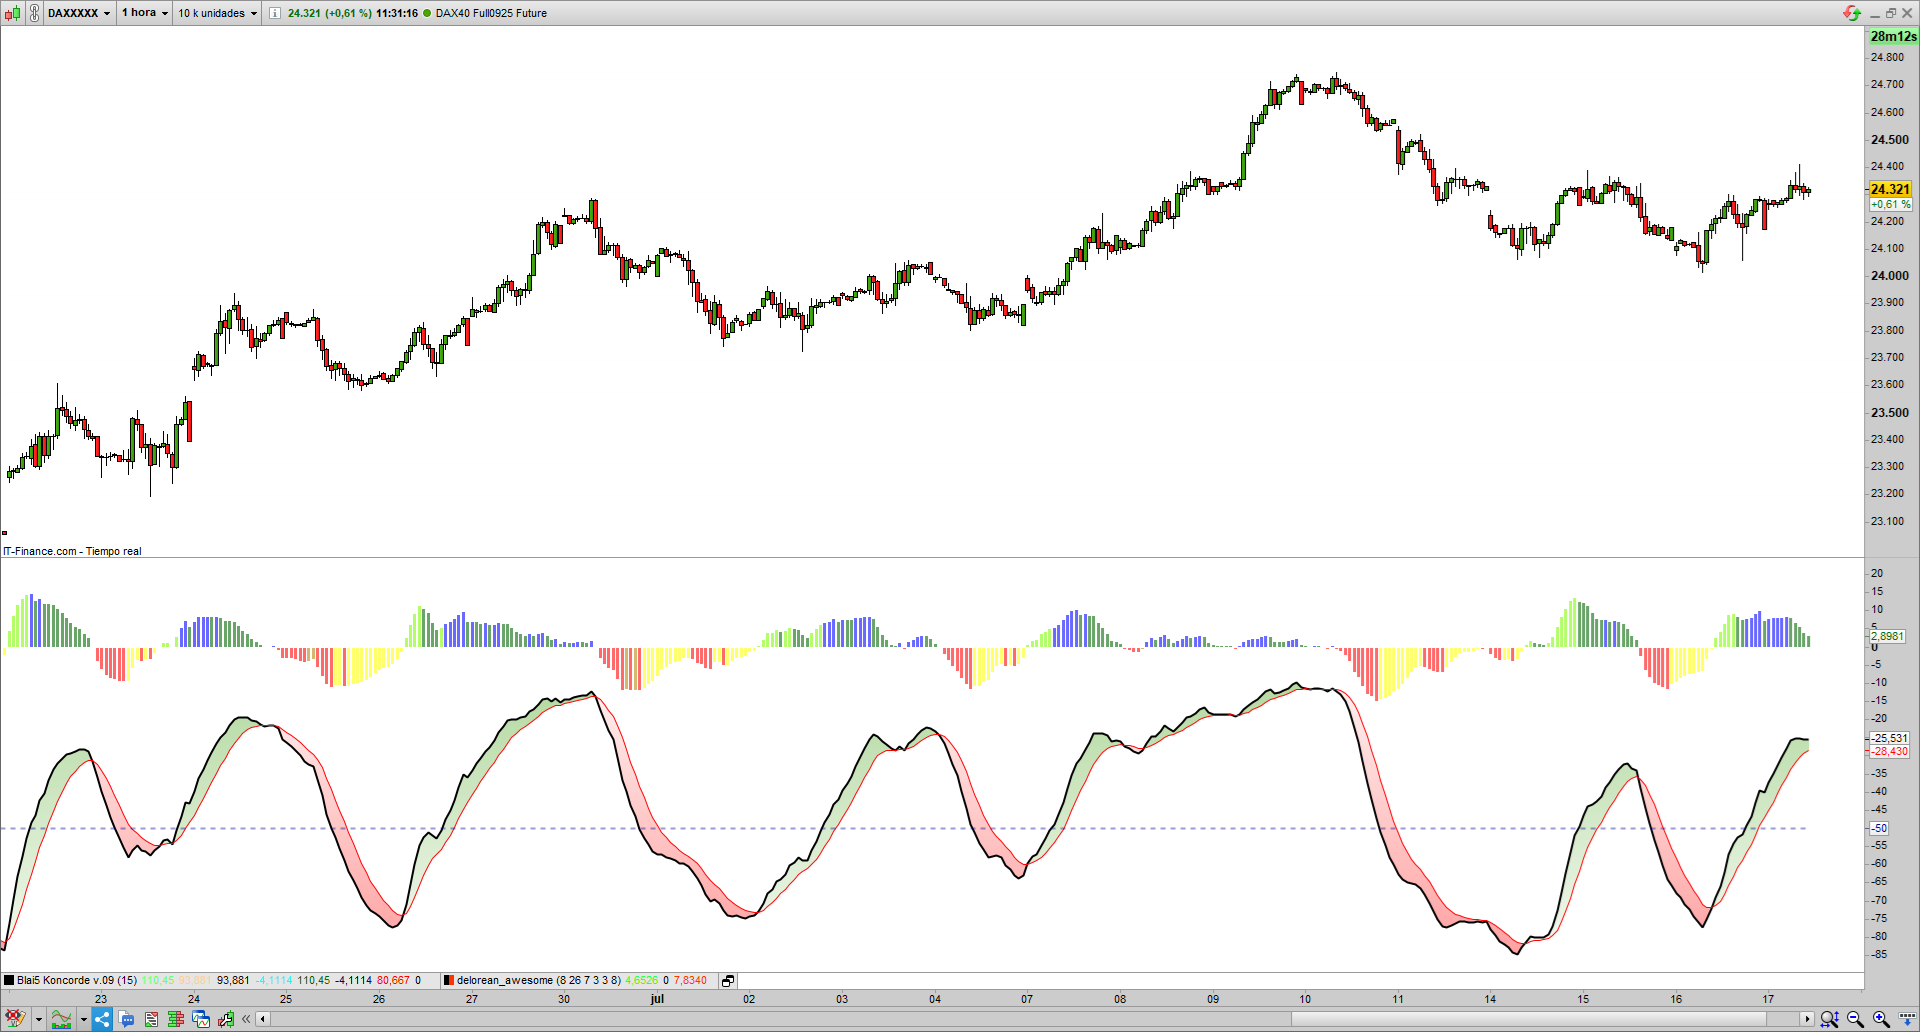
The “Delorean Trend Detection Oscillator” is a technical indicator designed for the DAX40 future, originally created by Domenec and adapted by me. Its purpose is to detect market trends using an oscillator that combines basic trend calculations, smoothing, and tactical trading crosses.
Remember to setup variables:
period=20
trade=8
Key points:
- Detection Period: Uses a defined period (p=20 for Dax40) to identify the highest (alt) and lowest (baj) prices within that range.
- Basic Trend Calculation: The variable Ten computes the basic trend as a percentage of the current close relative to the high and low, multiplied by -100.
- Smoothed Trend: Applies an exponential moving average (exponentialaverage) to Ten to obtain a smoothed trend (Trend).
- Tactical Trading Cross: Calculates a cross (cross) using another exponential moving average on Trend, useful for trading signals.
- Visual Histogram: The difference between Trend and cross generates a histogram (hist) indicating trend strength and direction.
- Histogram Colors:
- Strong uptrend (hist > 0): Green (0,100,0).
- Strong downtrend (hist < 0): Red (255,0,0).
- Intense uptrend (Trend > -50, hist > 0, increasing hist): Blue (0,0,255).
- Weak uptrend (Trend < -50, hist > 0, increasing hist): Light green (124,252,0).
- Less intense downtrend (Trend < -50, hist < 0, increasing hist): Yellow (255,255,0).
- Weak downtrend (Trend > -50, hist < 0, increasing hist): Brown (184,134,11).
- Visualization:
- Lines for Ten (basic trend), Trend (smoothed trend), and cross (tactical cross).
- Colored histogram for hist.
- Dotted line at -50 as an inflection level.
- Recommendation: Uncheck “Trend” and use “smoothed trend” for a better trading experience.
The indicator helps traders identify trend direction and strength, as well as potential entry/exit points based on crosses.
//Delorean Trend Detection Oscilator from DEIAT
//original code from Domenec of www.deinversoratrader.com (DEIAT)
//re-edited code by @mboliart - https://x.com/mboliart
//version: v.1.1 (adapted for DAX40 future)
//date: 17/07/2025
//period=20 for dax40 - original from DEIAT = 10
//trade=8 (must be a correct relation between period or trading plan)

//Detection period for highest and lowest
p=period
//highest point of period
alt=highest[p](high)
//lowest point of period
baj=lowest[p](low)
//basic trend
Ten=((alt-close)/(alt-baj))*-100
//smoothed Trend
Trend=exponentialaverage[p](Ten)
//tactical trading cross
cross=exponentialaverage[trade](Trend)
//vistual hisotgram
hist=(Trend-cross)

//coloured histogram depending of trend
//initial strong up trend
if hist >0 then
r=0
g=100
b=0
//strong down trend
else
r=255
g=0
b=0
endif
//strong up trend
if Trend>-50 and hist>0 and hist>hist[1] then
r=0
g=0
b=255
endif
//not enough strong up trend
if Trend<-50 and hist>0 and hist>hist[1] then
r=124
g=252
b=0
endif
//less strong down trend
if Trend<-50 and hist<0 and hist>hist[1] then
r=255
g=255
b=0
endif
//not enoguh down trend
if Trend>-50 and hist<0 and hist>hist[1] then
r=184
g=134
b=11
endif


return Ten as "Trend" style(line,2), Trend as "smoothed Trend" style(line,2), cross as "trading cross" style(line,1) coloured(255,0,0), hist as "histogram" coloured(r,g,b,150) style(histogram,1), -50 as "inflection" coloured(0,0,150,100) style(dottedline,2)
Download
Filename:
Delorean-Trend-Detection-v1.1.itf
Downloads:
160
New
Scalp trader since 2006
Author’s Profile
Loading...