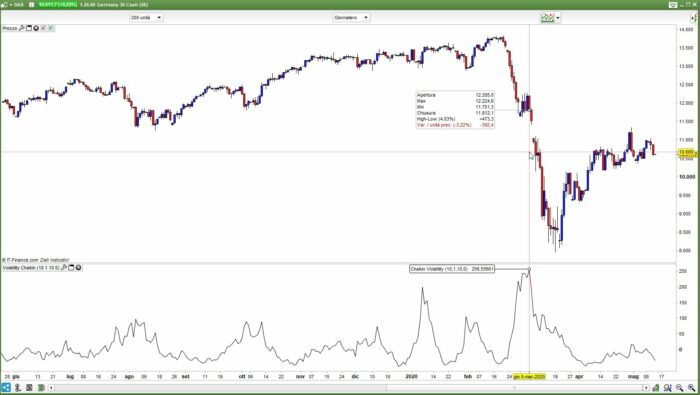
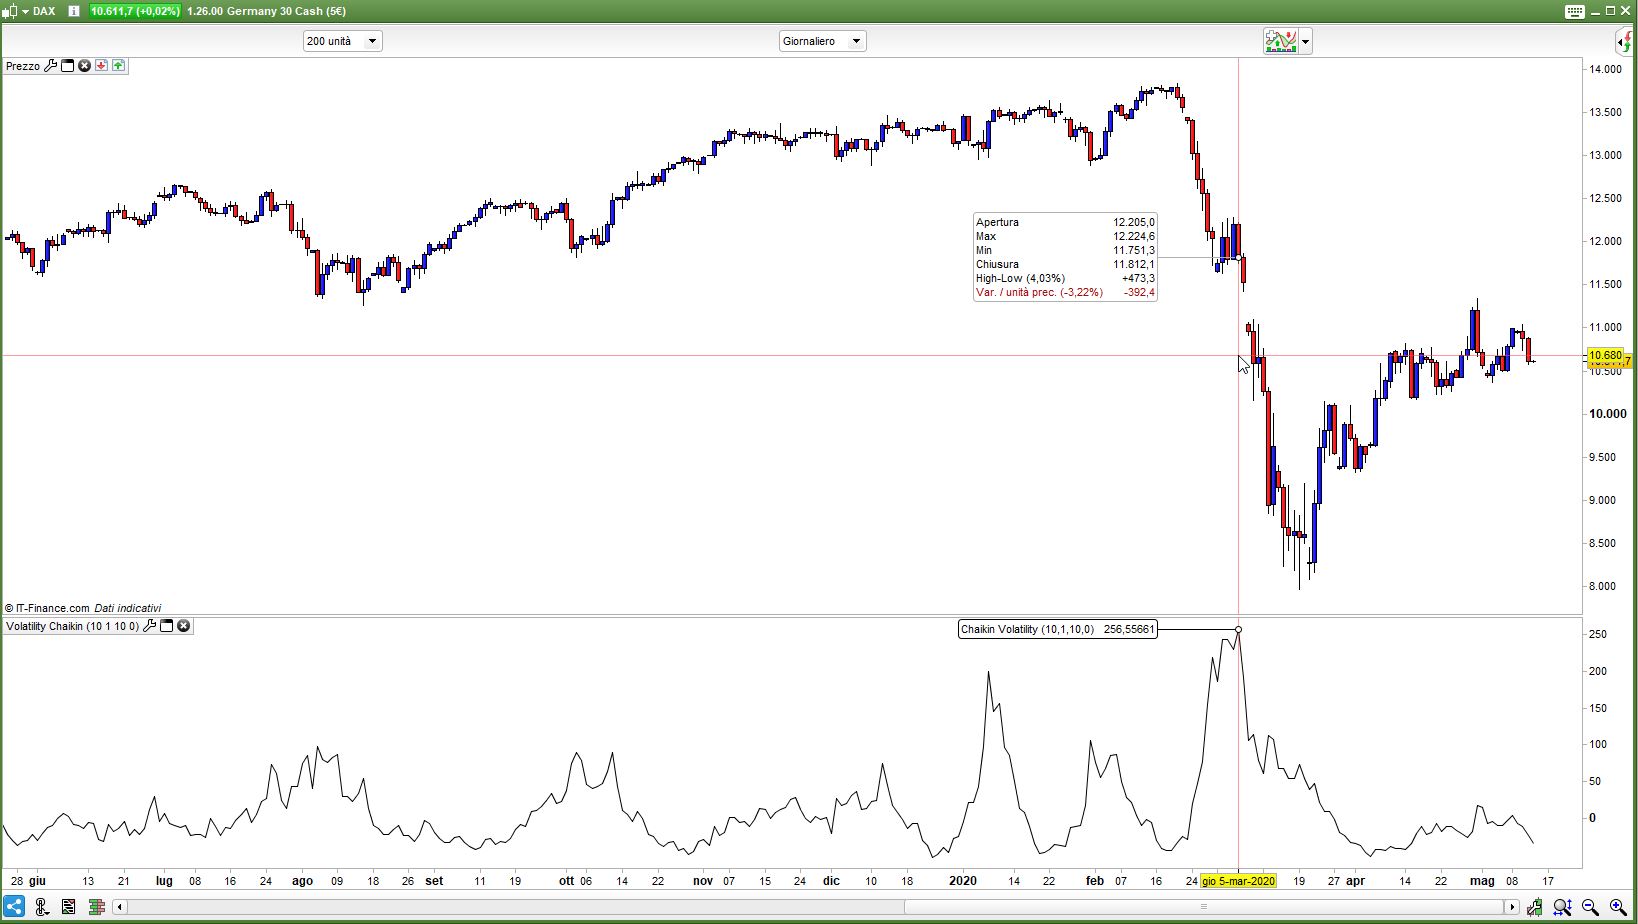
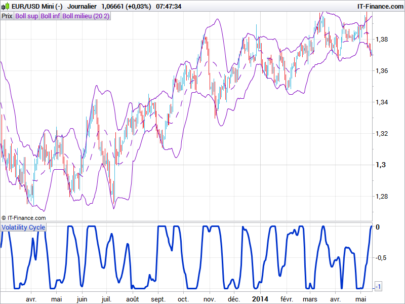
Developed by Marc Chaikin, the Chaikin volatility indicator depicts volatility by calculating the difference between the high and low for each period or trading bar. It measures the difference between two moving averages of a volume-weighted accumulation distribution line.
It therefore differs from the simple Average True Range (ATR) indicator in that it does not account for gaps.
This aspect is good for short-term traders; gaps often occur overnight and can cause peaks in volatility to be downplayed.
The Chaikin indicator, however, shows precisely when the market starts to move. It’s default settings are left at 10,10.
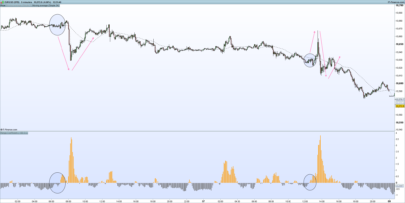
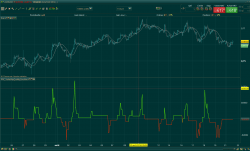
The Chaikin in action
The great thing about the Chaikin indicator is that it often peaks at around the same time every single day. This means that is the perfect tool for helping to time your trades.
|
1 2 3 4 5 6 7 8 9 10 11 12 13 14 15 16 17 18 19 |
// Chaikin Volatility // // https://www.investopedia.com/terms/c/chaikinoscillator.asp // https://www.incrediblecharts.com/indicators/chaikin_volatility.php // DEFPARAM CalculateOnLastBars = 1000 Periods = 10 AvgT = 1 Periods2 = 10 AvgT2 = 0 Periods = max(1,min(999,Periods)) AvgT = max(0,min(6,AvgT)) Periods2 = max(1,min(999,Periods2)) AvgT2 = max(0,min(6,AvgT2)) HImenoLO = high - low x1 = average[Periods,AvgT](HImenoLO) x2 = average[Periods2,AvgT2](HImenoLO[Periods2]) VolatChaikin = ((x1 - x2) / x2) * 100 RETURN VolatChaikin AS "Chaikin Volatility" |
Share this
No information on this site is investment advice or a solicitation to buy or sell any financial instrument. Past performance is not indicative of future results. Trading may expose you to risk of loss greater than your deposits and is only suitable for experienced investors who have sufficient financial means to bear such risk.
ProRealTime ITF files and other attachments :
Find other exclusive trading pro-tools on ![]()
PRC is also on YouTube, subscribe to our channel for exclusive content and tutorials


One question, Roberto: the two AvgT are variable, could you explain to me what they regulate in the indicator? Thanks
AvgT stands for Average Type, it’s a parameter for the AVERAGE keyword (https://www.prorealcode.com/documentation/average/). It allows to use the same keyword for the many available types of MA, without having to use their specific name, such as ExponentialAverage, WeightedAverage, etc…
I added it to the indicator so that it can be changed easily, if interested. Actually the formula of the indicator does use EXPONENTIAL moving averages only!