
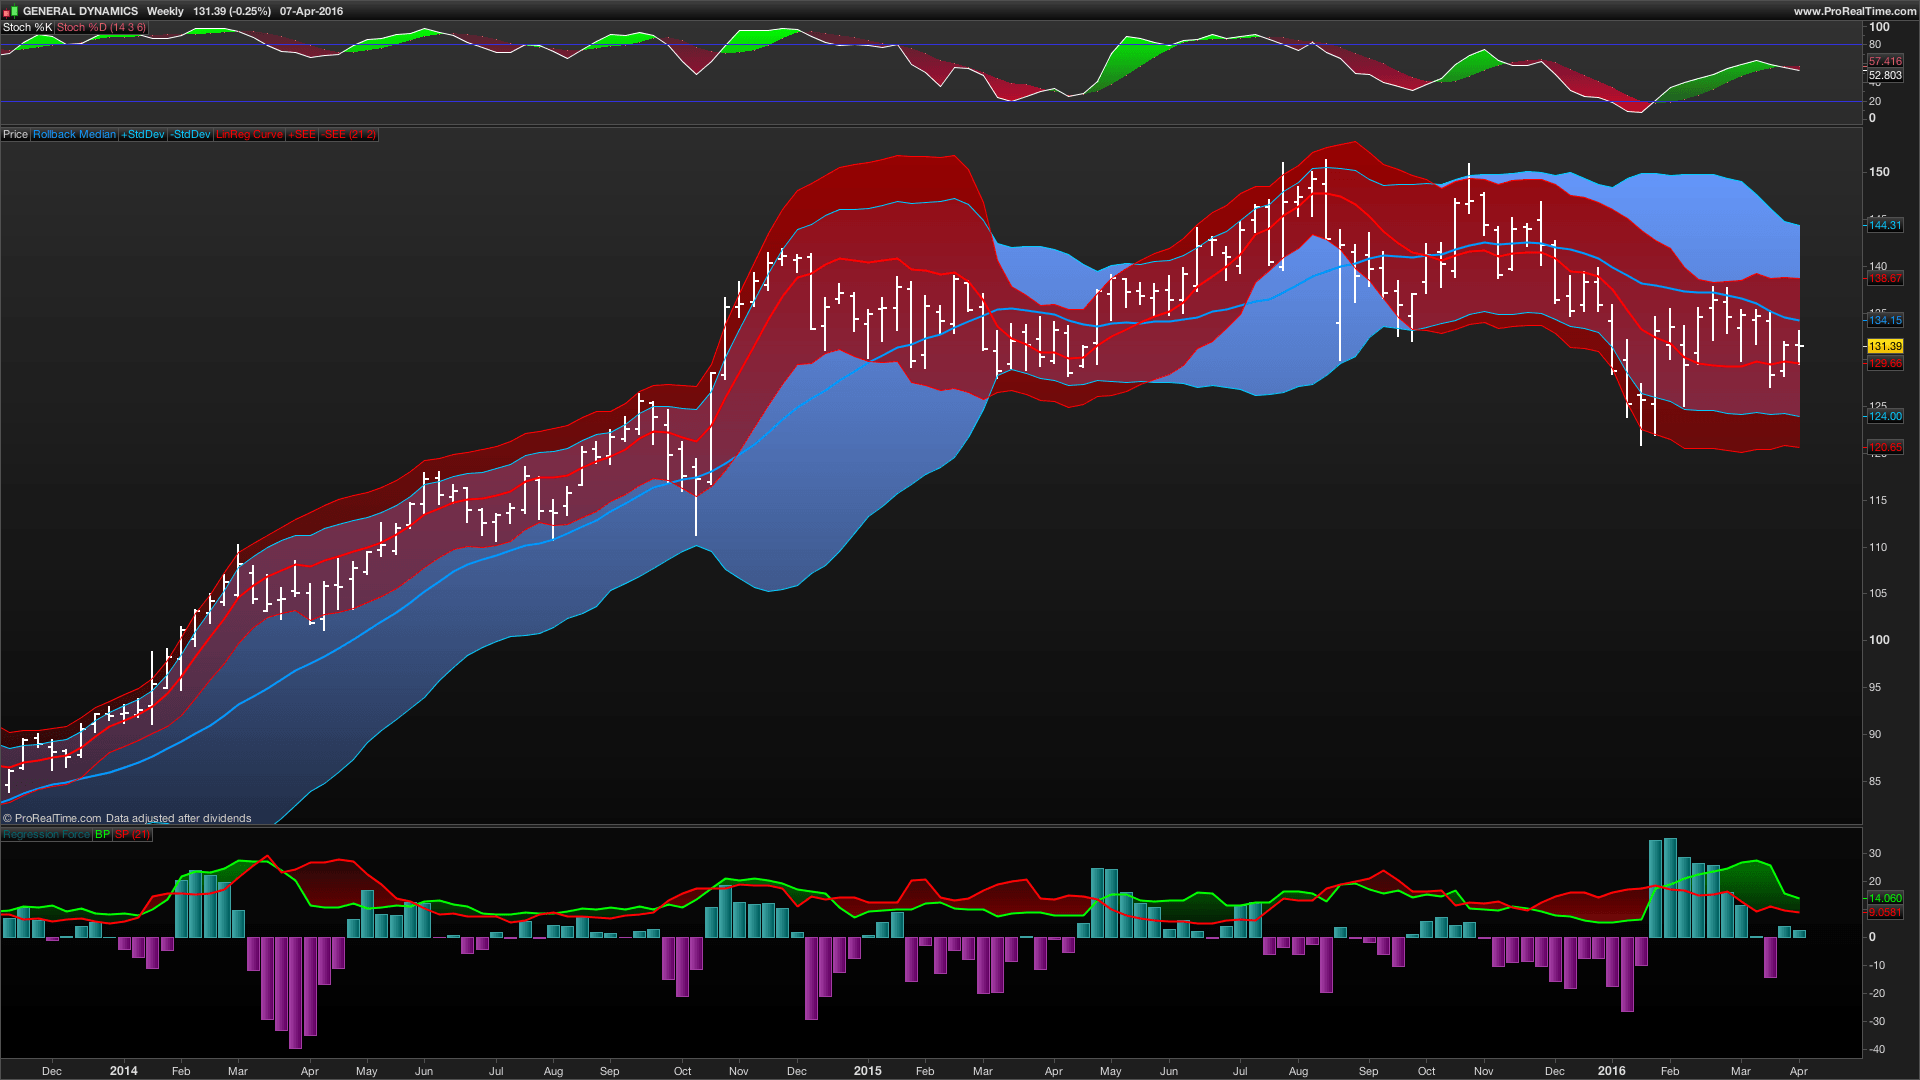
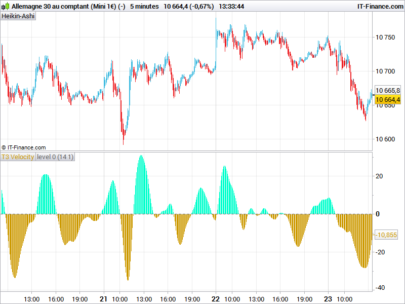
BUY & SELL PRESSURE Oscillator
Ver. 1.0 XelMod
WHAT’S THIS?
This is my first revision for ProBuilder of the original implementation for AmiBroker by Karthik Marar’s of it’s BUY AND SELL PRESSURE INDICATORS but this time, with an aditional REGRESSIVE ANALYSIS algorithm based in Rate Of Change (A kind of Slope but measured in % Performance).
The intention is to plot as Histogram the Force correlation of Buying Vs Selling Pressure geometrically weighted at each candle by Rate of Change method, wich gives a very fast reading of the trend and as a laggy confirmator instance, the oscillator lines given the same reading but based just in a Simple Averaging Approach (Karthik Marar’s original method).
This is an excelent momentum indicator very similar to ADX but in a candle weighting distribution rather than ranges.
For additional reference:
http://karthikmarar.blogspot.mx/2015/05/buy-and-sell-pressure-indicators.html
Cheers!
Any feedback will be welcome…
@XeL_Arjona
THE CODE:
P = 21
|
1 2 3 4 5 6 7 8 9 10 11 12 13 14 15 16 17 18 19 20 21 22 23 24 25 26 27 28 29 30 31 32 |
// Fixed Variables Cl = close Hi = high Lo = low Vo = volume IF Vo = 0 THEN Vo = 1 ENDIF Hm = max(Hi,Cl[1]) Lm = min(Lo,Cl[1]) // XeL Rate Of Change MoD (Regressional) SProc = abs((Hm-Cl)/Hm) BProc = abs((Cl-Lm)/Lm) SPprc = Hm-Cl BPprc = Cl-Lm BPa = Average[P](BProc) BPap = Average[P](BPprc) SPa = Average[P](SProc) SPap = Average[P](SPprc) BPn = (BProc/BPa)*12 SPn = (SProc/SPa)*12 BPnp = (BPprc/BPap)*12 SPnp = (SPprc/SPap)*12 Va = Average[55](Vo) Vn = Vo/Va BPo = linearregression[9](BPn * Vn) SPo = linearregression[9](SPn * Vn) nbf = Average[9](BPnp * Vn) nsf = Average[9](SPnp * Vn) lrBPh = (BPo - SPo) // PLOT DIRECTIVES RETURN lrBPh AS "Regression Force" , nbf COLOURED(0,255,0) AS "BP", nsf COLOURED(255,0,0) AS "SP" |
Share this
No information on this site is investment advice or a solicitation to buy or sell any financial instrument. Past performance is not indicative of future results. Trading may expose you to risk of loss greater than your deposits and is only suitable for experienced investors who have sufficient financial means to bear such risk.
ProRealTime ITF files and other attachments :
Find other exclusive trading pro-tools on ![]()
PRC is also on YouTube, subscribe to our channel for exclusive content and tutorials


Hi and Thanks,
How can you use it ?
Zilliq
Aa a regular momentum indicator. It’s very similar in it’s construction as the ADX. The histogram is based on a Linear Regression against the pressure weighted within the candles and the shaded lines use Simple Rolling Average, so the histogram tends to catch Faster changes in trend and the lines makes a great confirmation to the move. It is important to note that “Buyers Vs Sellers” for this indicator is much more a statistical measure rather than a real one (like many other indicators involving volume like Positive/Negative Volume Index). If you with to have a real Buy & Sell reading, you must have tick intraday level reading’s in favor to “count” accumulation/distribution from from real Level II market depth.
By the way, it is another fine contribution from a nice and devoted coder for the community. Many thanks xel! 🙂
Hi Xel and thanks,
do you know if there is a way in PRC of reading/counting intraday ticks? The best I could do is to build the below indicator to be applied to an (x)ticks chart. This way I can see when the number of ticks in a certain amount of time have exceeded a defined threshold (say 15 mins as in the code below). However this indicator lacks a fundamental information: direction. Any way that I can read Up and DOWN ticks from the “tick by tick” list?
tick = 0
if (time - time[1]) <= 1500 then
TICK = 1
endif
return TICK
Thanks a lot Nicolas!
Always kind words and attention from you!
Cheers!
Can’t make it work, says: “Define p variable”
ive just discovered this, i must say very nice thanks.