

Bill Williams Profitunity
Another method of studying Price and Volume by Bill Williams Profitunity
The Bill Williams Profitunity provides a unique way of quantifying price movement relative to volume. At the heart of it is the Market Facilatation Index (MFI). The MFI is the bar’s range (high – low) divided by the volume. Using the MFI, each bar has a mathematical relationship of the price activity versus the volume. In essence, the MFI is a measurement of market efficiency, tracking how much movement has occurred in price relative to volume. By comparing the MFI for the current bar to the previous bar’s, you can gauge the current bar’s ability to facilitate price to the previous bar’s ability. The Bill Williams Profitunity can be used on any period from daily bars to monthly bars.
The MFI as a stand-alone indicator has little value. However, by comparing the current bar’s MFI and volume with the previous bar’s MFI and volume, a very tradable system emerges.
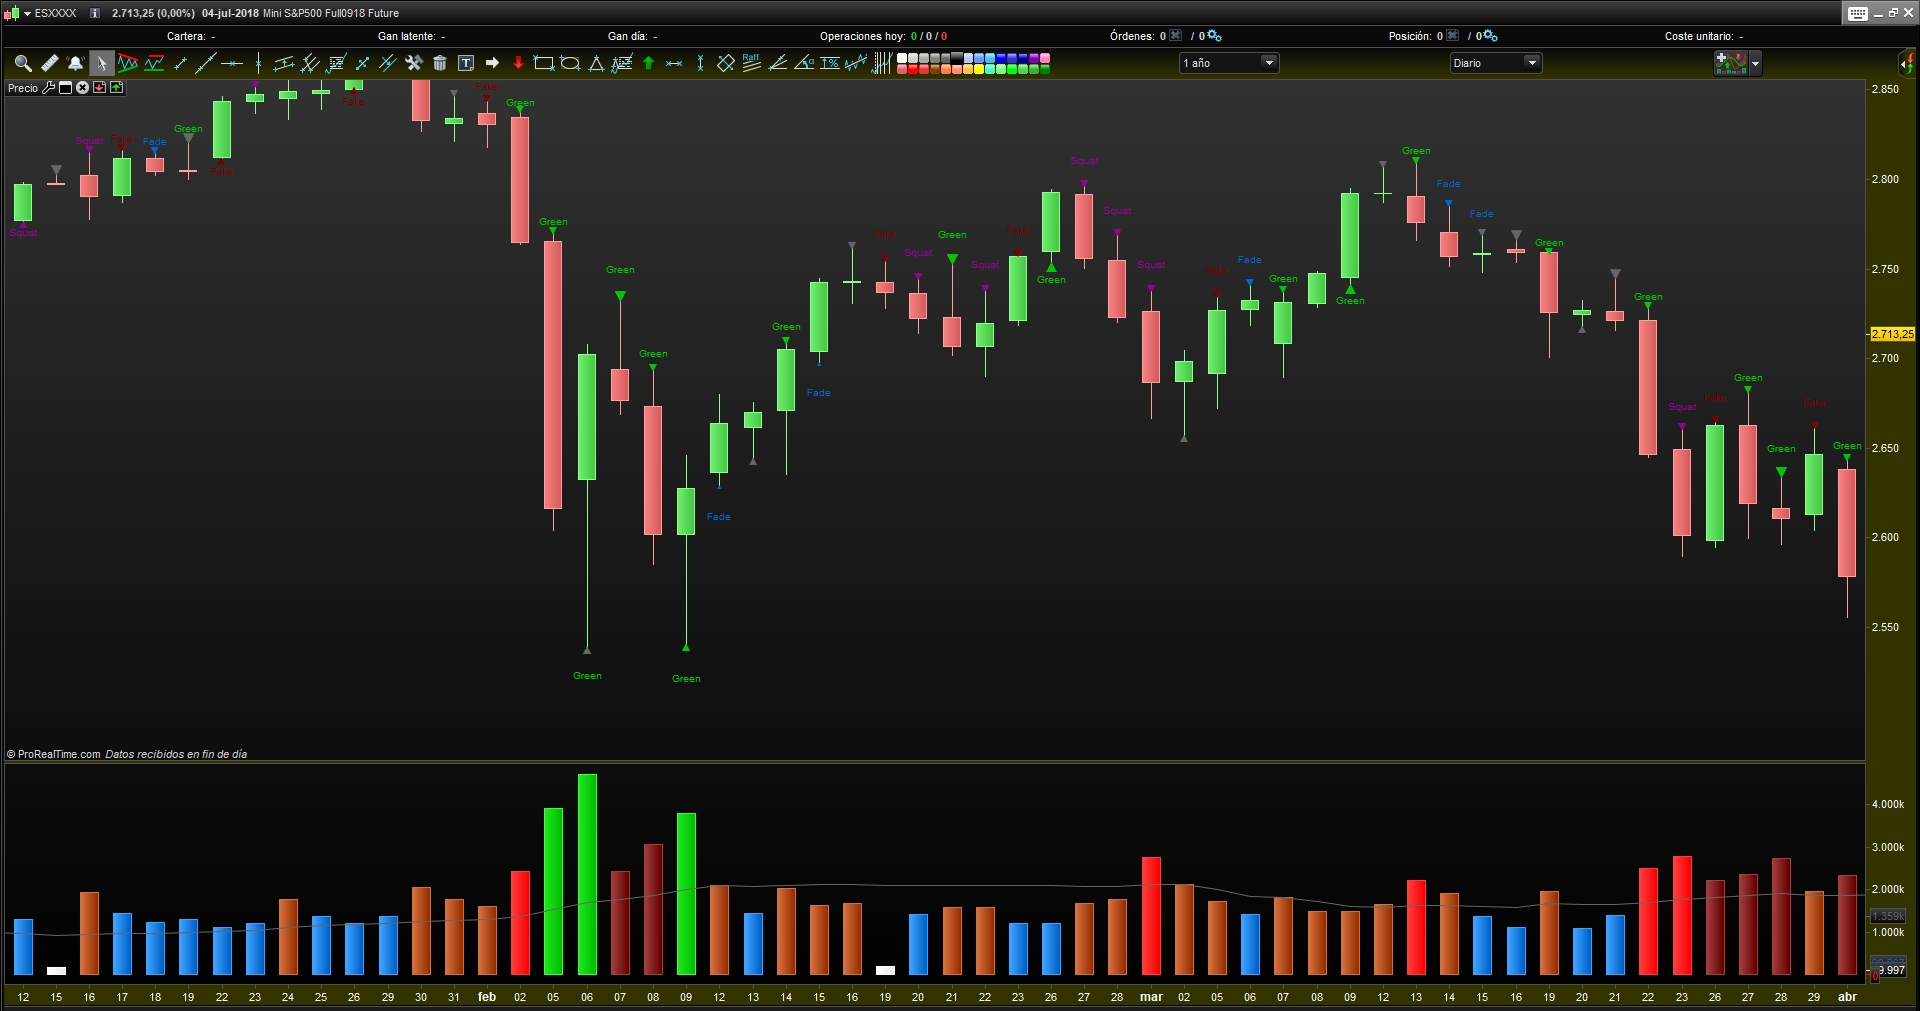
Williams defines the four possible combinations of MFI and volume as follows. A plus sign means the current bar’s value is greater than the previous bar’s value. A minus sign means the current bar’s value is less than the previous bar’s value.
Volume MFI Label:
- Green //Green
- Fade //Blue
- Fake //Red
- Squat //Violet
Green. This bar shows an increase in volume and the MFI relative to the previous bar. Hence, there is price movement, and the MFI is larger for this bar than that for the previous bar. Further, more players are entering the market as signaled by the increase in volume. This activity in the futures market means that off-floor traders are very active. In addition, the price action is directional–that is, the market is moving in one direction due to the involvement of new traders putting on new positions. This is the kind of day that you would already want to have a trade on in the same direction.
Fade. This bar shows a decrease in volume and the MFI relative to the previous bar. The market has slowed and there is a minor amount of activity as indicated by the low volume. This type of day is called a fade, as the traders’ interest in the market by this point is fading. Often, this sort of day happens at the end of a trend. The market has simply reached a point where nobody is willing to establish any new positions. At this point the market appears to be suffering from a certain amount of boredom. Keep in mind, however, that out of this market condition, a new trend could emerge.
Fake. This bar shows a decrease in volume but an increase in the MFI. This condition means that the market is moving more relative to the previous bar (the greater MFI), but the lack of volume is evidence that there is no new participation. The price action may be driven by just the traders in the pit and is not attracting new players from the outside. Williams has an hypothesis, that the traders in the pit may be just strong enough to push the market to price levels where there are many stop orders resting in the hands of the brokers, hence faking out the off-floor traders.
Squat. This bar shows an increase in volume relative to the previous bar, but the MFI is lower. The increase in volume indicates heavy activity, but the decrease in the MFI indicates that the market is unable to make any real headway. Volume increased, the trend has stalled and the price movement has stopped. This price action usually, but not always occurs prior to an important move in the opposite direction. This type of bar is called a squat bar because the market appears to be squatting prior to a breakout. Often, the breakout of such a bar will indicate whether this squat is a trend reversal squat or a trend continuation squat.
///////////////////////////////////////////////////////////////////////////////

atr = averagetruerange[10](close)*0.5
Vol=volume
linea=4
Lineb=0.0001

smavol = average[500](vol)
stdvol =std[500](vol)
sma = average[50](vol)

If stdvol > linea then
 av=(smavol +linea*stdvol)
else
 av=0
endif

if stdvol> lineb then
 bv=(smavol +lineb*stdvol)
else
 bv=0
endif

MFI0 = (high - low) / volume
MFI1 = (high[1] - low[1]) / volume[1]

MFIplus = MFI0 > MFI1
MFIminus = MFI0 < MFI1

meanplus = (high + low) /2 > high[1]
meanminus = (high + low) /2 < high[1]

volplus = volume > volume[1]
volminus = volume < volume[1]

b13 = open < (high + low) /2 and close > (high + low) /2 and close > open
b31 = open > (high + low) /2 and close < (high + low) /2 and close < open

a0 = open > (high + low) /2 and close > (high + low) /2 and close > open
if a0 then
 DrawText("▴",barindex,low,SansSerif,Standard,20)coloured(102,102,102)
endif

b0= open < (high + low) /2 and close < (high + low) /2 and close > open
if b0 then
 DrawText("▾",barindex,high,SansSerif,Standard,20)coloured(102,102,102)
endif

c0 = open < (high + low) /2 and close < (high + low) /2 and close < open
if c0 then
 DrawText("▾",barindex,high,SansSerif,Standard,30)coloured(102,102,102)
endif

d0 = open > (high + low) /2 and close > (high + low) /2 and close < open
if d0 then
 DrawText("▾",barindex,high,SansSerif,Standard,30)coloured(102,102,102)
endif

//////////////////////////////////////////////////////////////////////////////////////////////////////////////

a0 = open > (high + low) /2 and close > (high + low) /2 and close > open and vol > av[1]
if a0 then
 DrawText("▴",barindex,low,SansSerif,Standard,20)coloured(0,200,0)
 DrawText("Green",barindex,low-atr/2,SansSerif,Standard,10)coloured(0,200,0)
endif

b0= open < (high + low) /2 and close < (high + low) /2 and close > open and vol < bv[1]
if b0 then
 DrawText("▾",barindex,high,SansSerif,Standard,20)coloured(0,102,204)
 DrawText("Fade",barindex,High+atr/2,SansSerif,Standard,10)coloured(0,102,204)
endif

c0 = open < (high + low) /2 and close < (high + low) /2 and close < open and vol > sma[1]
if c0 then
 DrawText("▾",barindex,high,SansSerif,Standard,30)coloured(0,200,0)
 DrawText("Green",barindex,high+atr/2,SansSerif,Standard,10)coloured(0,200,0)
endif

d0 = open > (high + low) /2 and close > (high + low) /2 and close < open and vol > sma[1]
if d0 then
 DrawText("▾",barindex,high,SansSerif,Standard,30)coloured(153,0,153)
 DrawText("Squat",barindex,high+atr/2,SansSerif,Standard,10)coloured(153,0,153)
endif

a= meanplus and b13 and volplus and MFIplus
if a then
 DrawText("▴",barindex,low,SansSerif,Standard,30)coloured(0,200,0)
 DrawText("Green",barindex,low-atr/4,SansSerif,Standard,10)coloured(0,200,0)
endif

b = meanplus and b13 and volminus and MFIminus
if b then
 DrawText("▴",barindex,low,SansSerif,Standard,10)coloured(0,102,204)
 DrawText("Fade",barindex,low-atr/2,SansSerif,Standard,10)coloured(0,102,204)
endif

c = meanplus and b13 and volminus and MFIplus
if c then
 DrawText("▴",barindex,low,SansSerif,Standard,20)coloured(128,0,0)
 DrawText("Fake",barindex,low-atr/2,SansSerif,Standard,10)coloured(128,0,0)
endif

d = meanplus and b13 and volplus and MFIminus
if d then
 DrawText("▴",barindex,low,SansSerif,Standard,20)coloured(153,0,153)
 DrawText("Squat",barindex,low-atr/2,SansSerif,Standard,10)coloured(153,0,153)
endif

e = meanminus and b13 and volplus and MFIplus
if e then
 DrawText("▾",barindex,high,SansSerif,Standard,20)coloured(0,200,0)
 DrawText("Green",barindex,high+atr/4,SansSerif,Standard,10)coloured(0,200,0)
endif

f = meanminus and b13 and volminus and MFIminus
if f then
 DrawText("▾",barindex,high,SansSerif,Standard,20)coloured(0,102,204) //blue
 DrawText("Fade",barindex,high+atr/2,SansSerif,Standard,10)coloured(0,102,204)
endif

g = meanminus and b13 and volminus and MFIplus
if g then
 DrawText("▾",barindex,high,SansSerif,Standard,20)coloured(128,0,0)
 DrawText("Fake",barindex,high+atr/2,SansSerif,Standard,10)coloured(128,0,0)
endif

j = meanminus and b13 and volplus and MFIminus
if j then
 DrawText("▾",barindex,high,SansSerif,Standard,20)coloured(153,0,153)
 DrawText("Squat",barindex,high+atr/2,SansSerif,Standard,10)coloured(153,0,153)
endif

i = meanplus and b31 and volplus and MFIplus
if i then
 DrawText("▴",barindex,low,SansSerif,Standard,20)coloured(0,200,0)
 DrawText("Green",barindex,low-atr/4,SansSerif,Standard,10)coloured(0,200,0)
endif

o = meanplus and b31 and volminus and MFIminus
if o then
 DrawText("▴",barindex,low,SansSerif,Standard,20)coloured(0,102,204)//blue
 DrawText("Fade",barindex,low-atr/2,SansSerif,Standard,10)coloured(0,102,204)
endif

t = meanplus and b31 and volminus and MFIplus
if t then
 DrawText("▴",barindex,low,SansSerif,Standard,20)coloured(128,0,0)
 DrawText("Fake",barindex,low-atr/2,SansSerif,Standard,10)coloured(128,0,0)
endif

aa = meanplus and b31 and volplus and MFIminus
if aa then
 DrawText("▴",barindex,low,SansSerif,Standard,20)coloured(153,0,153)
 DrawText("Squat",barindex,low-atr/2,SansSerif,Standard,10)coloured(153,0,153)
endif

bb = meanminus and b31 and volplus and MFIplus
if bb then
 DrawText("▾",barindex,high,SansSerif,Standard,20)coloured(0,200,0)
 DrawText("Green",barindex,high+atr/4,SansSerif,Standard,10)coloured(0,200,0)
endif

cc = meanminus and b31 and volminus and MFIminus
if cc then
 DrawText("▾",barindex,high,SansSerif,Standard,20)coloured(0,102,204) //blue
 DrawText("Fade",barindex,high+atr/2,SansSerif,Standard,10)coloured(0,102,204)
endif

dd = meanminus and b31 and volminus and MFIplus
if dd then
 DrawText("▾",barindex,high,SansSerif,Standard,20)coloured(128,0,0)
 DrawText("Fake",barindex,high+atr/2,SansSerif,Standard,10)coloured(128,0,0)
endif

ee = meanminus and b31 and volplus and MFIminus
if ee then
 DrawText("▾",barindex,high,SansSerif,Standard,20)coloured(153,0,153)
 DrawText("Squat",barindex,high+atr/2,SansSerif,Standard,10)coloured(153,0,153)
endif

drawcandle(open,high,low,close)

return