Ultimate Opening Range Breakout
The opening range is the oldest idea in intraday trading: whatever the market does in the first minutes of the session tends to define the boundaries of the day. Break above the high and the day is bullish, break below the low and it is bearish. Simple, and repeated in a thousand variations.
The problem with every simple version is that it never tells you how often it actually works on the instrument in front of you. You get a box and two lines, and you are on your own.
The Ultimate Opening Range Breakout by LuxAlgo answers that question while it draws. It builds the opening range, projects three profit targets on each side, and then keeps score: for every session in the chart history it records whether price reached each target, and prints the resulting hit rate next to the level itself. A target that reads 15% is not a target, and now you can see that before you place the order.
On top of that it shows where the volume actually traded inside the opening range, and it can run a small trailing stop study that tells you which ATR distance would have kept the most profit on the table.
Theory Behind the Indicator
The opening range
During a user-defined time window, the indicator tracks the highest high and the lowest low. The window is set in the chart timezone, so you enter the hours your broker shows you. The default is a thirty minute window, but a five minute or a full-hour range works exactly the same way.
You can build the range from the session high and low, which is the usual choice, or from the candle bodies only. Bodies ignore the wicks, which produces a tighter range and more frequent breakouts on noisy instruments.
Once the window closes, the range is frozen for the rest of the day:
range = orHigh – orLow
target1 = orHigh + range * mult1 (mirrored below with orLow – range * mult1)
target2 = orHigh + range * mult2
target3 = orHigh + range * mult3
The multipliers can be plain multiples of the range (1x, 2x, 3x by default) or Fibonacci ratios (0.382, 0.618, 1.0). Multiples give you extension targets far from the range, Fibonacci ratios give you nearer, more frequently reached ones. The hit rate readout tells you which of the two is realistic for your instrument.
The hit rate
This is what makes the indicator worth having on the chart. Every completed session increments a session counter. From that moment until the day rolls over, the first time price touches each of the six levels, the corresponding counter increments once, and only once.
hit rate of target N = sessions in which target N was reached / total sessions
The result is printed inside the level label and repeated in a panel in the corner. Twenty sessions of history give you a rough idea, two hundred give you something you can act on.
An important detail: the counters only run inside the plotting window. That matters on instruments that keep trading long after the session you are trading is over. A move that happens six hours after the opening range stopped being relevant is not evidence that the opening range worked, and counting it makes every target look better than it is. On a contract that trades until late in the evening, the difference between counting the whole 24 hours and counting only the session window reaches fifteen percentage points on the nearest target.
The trailing stop and the stop study
When price closes beyond the range, the indicator can arm an ATR trailing stop from the breakout candle and follow the move until it is taken out. It also keeps a running total of what that stop would have produced.
The stop study runs five stops at once on the very same entries, at 1.0x, 1.5x, 2.0x, 2.5x and 3.0x ATR, and reports which of the five ended with the highest cumulative result. It is not a backtest and it is not meant to replace one, but it answers one narrow question quite well: is your stop too tight for this instrument?
Key Features at a Glance
- Opening range from any time window, in the chart timezone, with a per-weekday filter
- Range built from session extremes or from candle bodies
- Three extension targets on each side, as multiples of the range or as Fibonacci ratios
- Historical hit rate per target, printed on the level and in a corner panel
- Volume profile of the opening range with the point of control highlighted
- Breakout marks that distinguish high volume from low volume breaks
- Optional ATR trailing stop with cumulative result
- Optional stop study over five ATR distances
- Plotting window that stops drawing the levels once your trading day is over
- Sunday session merged into Monday, so futures do not build a range on a two hour overnight session
How to Read the Indicator
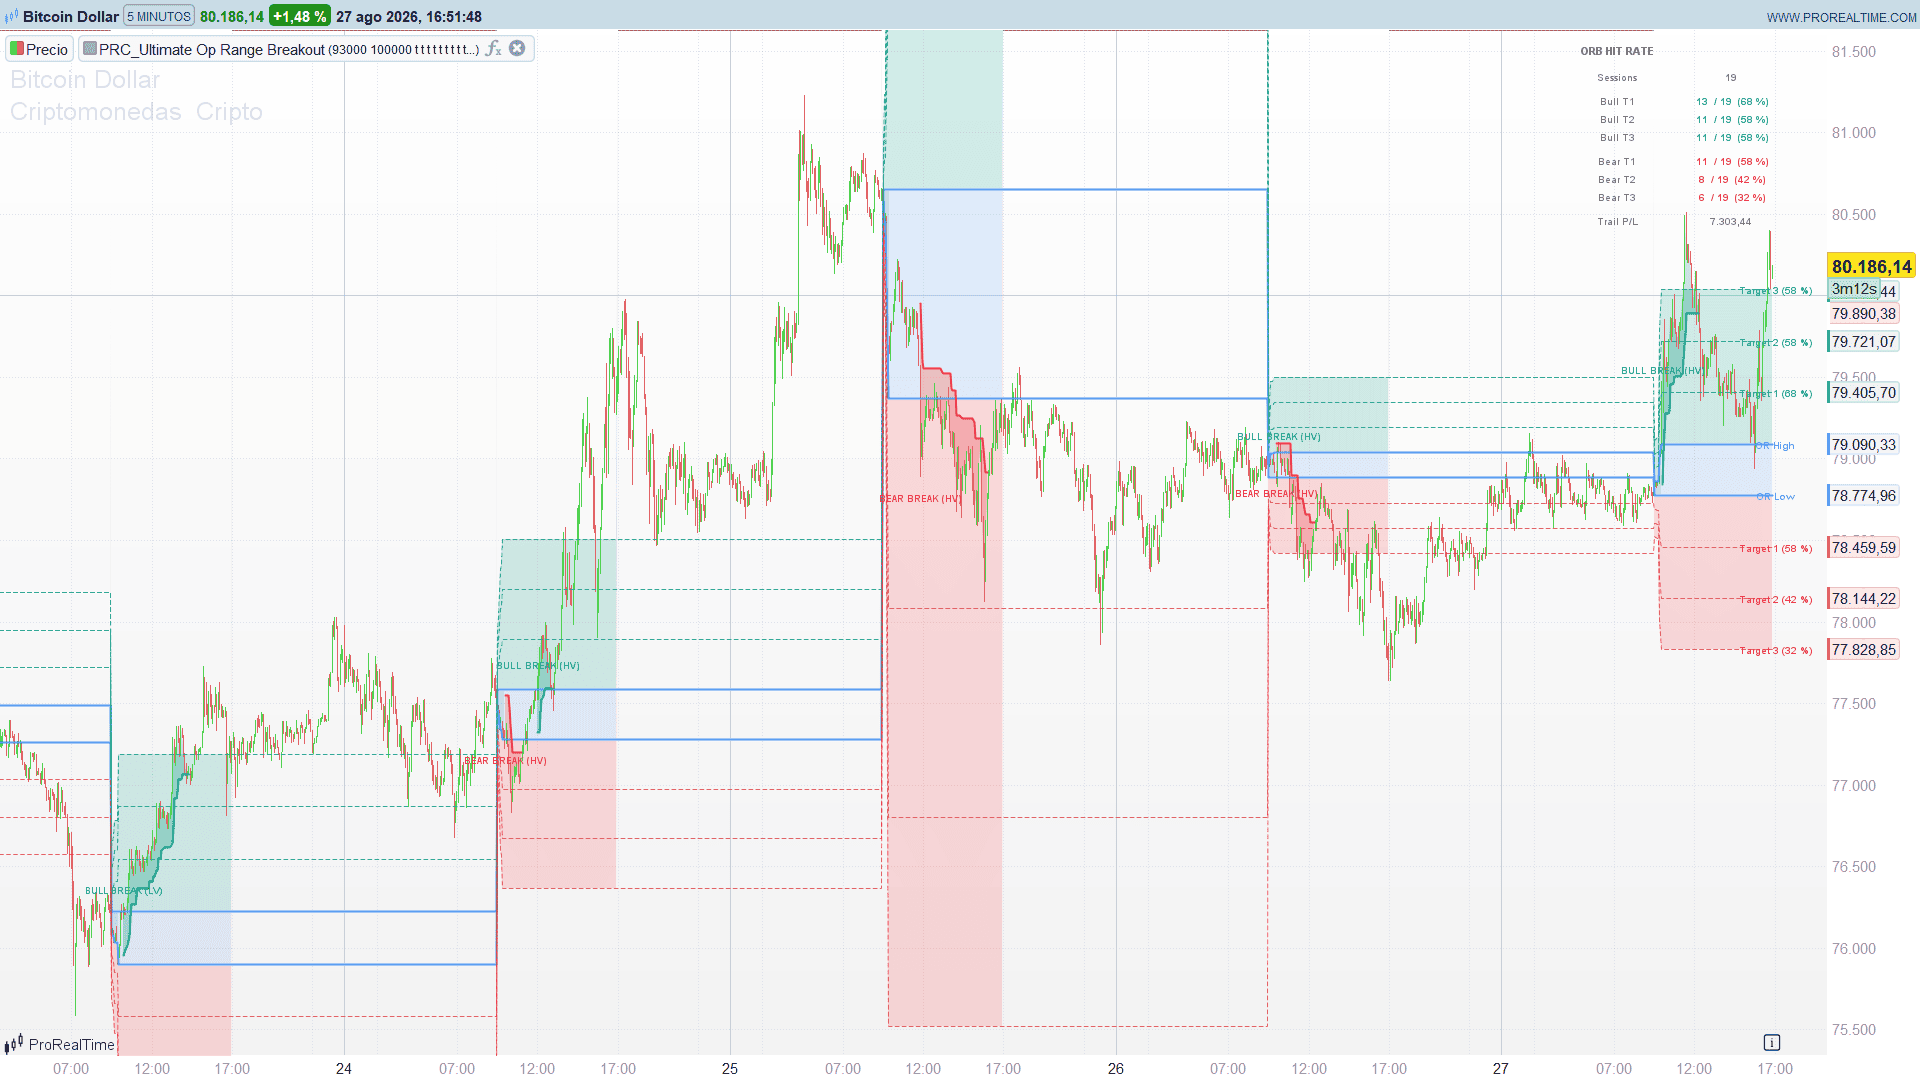
The blue channel is the opening range. Its fill turns slightly more solid while the window is still open, so you can see at a glance which candles built it.
The dotted green lines above and the dotted red lines below are the three targets. The percentage inside each label is the share of past sessions in which that level was reached.
BULL BREAK / BEAR BREAK marks the first close beyond the range each day. Only the first one per side and per day is shown, so a candle that whipsaws in and out of the range does not fill the chart with marks. The suffix tells you the state of volume on the breakout candle relative to its twenty period average: (HV) for high volume, (LV) for low volume. A low volume breakout into a target with a poor hit rate is the classic setup you want to skip.
The histogram to the right of the last candle is the volume profile of the current opening range. The widest block is the point of control.
The corner panel gives the same statistics in a compact form: number of sessions tracked and hits, total and rate for each of the six targets, plus the trailing stop result and the best ATR multiplier when those options are enabled.
Practical Applications
Choosing a realistic profit target. Read the hit rate before you decide where to take profit. If Target 1 fills on 60% of sessions and Target 2 on 20%, the second one is not worth the extra risk on most days.
Filtering the breakout. A break marked (LV) has a lower chance of following through than one marked (HV). Combined with a poor hit rate on the first target, that is a setup to leave alone.
Fading the failed break. When price breaks out and returns inside the range, the point of control of the opening range is the natural first target of the reversal.
Sizing the stop. Enable the stop study for a few weeks on your instrument. If the best result comes from 3.0x ATR, your usual 1.5x is being taken out by noise before the move develops.
Comparing instruments. Load the indicator on several instruments with the same settings and compare the hit rates. Some instruments respect the opening range and some ignore it entirely, and that shows up immediately in the panel.
Indicator Configuration
Opening range session:
- orStart (default 093000): opening range start, HHMMSS, chart timezone
- orEnd (default 100000): opening range end, HHMMSS, exclusive
- srcHighLow (default 1): 1 uses the session high and low, 0 uses the candle bodies
- fuseSunday (default 1): merges the Sunday session into Monday, for futures
Days of week:
- useSun, useMon, useTue, useWed, useThu, useFri, useSat (default 1 each): days on which the opening range is built
Extension levels:
- showExt (default 1): plot the three extension levels on each side
- extMode (default 0): 0 for multiples of the range, 1 for Fibonacci 0.382 / 0.618 / 1.0
- mult1, mult2, mult3 (defaults 1.0, 2.0, 3.0): the three multipliers
Plotting window:
- limitPlot (default 1): stop drawing the levels after plotEnd
- plotEnd (default 170000): end of the plotting window, HHMMSS. Windows that cross midnight are supported, just set an end time earlier than the start
- statsWinOnly (default 1): count target hits only inside the plotting window
Style:
- showLabels (default 1): level labels with the historical hit rate
- bullR, bullG, bullB (defaults 8, 153, 129): bullish colour
- bearR, bearG, bearB (defaults 242, 54, 69): bearish colour
- neuR, neuG, neuB (defaults 91, 156, 246): range colour
- fillAlpha (default 45): zone opacity, 0 invisible and 255 opaque
- labelSize (default 10): font size of the level labels
Volume profile:
- showVP (default 1): draw the profile of the opening range
- vpRows (default 14): number of blocks the range is split into
- vpMaxBars (default 15): width in bars of the longest block
- vpOffset (default 25): bars to the right of the last candle
- vpR, vpG, vpB (defaults 91, 156, 246): profile colour
- maxSB (default 400): cap of opening range candles stored for the profile
Trailing stop:
- showTrail (default 0): arm the ATR trailing stop on the breakout
- trailMult (default 2.0): ATR multiplier
- trailAtrLen (default 14): ATR length
Dashboard:
- showDash (default 1): show the hit rate panel
- showOpt (default 0): run the stop study over five ATR multipliers
- dashX (default -300): panel label column, pixels from the right border
- dashY (default -20): panel top row, pixels from the top border
- dashCol (default 115): pixel gap between the label and the value column
- dashR, dashG, dashB (defaults 219, 219, 219): panel text colour
- maxMk (default 60): breakout marks kept on the chart
Notes on Use
The indicator only works on intraday timeframes. On daily charts and above a single candle covers the whole day, so there is no opening range to build, and the indicator prints a message instead of drawing nothing.
Choose the timeframe according to the length of your window. A thirty minute opening range on five minute candles is six candles, which is enough resolution for the volume profile. The same window on thirty minute candles is one candle, and the profile becomes meaningless.
Code
//--------------------------------------------
// PRC_Ultimate Opening Range Breakout (by LuxAlgo)
// version = 0
// 26.08.2026
// Ivan Gonzalez @ www.prorealcode.com
// Sharing ProRealTime knowledge
//--------------------------------------------
// Opening range + extension targets + breakout marks + session volume profile
// + hit rate dashboard + ATR trailing stop with a 5 multiplier optimizer.
// Intraday timeframes only: the opening range needs bars inside the day.
//--------------------------------------------

DEFPARAM drawonlastbaronly = true

//=== OPENING RANGE SESSION =========================================
orStart      = 093000    // opening range start, HHMMSS, chart timezone
orEnd        = 100000    // opening range end, HHMMSS, exclusive
srcHighLow   = 1         // 1 = session high/low, 0 = candle bodies (open/close)
fuseSunday   = 1         // 1 = merge the Sunday session into Monday (futures)

//=== DAYS OF WEEK ==================================================
useSun = 1
useMon = 1
useTue = 1
useWed = 1
useThu = 1
useFri = 1
useSat = 1

//=== EXTENSION LEVELS ==============================================
showExt      = 1         // 1 = plot the three extension levels on each side
extMode      = 0         // 0 = multiples of the range, 1 = Fibonacci 0.382 / 0.618 / 1.0
mult1        = 1.0
mult2        = 2.0
mult3        = 3.0

//=== PLOTTING WINDOW ===============================================
limitPlot    = 1         // 1 = stop drawing the levels after plotEnd
plotEnd      = 170000    // HHMMSS, chart timezone (session close of the instrument)
statsWinOnly = 1         // 1 = only count target hits inside the plotting window

//=== STYLE =========================================================
showLabels   = 1         // 1 = level labels with the historical hit rate
bullR = 8
bullG = 153
bullB = 129
bearR = 242
bearG = 54
bearB = 69
neuR  = 91
neuG  = 156
neuB  = 246
fillAlpha    = 45        // 0 = invisible, 255 = opaque
labelSize    = 10

//=== VOLUME PROFILE ================================================
showVP       = 1
vpRows       = 14        // number of blocks the opening range is split into
vpMaxBars    = 15        // width in bars of the longest block
vpOffset     = 25        // bars to the right of the last candle
vpR = 91
vpG = 156
vpB = 246
maxSB        = 400       // cap of opening range bars stored for the profile

//=== TRAILING STOP =================================================
showTrail    = 0
trailMult    = 2.0
trailAtrLen  = 14

//=== DASHBOARD =====================================================
showDash     = 1
showOpt      = 0         // 1 = simulate 5 ATR multipliers and report the best one
dashX        = -300      // panel label column, pixels from the right border
dashY        = -20       // panel top row, pixels from the top border
dashCol      = 115       // pixel gap between the label and the value column
dashR = 120
dashG = 120
dashB = 120
maxMk        = 60        // breakout marks kept in the ring buffer

//--------------------------------------------
// Derived constants
//--------------------------------------------
IF extMode = 1 THEN
   f1 = 0.382
   f2 = 0.618
   f3 = 1.0
ELSE
   f1 = mult1
   f2 = mult2
   f3 = mult3
ENDIF

tfOk = 0
IF gettimeframe < 86400 THEN
   tfOk = 1
ENDIF

ONCE nSess = 0
ONCE cU1 = 0
ONCE cU2 = 0
ONCE cU3 = 0
ONCE cD1 = 0
ONCE cD2 = 0
ONCE cD3 = 0
ONCE totProfit = 0
ONCE nMk = 0
ONCE orValid = 0
ONCE orHigh = 0
ONCE orLow = 0
ONCE sessDone = 0
ONCE dirActive = 0
ONCE entryPx = 0
ONCE trailLvl = 0
ONCE nSB = 0
ONCE canUp = 1
ONCE canDn = 1
ONCE hitU1 = 0
ONCE hitU2 = 0
ONCE hitU3 = 0
ONCE hitD1 = 0
ONCE hitD2 = 0
ONCE hitD3 = 0

// The five optimizer slots accumulate, so their P/L needs an explicit zero
// (a virgin array slot is only safe to READ inside a guard, not to add to).
IF barindex = 0 THEN
   FOR k = 0 TO 4 DO
      $optP[k]    = 0
      $optAct[k]  = 0
      $optStop[k] = 0
   NEXT
ENDIF

atrTrail = averagetruerange[trailAtrLen](close)
atrRef   = averagetruerange[14](close)
volAvg   = average[20](volume)

//--------------------------------------------
// Day filter and day rollover
//--------------------------------------------
IF dayofweek = 0 THEN
   dayOk = useSun
ELSIF dayofweek = 1 THEN
   dayOk = useMon
ELSIF dayofweek = 2 THEN
   dayOk = useTue
ELSIF dayofweek = 3 THEN
   dayOk = useWed
ELSIF dayofweek = 4 THEN
   dayOk = useThu
ELSIF dayofweek = 5 THEN
   dayOk = useFri
ELSE
   dayOk = useSat
ENDIF

newDay = 0
IF date <> date[1] THEN
   newDay = 1
ENDIF
IF fuseSunday = 1 AND dayofweek[1] = 0 THEN
   newDay = 0
ENDIF

//--------------------------------------------
// Opening range session window
//--------------------------------------------
sessOn = 0
IF tfOk = 1 AND dayOk = 1 AND opentime >= orStart AND opentime < orEnd THEN
   sessOn = 1
ENDIF

sessStart = 0
IF sessOn = 1 AND sessOn[1] = 0 THEN
   sessStart = 1
ENDIF

//--------------------------------------------
// Daily reset
//--------------------------------------------
IF newDay = 1 OR sessStart = 1 THEN
   orValid  = 0
   orHigh   = 0
   orLow    = 0
   sessDone = 0
   hitU1 = 0
   hitU2 = 0
   hitU3 = 0
   hitD1 = 0
   hitD2 = 0
   hitD3 = 0
   nSB   = 0
   canUp = 1
   canDn = 1
   dirActive = 0
   entryPx   = 0
   trailLvl  = 0
   FOR k = 0 TO 4 DO
      $optAct[k]  = 0
      $optStop[k] = 0
   NEXT
ENDIF

//--------------------------------------------
// Opening range tracking
//--------------------------------------------
IF sessOn = 1 THEN
   IF srcHighLow = 1 THEN
      barHi = high
      barLo = low
   ELSE
      barHi = max(open, close)
      barLo = min(open, close)
   ENDIF
   IF orValid = 0 THEN
      orHigh  = barHi
      orLow   = barLo
      orValid = 1
   ELSE
      orHigh = max(orHigh, barHi)
      orLow  = min(orLow, barLo)
   ENDIF
   IF showVP = 1 AND nSB < maxSB THEN
      nSB = nSB + 1
      $sbC[nSB] = close
      $sbV[nSB] = volume
   ENDIF
ENDIF

IF sessOn = 0 AND sessOn[1] = 1 AND orValid = 1 AND sessDone = 0 THEN
   sessDone = 1
   nSess = nSess + 1
ENDIF

//--------------------------------------------
// Levels
//--------------------------------------------
orRange = orHigh - orLow
up1 = orHigh + orRange * f1
up2 = orHigh + orRange * f2
up3 = orHigh + orRange * f3
dn1 = orLow - orRange * f1
dn2 = orLow - orRange * f2
dn3 = orLow - orRange * f3

//--------------------------------------------
// Plotting window
//--------------------------------------------
showLv = 1
IF limitPlot = 1 THEN
   showLv = 0
   IF plotEnd > orStart THEN
      IF opentime >= orStart AND opentime < plotEnd THEN
         showLv = 1
      ENDIF
   ELSE
      IF opentime >= orStart OR opentime < plotEnd THEN
         showLv = 1
      ENDIF
   ENDIF
ENDIF

statsOk = 1
IF statsWinOnly = 1 AND showLv = 0 THEN
   statsOk = 0
ENDIF

//--------------------------------------------
// Target hit statistics, once per session and level
//--------------------------------------------
IF sessDone = 1 AND orValid = 1 AND statsOk = 1 THEN
   IF hitU1 = 0 AND high >= up1 THEN
      cU1 = cU1 + 1
      hitU1 = 1
   ENDIF
   IF hitU2 = 0 AND high >= up2 THEN
      cU2 = cU2 + 1
      hitU2 = 1
   ENDIF
   IF hitU3 = 0 AND high >= up3 THEN
      cU3 = cU3 + 1
      hitU3 = 1
   ENDIF
   IF hitD1 = 0 AND low <= dn1 THEN
      cD1 = cD1 + 1
      hitD1 = 1
   ENDIF
   IF hitD2 = 0 AND low <= dn2 THEN
      cD2 = cD2 + 1
      hitD2 = 1
   ENDIF
   IF hitD3 = 0 AND low <= dn3 THEN
      cD3 = cD3 + 1
      hitD3 = 1
   ENDIF
ENDIF

//--------------------------------------------
// Breakout detection
//--------------------------------------------
xUp = close CROSSES OVER orHigh
xDn = close CROSSES UNDER orLow

isHV = 0
IF volume > volAvg THEN
   isHV = 1
ENDIF

brkUp = 0
IF sessDone = 1 AND sessOn = 0 AND orValid = 1 AND canUp = 1 AND showLv = 1 AND xUp THEN
   brkUp = 1
   canUp = 0
ENDIF

brkDn = 0
IF sessDone = 1 AND sessOn = 0 AND orValid = 1 AND canDn = 1 AND showLv = 1 AND xDn THEN
   brkDn = 1
   canDn = 0
ENDIF

//--------------------------------------------
// Ring buffer of breakout marks
//--------------------------------------------
IF brkUp = 1 OR brkDn = 1 THEN
   WHILE nMk >= maxMk DO
      FOR i = 1 TO nMk - 1 DO
         $mkX[i] = $mkX[i+1]
         $mkY[i] = $mkY[i+1]
         $mkD[i] = $mkD[i+1]
         $mkH[i] = $mkH[i+1]
      NEXT
      nMk = nMk - 1
   WEND
   nMk = nMk + 1
   $mkH[nMk] = isHV
   $mkX[nMk] = barindex
   IF brkUp = 1 THEN
      $mkY[nMk] = high + 0.7 * atrRef
      $mkD[nMk] = 1
   ELSE
      $mkY[nMk] = low - 0.7 * atrRef
      $mkD[nMk] = 0
   ENDIF
ENDIF

//--------------------------------------------
// ATR trailing stop
//--------------------------------------------
IF brkUp = 1 AND dirActive = 0 THEN
   dirActive = 1
   entryPx   = orHigh
   trailLvl  = low - atrTrail * trailMult
   IF showOpt = 1 THEN
      FOR k = 0 TO 4 DO
         $optAct[k]  = 1
         $optStop[k] = low - atrTrail * (1.0 + 0.5 * k)
      NEXT
   ENDIF
ENDIF

IF brkDn = 1 AND dirActive = 0 THEN
   dirActive = -1
   entryPx   = orLow
   trailLvl  = high + atrTrail * trailMult
   IF showOpt = 1 THEN
      FOR k = 0 TO 4 DO
         $optAct[k]  = -1
         $optStop[k] = high + atrTrail * (1.0 + 0.5 * k)
      NEXT
   ENDIF
ENDIF

IF dirActive = 1 THEN
   trailLvl = max(trailLvl, low - atrTrail * trailMult)
   IF close < trailLvl OR showLv = 0 THEN
      totProfit = totProfit + (close - entryPx)
      dirActive = 0
   ENDIF
ELSIF dirActive = -1 THEN
   trailLvl = min(trailLvl, high + atrTrail * trailMult)
   IF close > trailLvl OR showLv = 0 THEN
      totProfit = totProfit + (entryPx - close)
      dirActive = 0
   ENDIF
ENDIF

//--------------------------------------------
// Stop optimizer: same entries, five ATR distances
//--------------------------------------------
IF showOpt = 1 THEN
   FOR k = 0 TO 4 DO
      IF $optAct[k] = 1 THEN
         $optStop[k] = max($optStop[k], low - atrTrail * (1.0 + 0.5 * k))
         IF close < $optStop[k] OR showLv = 0 THEN
            $optP[k]   = $optP[k] + (close - entryPx)
            $optAct[k] = 0
         ENDIF
      ELSIF $optAct[k] = -1 THEN
         $optStop[k] = min($optStop[k], high + atrTrail * (1.0 + 0.5 * k))
         IF close > $optStop[k] OR showLv = 0 THEN
            $optP[k]   = $optP[k] + (entryPx - close)
            $optAct[k] = 0
         ENDIF
      ENDIF
   NEXT
ENDIF

//--------------------------------------------
// Plotted series
//--------------------------------------------
IF orValid = 1 AND showLv = 1 THEN
   pHi = orHigh
   pLo = orLow
ELSE
   pHi = undefined
   pLo = undefined
ENDIF

IF orValid = 1 AND showLv = 1 AND showExt = 1 THEN
   pU1 = up1
   pU2 = up2
   pU3 = up3
   pD1 = dn1
   pD2 = dn2
   pD3 = dn3
ELSE
   pU1 = undefined
   pU2 = undefined
   pU3 = undefined
   pD1 = undefined
   pD2 = undefined
   pD3 = undefined
ENDIF

IF showTrail = 1 AND dirActive <> 0 THEN
   pTr = trailLvl
ELSE
   pTr = undefined
ENDIF

IF dirActive = 1 THEN
   trR = bullR
   trG = bullG
   trB = bullB
ELSE
   trR = bearR
   trG = bearG
   trB = bearB
ENDIF

trA = 255
IF dirActive = 0 OR dirActive <> dirActive[1] THEN
   trA = 0
ENDIF

//--------------------------------------------
// Fills. Both series of every pair switch off on the same bar,
// so the area is cut instead of bridged across the gap.
//--------------------------------------------
rgA = min(255, fillAlpha + 40)
IF sessOn = 0 THEN
   rgA = fillAlpha
ENDIF

srcC = close
IF showTrail = 1 AND dirActive <> 0 THEN
   fillT = trailLvl
ELSE
   fillT = srcC
ENDIF

COLORBETWEEN(pHi, pLo, neuR, neuG, neuB, rgA)
COLORBETWEEN(pHi, pU1, bullR, bullG, bullB, fillAlpha)
COLORBETWEEN(pU1, pU2, bullR, bullG, bullB, fillAlpha)
COLORBETWEEN(pU2, pU3, bullR, bullG, bullB, fillAlpha)
COLORBETWEEN(pLo, pD1, bearR, bearG, bearB, fillAlpha)
COLORBETWEEN(pD1, pD2, bearR, bearG, bearB, fillAlpha)
COLORBETWEEN(pD2, pD3, bearR, bearG, bearB, fillAlpha)
COLORBETWEEN(fillT, srcC, trR, trG, trB, trA * 0.25)

//--------------------------------------------
// Drawings. Everything is rebuilt from stored state on the last bar,
// so drawonlastbaronly clears the previous pass while the ring buffer
// keeps the historical breakout marks alive.
//--------------------------------------------
IF islastbarupdate THEN

   IF tfOk = 0 THEN
      DRAWTEXT("Ultimate ORB needs an intraday timeframe", 30, -40, SansSerif, Bold, 14) COLOURED(bearR, bearG, bearB, 255) ANCHOR(TOPLEFT, XSHIFT, YSHIFT)
   ENDIF

   //--- breakout marks
   IF nMk > 0 THEN
      FOR i = 1 TO nMk DO
         IF $mkD[i] = 1 THEN
            IF $mkH[i] = 1 THEN
               DRAWTEXT("BULL BREAK (HV)", $mkX[i], $mkY[i], SansSerif, Bold, 9) COLOURED(bullR, bullG, bullB, 255)
            ELSE
               DRAWTEXT("BULL BREAK (LV)", $mkX[i], $mkY[i], SansSerif, Standard, 9) COLOURED(bullR, bullG, bullB, 255)
            ENDIF
         ELSE
            IF $mkH[i] = 1 THEN
               DRAWTEXT("BEAR BREAK (HV)", $mkX[i], $mkY[i], SansSerif, Bold, 9) COLOURED(bearR, bearG, bearB, 255)
            ELSE
               DRAWTEXT("BEAR BREAK (LV)", $mkX[i], $mkY[i], SansSerif, Standard, 9) COLOURED(bearR, bearG, bearB, 255)
            ENDIF
         ENDIF
      NEXT
   ENDIF

   //--- session volume profile
   IF showVP = 1 AND orValid = 1 AND nSB > 0 AND orRange > 0 THEN
      binSz = orRange / vpRows
      FOR b = 0 TO vpRows - 1 DO
         $vp[b] = 0
      NEXT
      FOR i = 1 TO nSB DO
         bIdx = floor(($sbC[i] - orLow) / binSz)
         IF bIdx < 0 THEN
            bIdx = 0
         ENDIF
         IF bIdx > vpRows - 1 THEN
            bIdx = vpRows - 1
         ENDIF
         $vp[bIdx] = $vp[bIdx] + $sbV[i]
      NEXT
      maxV = 0
      pocIdx = 0
      FOR b = 0 TO vpRows - 1 DO
         IF $vp[b] > maxV THEN
            maxV = $vp[b]
            pocIdx = b
         ENDIF
      NEXT
      IF maxV > 0 THEN
         x0 = barindex + vpOffset
         FOR b = 0 TO vpRows - 1 DO
            IF $vp[b] > 0 THEN
               wBars = round(($vp[b] / maxV) * vpMaxBars)
               IF wBars < 1 THEN
                  wBars = 1
               ENDIF
               yb = orLow + b * binSz
               yt = yb + binSz
               IF b = pocIdx THEN
                  aFill = 235
               ELSE
                  aFill = 130
               ENDIF
               DRAWRECTANGLE(x0, yb, x0 + wBars, yt) COLOURED(vpR, vpG, vpB, 0) FILLCOLOR(vpR, vpG, vpB, aFill)
            ENDIF
         NEXT
      ENDIF
   ENDIF

   //--- level labels with the historical hit rate
   IF showLabels = 1 AND orValid = 1 THEN
      xL = barindex + 2
      DRAWTEXT("OR High", xL, orHigh, SansSerif, Bold, labelSize) COLOURED(neuR, neuG, neuB, 255)
      DRAWTEXT("OR Low", xL, orLow, SansSerif, Bold, labelSize) COLOURED(neuR, neuG, neuB, 255)
      IF showExt = 1 THEN
         IF nSess > 0 THEN
            rU1 = round(cU1 * 100 / nSess)
            rU2 = round(cU2 * 100 / nSess)
            rU3 = round(cU3 * 100 / nSess)
            rD1 = round(cD1 * 100 / nSess)
            rD2 = round(cD2 * 100 / nSess)
            rD3 = round(cD3 * 100 / nSess)
         ELSE
            rU1 = 0
            rU2 = 0
            rU3 = 0
            rD1 = 0
            rD2 = 0
            rD3 = 0
         ENDIF
         DRAWTEXT("Target 1 (#rU1#%)", xL, up1, SansSerif, Standard, labelSize) COLOURED(bullR, bullG, bullB, 255)
         DRAWTEXT("Target 2 (#rU2#%)", xL, up2, SansSerif, Standard, labelSize) COLOURED(bullR, bullG, bullB, 255)
         DRAWTEXT("Target 3 (#rU3#%)", xL, up3, SansSerif, Standard, labelSize) COLOURED(bullR, bullG, bullB, 255)
         DRAWTEXT("Target 1 (#rD1#%)", xL, dn1, SansSerif, Standard, labelSize) COLOURED(bearR, bearG, bearB, 255)
         DRAWTEXT("Target 2 (#rD2#%)", xL, dn2, SansSerif, Standard, labelSize) COLOURED(bearR, bearG, bearB, 255)
         DRAWTEXT("Target 3 (#rD3#%)", xL, dn3, SansSerif, Standard, labelSize) COLOURED(bearR, bearG, bearB, 255)
      ENDIF
   ENDIF

   //--- hit rate dashboard
   IF showDash = 1 THEN
      IF nSess > 0 THEN
         qU1 = round(cU1 * 100 / nSess)
         qU2 = round(cU2 * 100 / nSess)
         qU3 = round(cU3 * 100 / nSess)
         qD1 = round(cD1 * 100 / nSess)
         qD2 = round(cD2 * 100 / nSess)
         qD3 = round(cD3 * 100 / nSess)
      ELSE
         qU1 = 0
         qU2 = 0
         qU3 = 0
         qD1 = 0
         qD2 = 0
         qD3 = 0
      ENDIF
      dxv = dashX + dashCol
      DRAWTEXT("ORB HIT RATE", dashX, dashY, SansSerif, Bold, 11) COLOURED(dashR, dashG, dashB, 255) ANCHOR(TOPRIGHT, XSHIFT, YSHIFT)
      DRAWTEXT("Sessions", dashX, dashY - 26, SansSerif, Standard, 10) COLOURED(dashR, dashG, dashB, 255) ANCHOR(TOPRIGHT, XSHIFT, YSHIFT)
      DRAWTEXT("#nSess#", dxv, dashY - 26, SansSerif, Bold, 10) COLOURED(dashR, dashG, dashB, 255) ANCHOR(TOPRIGHT, XSHIFT, YSHIFT)
      DRAWTEXT("Bull T1", dashX, dashY - 50, SansSerif, Standard, 10) COLOURED(dashR, dashG, dashB, 255) ANCHOR(TOPRIGHT, XSHIFT, YSHIFT)
      DRAWTEXT("#cU1# / #nSess# (#qU1#%)", dxv, dashY - 50, SansSerif, Bold, 10) COLOURED(bullR, bullG, bullB, 255) ANCHOR(TOPRIGHT, XSHIFT, YSHIFT)
      DRAWTEXT("Bull T2", dashX, dashY - 68, SansSerif, Standard, 10) COLOURED(dashR, dashG, dashB, 255) ANCHOR(TOPRIGHT, XSHIFT, YSHIFT)
      DRAWTEXT("#cU2# / #nSess# (#qU2#%)", dxv, dashY - 68, SansSerif, Bold, 10) COLOURED(bullR, bullG, bullB, 255) ANCHOR(TOPRIGHT, XSHIFT, YSHIFT)
      DRAWTEXT("Bull T3", dashX, dashY - 86, SansSerif, Standard, 10) COLOURED(dashR, dashG, dashB, 255) ANCHOR(TOPRIGHT, XSHIFT, YSHIFT)
      DRAWTEXT("#cU3# / #nSess# (#qU3#%)", dxv, dashY - 86, SansSerif, Bold, 10) COLOURED(bullR, bullG, bullB, 255) ANCHOR(TOPRIGHT, XSHIFT, YSHIFT)
      DRAWTEXT("Bear T1", dashX, dashY - 110, SansSerif, Standard, 10) COLOURED(dashR, dashG, dashB, 255) ANCHOR(TOPRIGHT, XSHIFT, YSHIFT)
      DRAWTEXT("#cD1# / #nSess# (#qD1#%)", dxv, dashY - 110, SansSerif, Bold, 10) COLOURED(bearR, bearG, bearB, 255) ANCHOR(TOPRIGHT, XSHIFT, YSHIFT)
      DRAWTEXT("Bear T2", dashX, dashY - 128, SansSerif, Standard, 10) COLOURED(dashR, dashG, dashB, 255) ANCHOR(TOPRIGHT, XSHIFT, YSHIFT)
      DRAWTEXT("#cD2# / #nSess# (#qD2#%)", dxv, dashY - 128, SansSerif, Bold, 10) COLOURED(bearR, bearG, bearB, 255) ANCHOR(TOPRIGHT, XSHIFT, YSHIFT)
      DRAWTEXT("Bear T3", dashX, dashY - 146, SansSerif, Standard, 10) COLOURED(dashR, dashG, dashB, 255) ANCHOR(TOPRIGHT, XSHIFT, YSHIFT)
      DRAWTEXT("#cD3# / #nSess# (#qD3#%)", dxv, dashY - 146, SansSerif, Bold, 10) COLOURED(bearR, bearG, bearB, 255) ANCHOR(TOPRIGHT, XSHIFT, YSHIFT)
      IF showTrail = 1 THEN
         pnlShow = round(totProfit * 100) / 100
         DRAWTEXT("Trail P/L", dashX, dashY - 170, SansSerif, Standard, 10) COLOURED(dashR, dashG, dashB, 255) ANCHOR(TOPRIGHT, XSHIFT, YSHIFT)
         DRAWTEXT("#pnlShow#", dxv, dashY - 170, SansSerif, Bold, 10) COLOURED(dashR, dashG, dashB, 255) ANCHOR(TOPRIGHT, XSHIFT, YSHIFT)
      ENDIF
      IF showOpt = 1 THEN
         bestK = 0
         bestP = $optP[0]
         FOR k = 1 TO 4 DO
            IF $optP[k] > bestP THEN
               bestP = $optP[k]
               bestK = k
            ENDIF
         NEXT
         bestM = 1.0 + 0.5 * bestK
         bestS = round(bestP * 100) / 100
         DRAWTEXT("Best ATR mult", dashX, dashY - 194, SansSerif, Standard, 10) COLOURED(dashR, dashG, dashB, 255) ANCHOR(TOPRIGHT, XSHIFT, YSHIFT)
         DRAWTEXT("#bestM# (P/L #bestS#)", dxv, dashY - 194, SansSerif, Bold, 10) COLOURED(255, 215, 0, 255) ANCHOR(TOPRIGHT, XSHIFT, YSHIFT)
      ENDIF
   ENDIF

ENDIF

RETURN pHi COLOURED(neuR, neuG, neuB, 255) STYLE(line, 2) AS "OR High", pLo COLOURED(neuR, neuG, neuB, 255) STYLE(line, 2) AS "OR Low", pU1 COLOURED(bullR, bullG, bullB, 200) STYLE(dottedline, 1) AS "Upper target 1", pU2 COLOURED(bullR, bullG, bullB, 200) STYLE(dottedline, 1) AS "Upper target 2", pU3 COLOURED(bullR, bullG, bullB, 200) STYLE(dottedline, 1) AS "Upper target 3", pD1 COLOURED(bearR, bearG, bearB, 200) STYLE(dottedline, 1) AS "Lower target 1", pD2 COLOURED(bearR, bearG, bearB, 200) STYLE(dottedline, 1) AS "Lower target 2", pD3 COLOURED(bearR, bearG, bearB, 200) STYLE(dottedline, 1) AS "Lower target 3", pTr COLOURED(trR, trG, trB, trA) STYLE(line, 2) AS "Trailing stop"