Simplified Percentile Clustering
Introduction
Clustering methods group observations that look alike, and in trading they are a natural way to label the market regime: bullish, bearish or neutral. The usual tool, k-means, moves its centres iteratively and is expensive to run on every bar. Simplified Percentile Clustering takes a lighter route: it builds the cluster centres directly from percentiles and the mean of each feature over a long window, then assigns every bar to the closest centre.
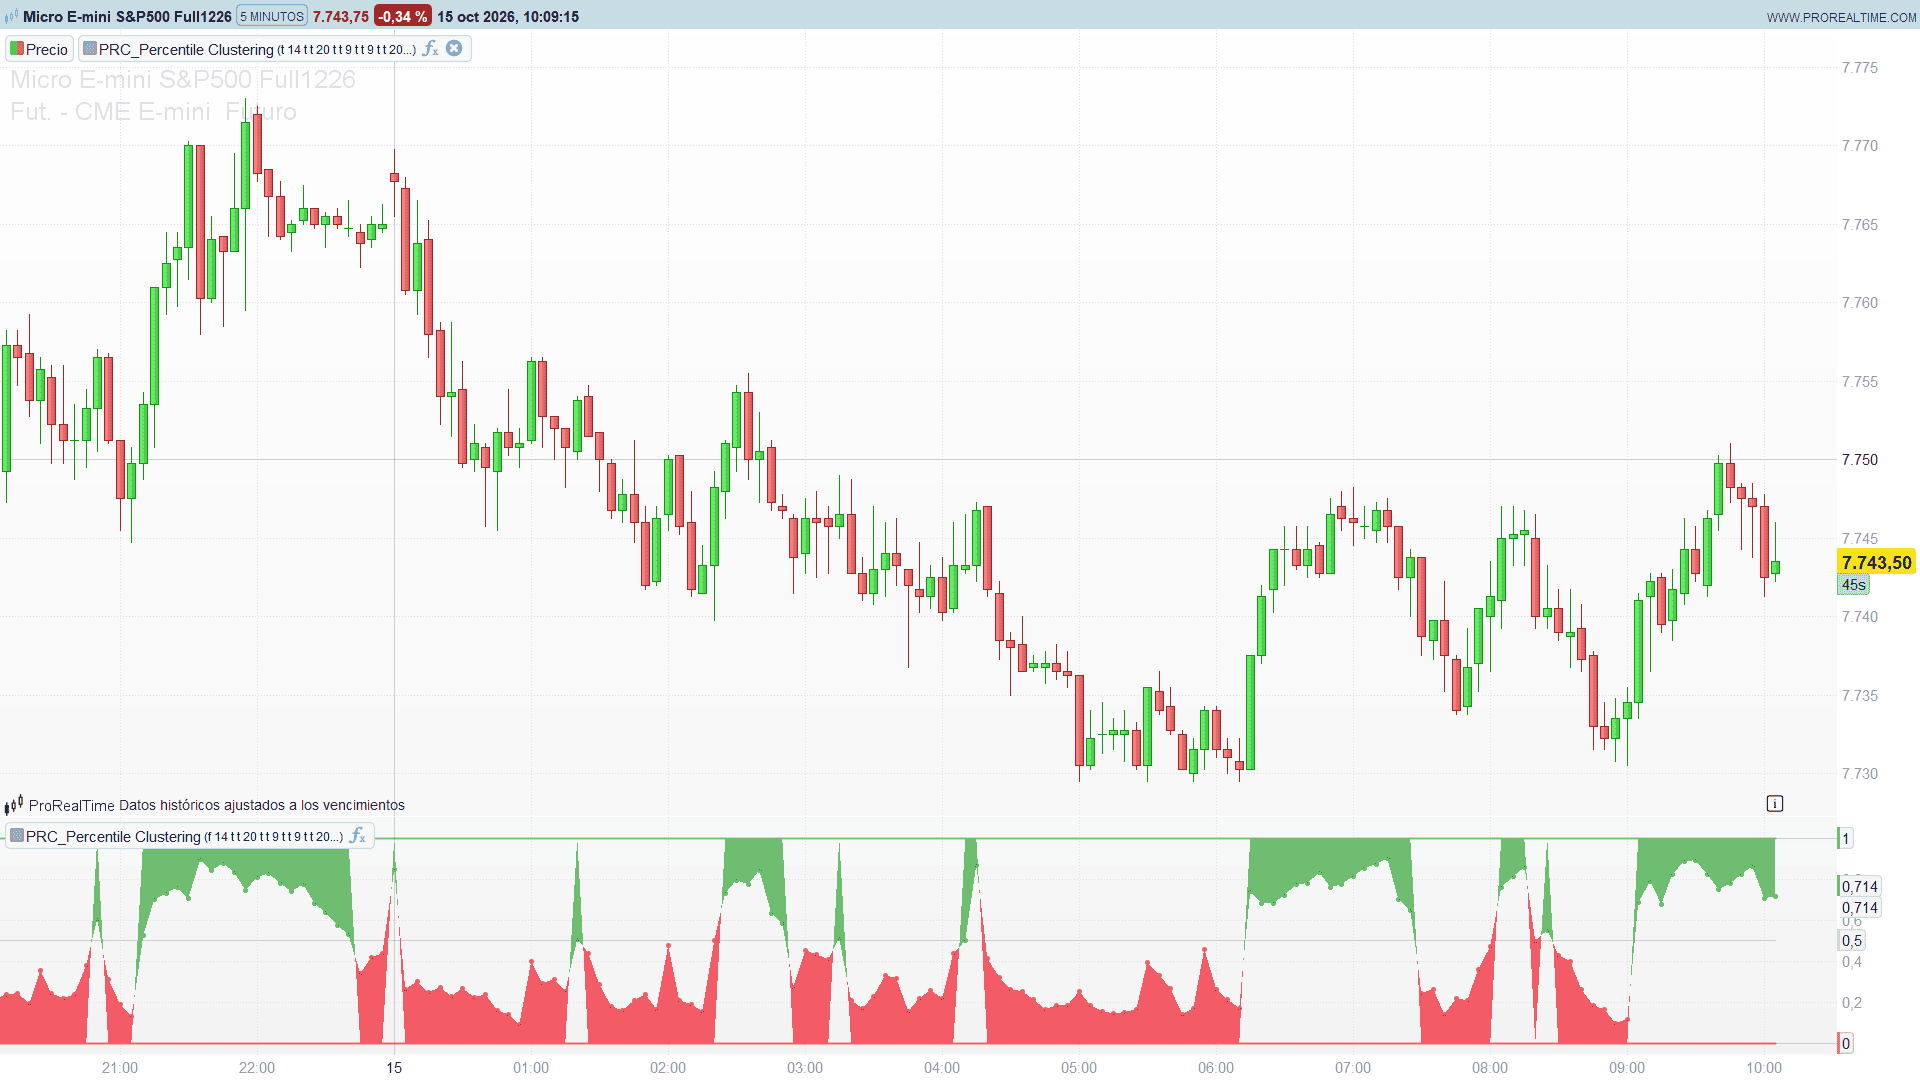
The result is a stable regime indicator that combines six classic measures (RSI, CCI, Fisher transform, DMI, z-score of price and price relative to its moving average) and also shows how close the market is to switching to the next cluster.
Theory Behind the Indicator
Features
Six features are calculated on every bar:
- RSI of the close (14).
- CCI of the close (20).
- Fisher transform of the median price (9).
- DMI difference, +DI minus -DI (9).
- Z-score of the close over 20 bars.
- Close divided by its moving average (14, simple or exponential).
Each feature except the z-score of price can be standardized with a rolling z-score over the lookback window (1000 bars), which puts all of them on a comparable scale.
Cluster centres
For each feature, the indicator takes the values of the last 1000 bars, the lower percentile (5), the upper percentile (95) and the mean. The centres are:
- with K = 2: the average of the lower percentile and the mean, and the average of the upper percentile and the mean;
- with K = 3: the same two plus the mean itself in the middle.
Using percentiles instead of the extremes keeps the centres away from outliers, and the long window makes them change slowly.
Assignment
In a single-feature mode the distance to each centre is the absolute difference between the feature and the centre. In Clusters mode the distance is the average of those differences over the enabled features, all with the same weight. The bar belongs to the closest centre: k0 (red, the low cluster), k1 (green with K = 2, orange with K = 3) and k2 (green, the high cluster with K = 3).
Proximity to the next cluster
The indicator also measures the relative position between the closest and the second closest centre: the distance to the closest divided by the sum of both distances. That value moves the plotted point from the row of its cluster towards the row of the second one. A point near its row is a clear member of the cluster; a point halfway between two rows is close to a regime change.
Key Features at a Glance
- Regime classification with 2 or 3 clusters.
- Six features that can be enabled or disabled one by one for the combined view.
- Optional standardization of each feature with a rolling z-score.
- Percentile and mean based centres: deterministic, stable and cheap to compute.
- Continuous value between cluster rows that shows the proximity to a change.
- Single-feature views with the feature and its own cluster centres.
How to Read the Indicator
- Clusters mode: the circles sit on row 0 (k0), row 1 (k1) or row 2 (k2 with K = 3), shifted towards the second closest cluster. The histogram goes from the row of the current cluster to the value. The guide lines at 0.5 and 1.5 are the boundaries: crossing one means the closest cluster has changed.
- Colour: red for k0, green for the high cluster and orange for the middle one with K = 3.
- Single-feature modes: the panel shows the feature (raw or standardized) with its centres as horizontal-looking lines. The colour of the circles tells you which centre is closest.
Practical Applications
- Trend filter. Trade long only while the combined view is in the high cluster and short only in the low one.
- Regime change warning. Points drifting from their row towards the guide line show that the features are moving to the other cluster before the change happens.
- Feature selection. Disable features one by one in Clusters mode to see which ones drive the changes on your instrument and timeframe.
Indicator Configuration
Features (use = 1 includes the feature in Clusters mode; Std = 1 standardizes it):
- useRsi (default: 1), rsiLen (default: 14), rsiStd (default: 1).
- useCci (default: 1), cciLen (default: 20), cciStd (default: 1).
- useFis (default: 1), fisLen (default: 9), fisStd (default: 1).
- useDmi (default: 1), dmiLen (default: 9), dmiStd (default: 1).
- useZsc (default: 1), zscLen (default: 20).
- useMar (default: 1), marLen (default: 14), maType (default: 0, 0 SMA / 1 EMA), marStd (default: 1).
Clustering:
- kClust (default: 2): number of clusters, 2 or 3.
- lookBack (default: 1000): bars used for the percentiles, the mean and the z-scores.
- pLow (default: 5) and pHigh (default: 95): lower and upper percentiles.
Plot:
- mainPlot (default: 0): 0 Clusters, 1 RSI, 2 CCI, 3 Fisher, 4 DMI, 5 Z-Score, 6 MAR.
- plotCl (default: 0): 1 also draws the cluster line in Clusters mode.
The indicator needs history: with the default settings the Clusters view starts after about 2000 bars (1000 for the z-scores and 1000 more for the centres). Load at least 2500 bars, or lower lookBack on short histories. While the chart has fewer bars than the selected mode needs, the panel shows a red warning with the bars it needs and the bars loaded; the number of bars is the units setting at the top of the chart.
Code
//---------------------------------------------------------------
// PRC_Percentile Clustering
// version = 0
// 13.10.2026
// Iván González @ www.prorealcode.com
// Author: InvestorUnknown
// Sharing ProRealTime knowledge
//--------------------------------------------------------------------//
// The only drawing object is the short-history warning, redrawn on the
// last bar. The panel series and the histogram fill are not affected.
DEFPARAM DRAWONLASTBARONLY = true
//--------------------------------------------------------------------//
// SETTINGS
//--------------------------------------------------------------------//
// --- Features (use = 1 includes it in the combined "Clusters" distance,
//     standardize = 1 turns it into a rolling z-score over lookBack bars)
useRsi = 1
rsiLen = 14
rsiStd = 1
useCci = 1
cciLen = 20
cciStd = 1
useFis = 1
fisLen = 9
fisStd = 1
useDmi = 1
dmiLen = 9
dmiStd = 1
useZsc = 1
zscLen = 20
useMar = 1
marLen = 14
// MA type for the price / MA ratio: 0 = SMA, 1 = EMA
maType = 0
marStd = 1
// --- Clustering
// number of cluster centres per feature: 2 or 3
kClust = 2
// bars used for the percentiles, the mean and the z-scores
lookBack = 1000
pLow = 5
pHigh = 95
// --- Plot
// main plot: 0 = Clusters (all features combined), 1 = RSI, 2 = CCI,
// 3 = Fisher, 4 = DMI, 5 = Z-Score, 6 = MAR
mainPlot = 0
// 1 = also draw the cluster line in "Clusters" mode
plotCl = 0
kClust = max(2, min(3, kClust))
lookBack = max(2, lookBack)
//--------------------------------------------------------------------//
// FEATURE 1: RSI (Wilder averages seeded with a simple average)
//--------------------------------------------------------------------//
IF barindex >= 1 THEN
   chg = close - close[1]
ELSE
   chg = 0
ENDIF
upMv = max(chg, 0)
dnMv = max(0 - chg, 0)
sumUp = summation[rsiLen](upMv)
sumDn = summation[rsiLen](dnMv)
IF barindex = rsiLen THEN
   upAvg = sumUp / rsiLen
   dnAvg = sumDn / rsiLen
ELSIF barindex > rsiLen THEN
   upAvg = (upMv + (rsiLen - 1) * upAvg[1]) / rsiLen
   dnAvg = (dnMv + (rsiLen - 1) * dnAvg[1]) / rsiLen
ENDIF
rsiOk = 0
IF barindex >= rsiLen THEN
   IF dnAvg = 0 THEN
      rsiRaw = 100
   ELSIF upAvg = 0 THEN
      rsiRaw = 0
   ELSE
      rsiRaw = 100 - 100 / (1 + upAvg / dnAvg)
   ENDIF
   rsiOk = 1
ENDIF
//--------------------------------------------------------------------//
// FEATURE 2: CCI of the close
//--------------------------------------------------------------------//
cciMa = average[cciLen](close)
cciOk = 0
IF barindex >= cciLen - 1 THEN
   devSum = 0
   FOR i = 0 TO cciLen - 1 DO
      devSum = devSum + abs(close[i] - cciMa)
   NEXT
   IF devSum > 0 THEN
      cciRaw = (close - cciMa) / (0.015 * devSum / cciLen)
      cciOk = 1
   ENDIF
ENDIF
//--------------------------------------------------------------------//
// FEATURE 3: Fisher transform of the median price
//--------------------------------------------------------------------//
hl2v = (high + low) / 2
hhF = highest[fisLen](hl2v)
llF = lowest[fisLen](hl2v)
valOk = 0
IF barindex >= fisLen - 1 THEN
   IF hhF > llF THEN
      vPrev = 0
      IF barindex > 0 THEN
         IF valOk[1] = 1 THEN
            vPrev = fVal[1]
         ENDIF
      ENDIF
      fVal = 0.66 * ((hl2v - llF) / (hhF - llF) - 0.5) + 0.67 * vPrev
      IF fVal > 0.99 THEN
         fVal = 0.999
      ELSIF fVal < -0.99 THEN
         fVal = -0.999
      ENDIF
      valOk = 1
   ENDIF
ENDIF
fisOk = 0
IF valOk = 1 THEN
   fPrev = 0
   IF barindex > 0 THEN
      IF fisOk[1] = 1 THEN
         fPrev = fisRaw[1]
      ENDIF
   ENDIF
   fisRaw = 0.5 * log((1 + fVal) / (1 - fVal)) + 0.5 * fPrev
   fisOk = 1
ENDIF
//--------------------------------------------------------------------//
// FEATURE 4: DMI difference (+DI minus -DI)
//--------------------------------------------------------------------//
IF barindex >= 1 THEN
   upD = high - high[1]
   dnD = low[1] - low
   IF upD > dnD AND upD > 0 THEN
      plusDm = upD
   ELSE
      plusDm = 0
   ENDIF
   IF dnD > upD AND dnD > 0 THEN
      minusDm = dnD
   ELSE
      minusDm = 0
   ENDIF
   trueRng = max(high - low, max(abs(high - close[1]), abs(low - close[1])))
ELSE
   plusDm = 0
   minusDm = 0
   trueRng = 0
ENDIF
sumPdm = summation[dmiLen](plusDm)
sumMdm = summation[dmiLen](minusDm)
sumTr = summation[dmiLen](trueRng)
IF barindex = dmiLen THEN
   pdmAvg = sumPdm / dmiLen
   mdmAvg = sumMdm / dmiLen
   trAvg = sumTr / dmiLen
ELSIF barindex > dmiLen THEN
   pdmAvg = (plusDm + (dmiLen - 1) * pdmAvg[1]) / dmiLen
   mdmAvg = (minusDm + (dmiLen - 1) * mdmAvg[1]) / dmiLen
   trAvg = (trueRng + (dmiLen - 1) * trAvg[1]) / dmiLen
ENDIF
// +DI and -DI keep their last value when the true range average is zero
once diHas = 0
IF barindex >= dmiLen THEN
   IF trAvg > 0 THEN
      plusDi = 100 * pdmAvg / trAvg
      minusDi = 100 * mdmAvg / trAvg
      diHas = 1
   ENDIF
ENDIF
dmiOk = diHas
IF dmiOk = 1 THEN
   dmiRaw = plusDi - minusDi
ENDIF
//--------------------------------------------------------------------//
// FEATURE 5: z-score of the close
//--------------------------------------------------------------------//
zscMa = average[zscLen](close)
zscOk = 0
IF barindex >= zscLen - 1 THEN
   sqSum = 0
   FOR i = 0 TO zscLen - 1 DO
      sqSum = sqSum + square(close[i] - zscMa)
   NEXT
   zscSd = sqrt(sqSum / zscLen)
   IF zscSd > 0 THEN
      zscVal = (close - zscMa) / zscSd
      zscOk = 1
   ENDIF
ENDIF
//--------------------------------------------------------------------//
// FEATURE 6: price / moving average ratio
//--------------------------------------------------------------------//
marSma = average[marLen](close)
IF barindex = marLen - 1 THEN
   marEma = marSma
ELSIF barindex > marLen - 1 THEN
   marEma = marEma[1] + 2 / (marLen + 1) * (close - marEma[1])
ENDIF
marOk = 0
IF barindex >= marLen - 1 THEN
   IF maType = 1 THEN
      marRaw = close / marEma
   ELSE
      marRaw = close / marSma
   ENDIF
   marOk = 1
ENDIF
//--------------------------------------------------------------------//
// ROLLING Z-SCORES OVER lookBack BARS
// A rolling statistic exists only when the last lookBack values exist,
// so every raw series carries a count of consecutive valid bars.
//--------------------------------------------------------------------//
IF rsiOk = 1 THEN
   rsiS = rsiRaw
   IF barindex = 0 THEN
      rsiRun = 1
   ELSE
      rsiRun = rsiRun[1] + 1
   ENDIF
ELSE
   rsiS = 0
   rsiRun = 0
ENDIF
IF cciOk = 1 THEN
   cciS = cciRaw
   IF barindex = 0 THEN
      cciRun = 1
   ELSE
      cciRun = cciRun[1] + 1
   ENDIF
ELSE
   cciS = 0
   cciRun = 0
ENDIF
IF fisOk = 1 THEN
   fisS = fisRaw
   IF barindex = 0 THEN
      fisRun = 1
   ELSE
      fisRun = fisRun[1] + 1
   ENDIF
ELSE
   fisS = 0
   fisRun = 0
ENDIF
IF dmiOk = 1 THEN
   dmiS = dmiRaw
   IF barindex = 0 THEN
      dmiRun = 1
   ELSE
      dmiRun = dmiRun[1] + 1
   ENDIF
ELSE
   dmiS = 0
   dmiRun = 0
ENDIF
IF marOk = 1 THEN
   marS = marRaw
   IF barindex = 0 THEN
      marRun = 1
   ELSE
      marRun = marRun[1] + 1
   ENDIF
ELSE
   marS = 0
   marRun = 0
ENDIF
rsiM = average[lookBack](rsiS)
rsiQ = average[lookBack](rsiS * rsiS)
cciM = average[lookBack](cciS)
cciQ = average[lookBack](cciS * cciS)
fisM = average[lookBack](fisS)
fisQ = average[lookBack](fisS * fisS)
dmiM = average[lookBack](dmiS)
dmiQ = average[lookBack](dmiS * dmiS)
marM = average[lookBack](marS)
marQ = average[lookBack](marS * marS)
// feature values (raw or standardized) and their validity
ok1 = 0
IF rsiStd = 0 THEN
   v1 = rsiRaw
   ok1 = rsiOk
ELSIF rsiRun >= lookBack THEN
   sdV = sqrt(max(rsiQ - rsiM * rsiM, 0))
   IF sdV > 0 THEN
      v1 = (rsiRaw - rsiM) / sdV
      ok1 = 1
   ENDIF
ENDIF
ok2 = 0
IF cciStd = 0 THEN
   v2 = cciRaw
   ok2 = cciOk
ELSIF cciRun >= lookBack THEN
   sdV = sqrt(max(cciQ - cciM * cciM, 0))
   IF sdV > 0 THEN
      v2 = (cciRaw - cciM) / sdV
      ok2 = 1
   ENDIF
ENDIF
ok3 = 0
IF fisStd = 0 THEN
   v3 = fisRaw
   ok3 = fisOk
ELSIF fisRun >= lookBack THEN
   sdV = sqrt(max(fisQ - fisM * fisM, 0))
   IF sdV > 0 THEN
      v3 = (fisRaw - fisM) / sdV
      ok3 = 1
   ENDIF
ENDIF
ok4 = 0
IF dmiStd = 0 THEN
   v4 = dmiRaw
   ok4 = dmiOk
ELSIF dmiRun >= lookBack THEN
   sdV = sqrt(max(dmiQ - dmiM * dmiM, 0))
   IF sdV > 0 THEN
      v4 = (dmiRaw - dmiM) / sdV
      ok4 = 1
   ENDIF
ENDIF
v5 = zscVal
ok5 = zscOk
ok6 = 0
IF marStd = 0 THEN
   v6 = marRaw
   ok6 = marOk
ELSIF marRun >= lookBack THEN
   sdV = sqrt(max(marQ - marM * marM, 0))
   IF sdV > 0 THEN
      v6 = (marRaw - marM) / sdV
      ok6 = 1
   ENDIF
ENDIF
// sanitized copies, run counts and lookBack means of the feature values
IF ok1 = 1 THEN
   s1 = v1
   IF barindex = 0 THEN
      run1 = 1
   ELSE
      run1 = run1[1] + 1
   ENDIF
ELSE
   s1 = 0
   run1 = 0
ENDIF
IF ok2 = 1 THEN
   s2 = v2
   IF barindex = 0 THEN
      run2 = 1
   ELSE
      run2 = run2[1] + 1
   ENDIF
ELSE
   s2 = 0
   run2 = 0
ENDIF
IF ok3 = 1 THEN
   s3 = v3
   IF barindex = 0 THEN
      run3 = 1
   ELSE
      run3 = run3[1] + 1
   ENDIF
ELSE
   s3 = 0
   run3 = 0
ENDIF
IF ok4 = 1 THEN
   s4 = v4
   IF barindex = 0 THEN
      run4 = 1
   ELSE
      run4 = run4[1] + 1
   ENDIF
ELSE
   s4 = 0
   run4 = 0
ENDIF
IF ok5 = 1 THEN
   s5 = v5
   IF barindex = 0 THEN
      run5 = 1
   ELSE
      run5 = run5[1] + 1
   ENDIF
ELSE
   s5 = 0
   run5 = 0
ENDIF
IF ok6 = 1 THEN
   s6 = v6
   IF barindex = 0 THEN
      run6 = 1
   ELSE
      run6 = run6[1] + 1
   ENDIF
ELSE
   s6 = 0
   run6 = 0
ENDIF
$val[1] = s1
$val[2] = s2
$val[3] = s3
$val[4] = s4
$val[5] = s5
$val[6] = s6
$vOk[1] = ok1
$vOk[2] = ok2
$vOk[3] = ok3
$vOk[4] = ok4
$vOk[5] = ok5
$vOk[6] = ok6
$run[1] = run1
$run[2] = run2
$run[3] = run3
$run[4] = run4
$run[5] = run5
$run[6] = run6
$avg[1] = average[lookBack](s1)
$avg[2] = average[lookBack](s2)
$avg[3] = average[lookBack](s3)
$avg[4] = average[lookBack](s4)
$avg[5] = average[lookBack](s5)
$avg[6] = average[lookBack](s6)
$use[1] = useRsi
$use[2] = useCci
$use[3] = useFis
$use[4] = useDmi
$use[5] = useZsc
$use[6] = useMar
// features that need their centres: all of them in "Clusters" mode
FOR f = 1 TO 6 DO
   IF mainPlot = 0 OR mainPlot = f THEN
      $need[f] = 1
   ELSE
      $need[f] = 0
   ENDIF
NEXT
//--------------------------------------------------------------------//
// SORTED WINDOW OF EACH FEATURE
// Holds the closed bars of the lookBack window (lookBack - 1 values);
// the live bar is merged in when reading. Updated once per bar, with
// all its state in arrays, so the live ticks never repeat an update.
//--------------------------------------------------------------------//
IF barindex = 0 THEN
   $gst[0] = -1
   FOR f = 1 TO 6 DO
      $cnt[f] = 0
   NEXT
ENDIF
IF barindex > $gst[0] THEN
   $gst[0] = barindex
   IF barindex >= 1 THEN
      $hasN[1] = ok1[1]
      $newV[1] = s1[1]
      $hasN[2] = ok2[1]
      $newV[2] = s2[1]
      $hasN[3] = ok3[1]
      $newV[3] = s3[1]
      $hasN[4] = ok4[1]
      $newV[4] = s4[1]
      $hasN[5] = ok5[1]
      $newV[5] = s5[1]
      $hasN[6] = ok6[1]
      $newV[6] = s6[1]
      FOR f = 1 TO 6 DO
         $hasO[f] = 0
      NEXT
      IF barindex >= lookBack THEN
         $hasO[1] = ok1[lookBack]
         $oldV[1] = s1[lookBack]
         $hasO[2] = ok2[lookBack]
         $oldV[2] = s2[lookBack]
         $hasO[3] = ok3[lookBack]
         $oldV[3] = s3[lookBack]
         $hasO[4] = ok4[lookBack]
         $oldV[4] = s4[lookBack]
         $hasO[5] = ok5[lookBack]
         $oldV[5] = s5[lookBack]
         $hasO[6] = ok6[lookBack]
         $oldV[6] = s6[lookBack]
      ENDIF
      FOR f = 1 TO 6 DO
         IF $need[f] = 1 THEN
            bs = f * (lookBack + 2)
            nS = $cnt[f]
            // position of the value that leaves the window
            rPos = -1
            IF $hasO[f] = 1 AND nS > 0 THEN
               tgt = $oldV[f]
               loB = 0
               hiB = nS
               WHILE loB < hiB DO
                  mdB = floor((loB + hiB) / 2)
                  IF $srt[bs + mdB] < tgt THEN
                     loB = mdB + 1
                  ELSE
                     hiB = mdB
                  ENDIF
               WEND
               rPos = loB
               IF rPos >= nS THEN
                  rPos = nS - 1
               ENDIF
               IF rPos > 0 THEN
                  IF abs($srt[bs + rPos - 1] - tgt) < abs($srt[bs + rPos] - tgt) THEN
                     rPos = rPos - 1
                  ENDIF
               ENDIF
            ENDIF
            // position of the value that enters the window
            pPos = -1
            IF $hasN[f] = 1 THEN
               tgt = $newV[f]
               loB = 0
               hiB = nS
               WHILE loB < hiB DO
                  mdB = floor((loB + hiB) / 2)
                  IF $srt[bs + mdB] < tgt THEN
                     loB = mdB + 1
                  ELSE
                     hiB = mdB
                  ENDIF
               WEND
               pPos = loB
            ENDIF
            IF rPos >= 0 AND pPos >= 0 THEN
               // replace: only the values between the two positions move
               IF pPos > rPos THEN
                  IF pPos - 2 >= rPos THEN
                     FOR i = rPos TO pPos - 2 DO
                        $srt[bs + i] = $srt[bs + i + 1]
                     NEXT
                  ENDIF
                  $srt[bs + pPos - 1] = $newV[f]
               ELSE
                  IF rPos >= pPos + 1 THEN
                     FOR i = rPos DOWNTO pPos + 1 DO
                        $srt[bs + i] = $srt[bs + i - 1]
                     NEXT
                  ENDIF
                  $srt[bs + pPos] = $newV[f]
               ENDIF
            ELSIF rPos >= 0 THEN
               // remove only
               IF nS - 2 >= rPos THEN
                  FOR i = rPos TO nS - 2 DO
                     $srt[bs + i] = $srt[bs + i + 1]
                  NEXT
               ENDIF
               $cnt[f] = nS - 1
            ELSIF pPos >= 0 THEN
               // insert only
               IF nS - 1 >= pPos THEN
                  FOR i = nS DOWNTO pPos + 1 DO
                     $srt[bs + i] = $srt[bs + i - 1]
                  NEXT
               ENDIF
               $srt[bs + pPos] = $newV[f]
               $cnt[f] = nS + 1
            ENDIF
         ENDIF
      NEXT
   ENDIF
ENDIF
//--------------------------------------------------------------------//
// CLUSTER CENTRES: mean of each percentile with the lookBack mean
// (k = 2: low and high; k = 3: low, mean, high)
//--------------------------------------------------------------------//
FOR f = 1 TO 6 DO
   $cOk[f] = 0
   IF $need[f] = 1 AND $run[f] >= lookBack THEN
      bs = f * (lookBack + 2)
      nS = $cnt[f]
      xNow = $val[f]
      loB = 0
      hiB = nS
      WHILE loB < hiB DO
         mdB = floor((loB + hiB) / 2)
         IF $srt[bs + mdB] < xNow THEN
            loB = mdB + 1
         ELSE
            hiB = mdB
         ENDIF
      WEND
      // the live value sits at position loB of the merged window
      FOR eK = 1 TO 2 DO
         IF eK = 1 THEN
            idxP = floor(nS * pLow / 100)
         ELSE
            idxP = floor(nS * pHigh / 100)
         ENDIF
         IF idxP < loB THEN
            pctX = $srt[bs + idxP]
         ELSIF idxP = loB THEN
            pctX = xNow
         ELSE
            pctX = $srt[bs + idxP - 1]
         ENDIF
         IF eK = 1 THEN
            pctLo = pctX
         ELSE
            pctHi = pctX
         ENDIF
      NEXT
      midX = $avg[f]
      $cen[f * 3] = (pctLo + midX) / 2
      IF kClust = 3 THEN
         $cen[f * 3 + 1] = midX
         $cen[f * 3 + 2] = (pctHi + midX) / 2
      ELSE
         $cen[f * 3 + 1] = (pctHi + midX) / 2
      ENDIF
      $cOk[f] = 1
   ENDIF
NEXT
//--------------------------------------------------------------------//
// NEAREST AND SECOND NEAREST CENTRE
//--------------------------------------------------------------------//
nOn = useRsi + useCci + useFis + useDmi + useZsc + useMar
distOk = 0
IF mainPlot = 0 THEN
   // every feature takes part, enabled or not (a missing one voids the distance)
   distOk = 1
   FOR f = 1 TO 6 DO
      IF $cOk[f] = 0 THEN
         distOk = 0
      ENDIF
   NEXT
   IF nOn = 0 THEN
      distOk = 0
   ENDIF
   IF distOk = 1 THEN
      FOR i = 0 TO kClust - 1 DO
         dSum = 0
         FOR f = 1 TO 6 DO
            dSum = dSum + $use[f] * abs($val[f] - $cen[f * 3 + i])
         NEXT
         $dst[i] = dSum / nOn
      NEXT
   ENDIF
ELSE
   distOk = $cOk[mainPlot]
   IF distOk = 1 THEN
      FOR i = 0 TO kClust - 1 DO
         $dst[i] = abs($val[mainPlot] - $cen[mainPlot * 3 + i])
      NEXT
   ENDIF
ENDIF
curCl = kClust - 1
secCl = kClust - 2
relPos = 0
IF distOk = 1 THEN
   curCl = -1
   secCl = -1
   minD = 0
   secD = 0
   FOR i = 0 TO kClust - 1 DO
      dstI = $dst[i]
      IF curCl = -1 OR dstI < minD THEN
         secD = minD
         secCl = curCl
         minD = dstI
         curCl = i
      ELSIF secCl = -1 OR dstI < secD THEN
         secD = dstI
         secCl = i
      ENDIF
   NEXT
   IF secD = 0 THEN
      relPos = 0
   ELSE
      relPos = minD / (minD + secD)
   ENDIF
ENDIF
// value on the panel
plotOk = 0
IF mainPlot = 0 THEN
   IF distOk = 1 THEN
      plotV = curCl + (secCl - curCl) * relPos
      plotOk = 1
   ENDIF
ELSE
   IF $vOk[mainPlot] = 1 THEN
      plotV = $val[mainPlot]
      plotOk = 1
   ENDIF
ENDIF
//--------------------------------------------------------------------//
// COLOURS
//--------------------------------------------------------------------//
IF plotOk = 0 THEN
   colR = 120
   colG = 123
   colB = 134
   colA = 51
ELSE
   colA = 204
   IF curCl = 0 THEN
      colR = 242
      colG = 54
      colB = 69
   ELSIF curCl = 1 AND kClust = 3 THEN
      colR = 255
      colG = 152
      colB = 0
   ELSE
      colR = 76
      colG = 175
      colB = 80
   ENDIF
ENDIF
// centre lines: shown with the plot and with valid centres
cenOk = 0
IF plotOk = 1 THEN
   IF mainPlot = 0 THEN
      cenOk = 1
      cen0 = 0
      cen1 = 1
      cen2 = 2
   ELSIF $cOk[mainPlot] = 1 THEN
      cenOk = 1
      cen0 = $cen[mainPlot * 3]
      cen1 = $cen[mainPlot * 3 + 1]
      IF kClust = 3 THEN
         cen2 = $cen[mainPlot * 3 + 2]
      ENDIF
   ENDIF
ENDIF
IF kClust = 3 THEN
   c1R = 255
   c1G = 152
   c1B = 0
ELSE
   c1R = 76
   c1G = 175
   c1B = 80
ENDIF
// series stay empty only until they first have a value; after that a
// missing value is hidden with alpha 0 at its last level
once plotSeen = 0
IF plotOk = 1 THEN
   plotSeen = 1
ENDIF
once cenSeen = 0
IF cenOk = 1 THEN
   cenSeen = 1
ENDIF
IF plotSeen = 0 THEN
   lineV = undefined
ELSIF plotOk = 1 THEN
   lineV = plotV
ELSE
   lineV = lineV[1]
ENDIF
lineA = 0
IF plotOk = 1 AND (mainPlot > 0 OR plotCl = 1) THEN
   lineA = 128
ENDIF
IF cenSeen = 0 THEN
   k0Line = undefined
   k1Line = undefined
ELSIF cenOk = 1 THEN
   k0Line = cen0
   k1Line = cen1
ELSE
   k0Line = k0Line[1]
   k1Line = k1Line[1]
ENDIF
// third centre only with k = 3
IF kClust = 3 AND cenSeen = 1 THEN
   IF cenOk = 1 THEN
      k2Line = cen2
   ELSE
      k2Line = k2Line[1]
   ENDIF
ELSE
   k2Line = undefined
ENDIF
cenA = 0
IF cenOk = 1 THEN
   cenA = 179
ENDIF
cen2A = 0
IF cenOk = 1 AND kClust = 3 THEN
   cen2A = 179
ENDIF
// guide lines between the cluster rows ("Clusters" mode only)
IF mainPlot = 0 THEN
   guide1 = 0.5
ELSE
   guide1 = undefined
ENDIF
IF mainPlot = 0 AND kClust = 3 THEN
   guide2 = 1.5
ELSE
   guide2 = undefined
ENDIF
guideA = 0
IF plotOk = 1 THEN
   guideA = 77
ENDIF
// cluster histogram: filled from the row of the cluster to the value
// (both edges collapse onto the value when there is nothing to show)
IF mainPlot = 0 AND plotOk = 1 THEN
   histBase = curCl
   histTop = plotV
   histA = 204
ELSE
   histBase = lineV
   histTop = lineV
   histA = 0
ENDIF
COLORBETWEEN(histBase, histTop, colR, colG, colB, histA)
//--------------------------------------------------------------------//
// SHORT HISTORY WARNING
// Nothing is drawn until the chart has the bars that the z-scores and
// the cluster centres need: without this the panel just stays empty.
//--------------------------------------------------------------------//
IF islastbarupdate THEN
   // index of the first bar with a value in the selected mode
   needIdx = 0
   FOR f = 1 TO 6 DO
      IF mainPlot = 0 OR mainPlot = f THEN
         IF f = 1 THEN
            firstF = rsiLen
            zOn = rsiStd
         ELSIF f = 2 THEN
            firstF = cciLen - 1
            zOn = cciStd
         ELSIF f = 3 THEN
            firstF = fisLen - 1
            zOn = fisStd
         ELSIF f = 4 THEN
            firstF = dmiLen
            zOn = dmiStd
         ELSIF f = 5 THEN
            firstF = zscLen - 1
            zOn = 0
         ELSE
            firstF = marLen - 1
            zOn = marStd
         ENDIF
         // rolling z-score of the feature
         IF zOn <> 0 THEN
            firstF = firstF + lookBack - 1
         ENDIF
         // cluster centres ("Clusters" mode needs the six of them)
         IF mainPlot = 0 THEN
            firstF = firstF + lookBack - 1
         ENDIF
         needIdx = max(needIdx, firstF)
      ENDIF
   NEXT
   IF barindex < needIdx THEN
      needBars = needIdx + 1
      haveBars = barindex + 1
      DRAWTEXT("Percentile Clustering: load at least #needBars# bars (now #haveBars#)", 210, -40, SansSerif, Bold, 12) COLOURED(220, 0, 0) ANCHOR(TOPLEFT, XSHIFT, YSHIFT)
   ENDIF
ENDIF
RETURN guide1 COLOURED(120, 123, 134, guideA) AS "Guide Line 1", guide2 COLOURED(120, 123, 134, guideA) AS "Guide Line 2", lineV COLOURED(colR, colG, colB, lineA) AS "Cluster Line", lineV COLOURED(colR, colG, colB, colA) STYLE(point, 2) AS "Cluster Circles", k0Line COLOURED(242, 54, 69, cenA) STYLE(line, 2) AS "k0 Cluster Center", k1Line COLOURED(c1R, c1G, c1B, cenA) STYLE(line, 2) AS "k1 Cluster Center", k2Line COLOURED(76, 175, 80, cen2A) STYLE(line, 2) AS "k2 Cluster Center"