Volume Bubbles: Spot Unusual Volume With Percentile Clusters
Introduction
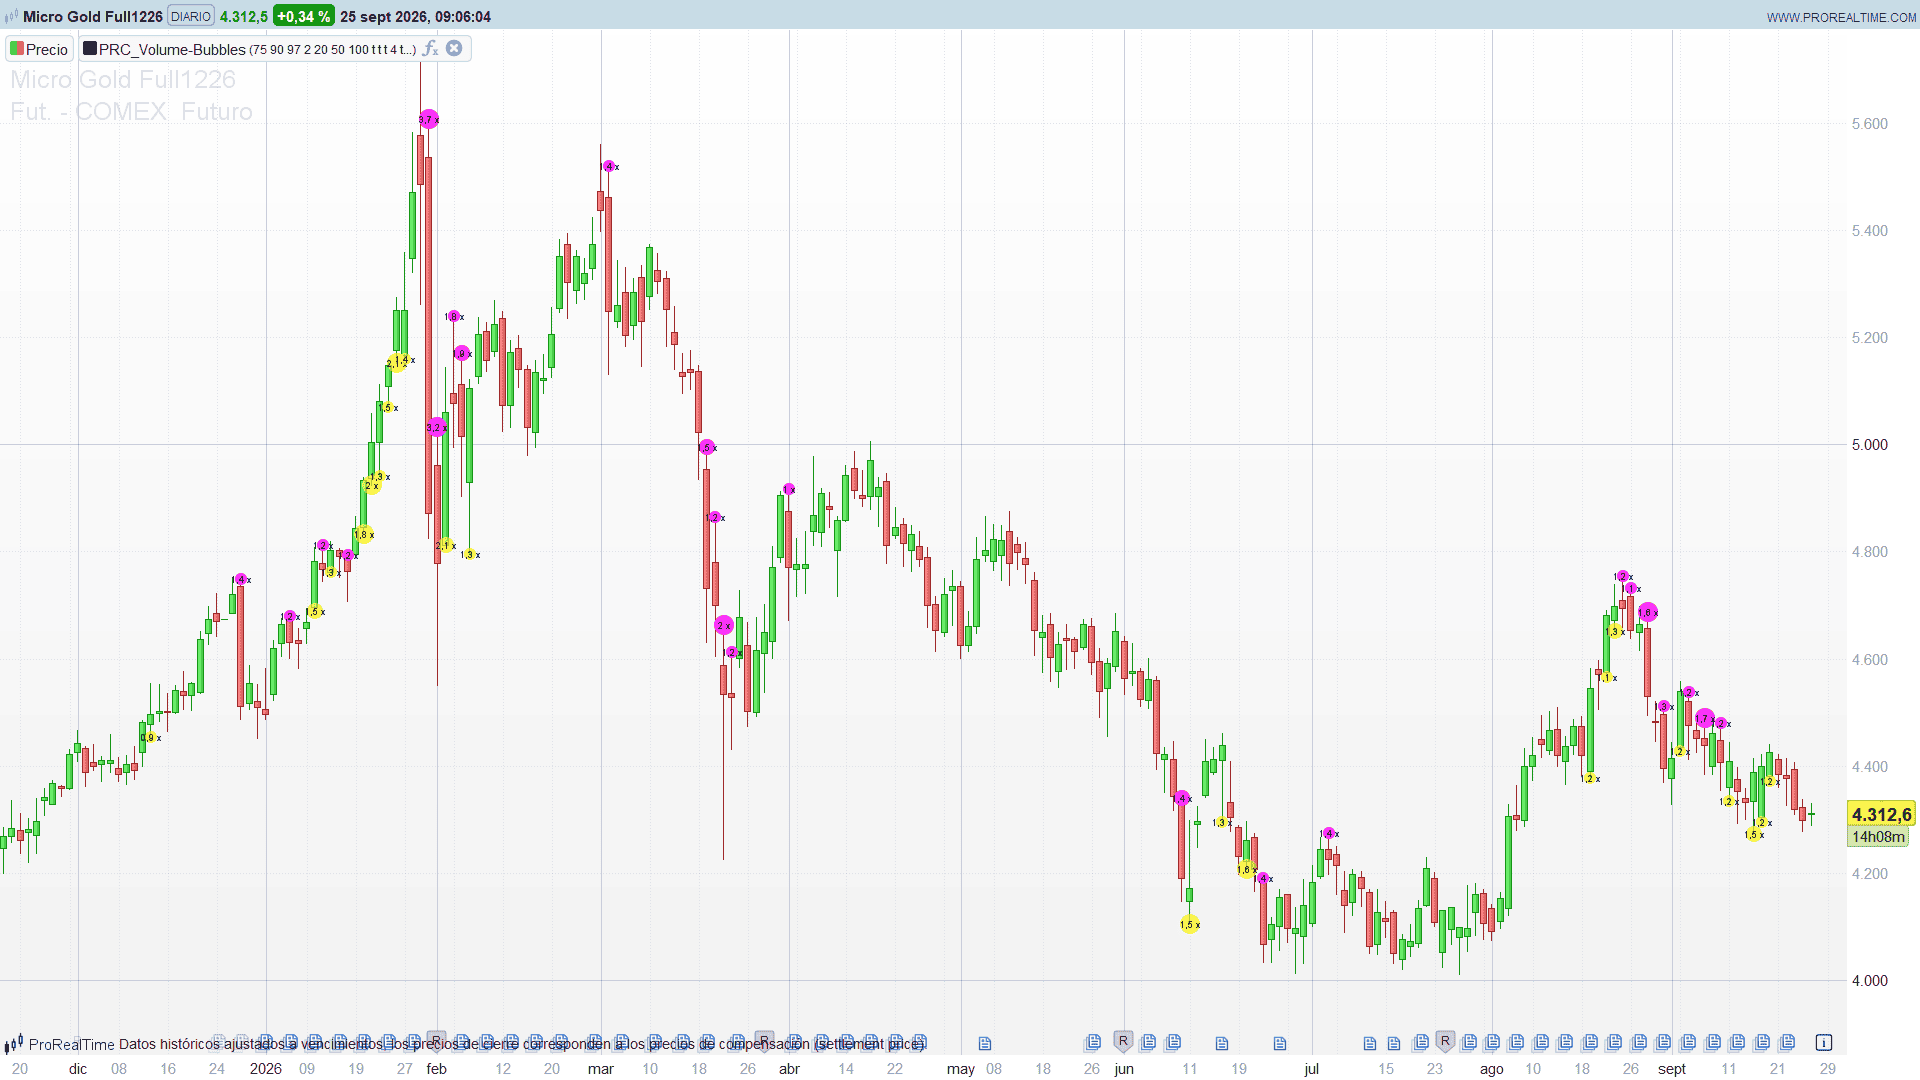
A volume histogram under the chart tells you when volume was high, but you still have to decide what “high” means and connect each bar with the price action above it. Volume Bubbles, by QuantAlgo, puts that answer directly on the price chart. Every bar with unusual volume gets a bubble, placed under the low of a bullish candle or above the high of a bearish one, and sized by how exceptional the volume is: small, medium or big.
The bubbles make climaxes, breakouts with real participation and absorption at support or resistance visible at a glance, without leaving the price pane.
Theory Behind the Indicator
Percentiles instead of a fixed multiple
Most volume filters compare the bar with a multiple of the average volume, for example 2x. The problem is that the average is pulled up by the few very large bars, and a 2x rule means very different things on a quiet instrument and on a hectic one. This indicator uses percentiles: a bar is elevated when its volume is at or above, say, the 90th percentile of the recent bars, that is, when only 10% of those bars traded more. Percentiles adapt to the shape of each instrument’s volume distribution.
The percentile is computed with linear interpolation between the two nearest ranks, and the window includes the current bar.
Three windows and a consensus
A single lookback can be fooled: after a quiet week, any normal bar looks big against the last 20 bars. So each bar is checked against three windows at the same time, short (20 bars), medium (50) and long (100). The consensus mode decides how many of them must agree:
- Any window: one is enough, the most signals
- Majority: two of the three, the default
- All windows: the three must agree, the fewest and strongest signals
Three cluster sizes
The same test runs with three percentile levels:
- Small cluster: 75th percentile, the top 25% of volume
- Medium cluster: 90th percentile, the top 10%
- Big cluster: 97th percentile, the top 3%
Each bar gets the largest size it qualifies for.
Buy or sell
A bubble is a buy cluster when the candle closes at or above its open, and a sell cluster when it closes below. Buy bubbles sit under the low, sell bubbles above the high, so the bubble points to the side that was pushing.
Key Features at a Glance
- Unusual volume detection with interpolated percentiles on three lookback windows
- Consensus mode: any, majority or all windows
- Three cluster sizes shown as small, medium and large bubbles
- Buy and sell bubbles placed under the low or above the high of the candle
- Volume (formatted as K, M or B), volume ratio against the 50 bar average, or both, printed inside the bubble
- Six colour presets plus custom colours
- Warning on the chart when the instrument has no volume data
How to Read the Indicator
- Big bubbles at the end of a move often mark climaxes: the last buyers or sellers entering. A big sell bubble after a long decline, followed by a bar that does not go lower, is a classic capitulation pattern.
- Bubbles on breakouts confirm participation. A range break with a medium or big bubble is backed by real volume; a break with no bubble is more suspicious.
- Bubbles against the move point to absorption. Several buy bubbles at a level while price stops falling show demand stepping in.
- Clusters of bubbles in a small price area mark levels where a lot of volume traded, which tend to act as support or resistance later.
- The ratio gives you the size of the event at a glance: 2.5x means two and a half times the average volume of the last 50 bars.
Practical Applications
- Confirming breakouts and breakdowns by requiring at least a medium bubble on the breakout bar.
- Finding exhaustion by watching for big bubbles after extended moves.
- Marking volume levels from past big bubbles to use as support, resistance or targets.
- Filtering noise with the “All windows” consensus mode and only big clusters visible, on higher timeframes or active instruments.
Indicator Configuration
smallPct,mediumPct,bigPct(defaults: 75, 90, 97): percentile thresholds of the three cluster sizes.consensusMode(default: 2): number of windows that must agree, 1 = any, 2 = majority, 3 = all.shortLen,midLen,longLen(defaults: 20, 50, 100): lookback windows.midLenis also the length of the average used for the ratio.showSmall,showMedium,showBig(default: 1): show each cluster size.colorPreset(default: 5): 0 Classic, 1 Aqua, 2 Cosmic, 3 Cyber, 4 Neon, 5 Custom.cBuyR,cBuyG,cBuyB,cBuyAandcSellR,cSellG,cSellB,cSellA: custom buy and sell colours with their opacity (0 to 255), used with the Custom preset.showLabels(default: 1): numbers inside the bubbles.labelContent(default: 0): 0 = volume, 1 = ratio, 2 = volume and ratio.maxBubbles(default: 500): number of recent bubbles kept on the chart.
The indicator needs volume data. On an instrument without volume a warning is shown in the middle of the chart.
Code
//---------------------------------------------------------------
//PRC_Volume-Bubbles
//version = 0
//25.09.2026
//Iván González @ www.prorealcode.com
//Author: QuantAlgo
//Sharing ProRealTime knowledge
//--------------------------------------------------------------------//
defparam drawonlastbaronly = true
//--------------------------------------------------------------------//
// SETTINGS
//--------------------------------------------------------------------//
smallPct = 75       // Small cluster percentile
mediumPct = 90      // Medium cluster percentile
bigPct = 97         // Big cluster percentile
consensusMode = 2   // windows that must agree: 1 = any, 2 = majority (2 of 3), 3 = all
shortLen = 20       // short window
midLen = 50         // medium window (also the average for the ratio)
longLen = 100       // long window
showSmall = 1
showMedium = 1
showBig = 1
colorPreset = 5     // 0 Classic, 1 Aqua, 2 Cosmic, 3 Cyber, 4 Neon, 5 Custom
showLabels = 1      // numbers inside the bubbles
labelContent = 0    // 0 = Volume, 1 = Ratio, 2 = Volume + Ratio
maxBubbles = 500    // bubbles kept on the chart (the most recent ones)
// Custom colours (colorPreset = 5), alpha 0-255
cBuyR = 0
cBuyG = 255
cBuyB = 170
cBuyA = 153
cSellR = 255
cSellG = 0
cSellB = 0
cSellA = 204
//--------------------------------------------------------------------//
// COLOURS
//--------------------------------------------------------------------//
IF colorPreset = 0 THEN
   buyR = 0
   buyG = 255
   buyB = 0
   buyA = 153
   sellR = 255
   sellG = 0
   sellB = 0
   sellA = 204
ELSIF colorPreset = 1 THEN
   buyR = 0
   buyG = 191
   buyB = 255
   buyA = 153
   sellR = 255
   sellG = 140
   sellB = 0
   sellA = 204
ELSIF colorPreset = 2 THEN
   buyR = 73
   buyG = 255
   buyB = 206
   buyA = 153
   sellR = 153
   sellG = 50
   sellB = 204
   sellA = 204
ELSIF colorPreset = 3 THEN
   buyR = 0
   buyG = 204
   buyB = 204
   buyA = 204
   sellR = 255
   sellG = 102
   sellB = 0
   sellA = 153
ELSIF colorPreset = 4 THEN
   buyR = 255
   buyG = 255
   buyB = 0
   buyA = 153
   sellR = 255
   sellG = 0
   sellB = 255
   sellA = 204
ELSE
   buyR = cBuyR
   buyG = cBuyG
   buyB = cBuyB
   buyA = cBuyA
   sellR = cSellR
   sellG = cSellG
   sellB = cSellB
   sellA = cSellA
ENDIF
//--------------------------------------------------------------------//
// PERCENTILE TESTS (linear interpolation, window includes the current bar)
// volume >= percentile p of the last N bars  <=>
// count of bars with volume <= current volume >= ceil((N - 1) * p / 100) + 1
//--------------------------------------------------------------------//
$winL[1] = shortLen
$winL[2] = midLen
$winL[3] = longLen
$pctL[1] = smallPct
$pctL[2] = mediumPct
$pctL[3] = bigPct
hitsS = 0
hitsM = 0
hitsB = 0
FOR w = 1 TO 3 DO
   nW = $winL[w]
   IF barindex >= nW - 1 THEN
      cntLE = 0
      FOR j = 0 TO nW - 1 DO
         IF volume[j] <= volume THEN
            cntLE = cntLE + 1
         ENDIF
      NEXT
      FOR q = 1 TO 3 DO
         kNeed = ceil((nW - 1) * $pctL[q] / 100 - 0.000000001) + 1
         IF cntLE >= kNeed THEN
            IF q = 1 THEN
               hitsS = hitsS + 1
            ELSIF q = 2 THEN
               hitsM = hitsM + 1
            ELSE
               hitsB = hitsB + 1
            ENDIF
         ENDIF
      NEXT
   ENDIF
NEXT
//--------------------------------------------------------------------//
// CONSENSUS AND CLUSTER SIZE
//--------------------------------------------------------------------//
isBig = hitsB >= consensusMode
isMed = NOT isBig AND hitsM >= consensusMode
isSmall = NOT isBig AND NOT isMed AND hitsS >= consensusMode
isSmallVis = isSmall AND showSmall = 1
isMedVis = isMed AND showMedium = 1
isBigVis = isBig AND showBig = 1
isAnyVis = isSmallVis OR isMedVis OR isBigVis
// buy / sell by candle direction
isSell = close < open
IF isSell THEN
   bubY = high
ELSE
   bubY = low
ENDIF
avgVol = average[midLen](volume)
IF avgVol > 0 THEN
   volRatio = volume / avgVol
ELSE
   volRatio = 0
ENDIF
//--------------------------------------------------------------------//
// BUBBLES: stored in a ring buffer and redrawn on the last bar, so the live
// bar does not pile up one bubble per tick while its volume grows
//--------------------------------------------------------------------//
once nBub = 0
IF isAnyVis THEN
   IF isBigVis THEN
      bSize = 5
   ELSIF isMedVis THEN
      bSize = 4
   ELSE
      bSize = 3
   ENDIF
   // volume formatted as K / M / B
   IF volume >= 1000000000 THEN
      vFmt = round(volume / 1000000000 * 100) / 100
      vUnit = 3
   ELSIF volume >= 1000000 THEN
      vFmt = round(volume / 1000000 * 100) / 100
      vUnit = 2
   ELSIF volume >= 1000 THEN
      vFmt = round(volume / 1000 * 100) / 100
      vUnit = 1
   ELSE
      vFmt = round(volume)
      vUnit = 0
   ENDIF
   slot = nBub - floor(nBub / maxBubbles) * maxBubbles
   $bX[slot] = barindex
   $bY[slot] = bubY
   $bGap[slot] = (high - low) * 0.3
   $bSz[slot] = bSize
   $bSell[slot] = isSell
   $bV[slot] = vFmt
   $bU[slot] = vUnit
   $bRt[slot] = round(volRatio * 10) / 10
   nBub = nBub + 1
ENDIF
IF islastbarupdate AND nBub > 0 THEN
   nDraw = min(nBub, maxBubbles)
   FOR i = 0 TO nDraw - 1 DO
      IF $bSell[i] = 1 THEN
         bR = sellR
         bG = sellG
         bB = sellB
         bA = sellA
      ELSE
         bR = buyR
         bG = buyG
         bB = buyB
         bA = buyA
      ENDIF
      xB = $bX[i]
      yB = $bY[i]
      IF $bSz[i] = 5 THEN
         DRAWPOINT(xB, yB, 5) COLOURED(bR, bG, bB, bA)
      ELSIF $bSz[i] = 4 THEN
         DRAWPOINT(xB, yB, 4) COLOURED(bR, bG, bB, bA)
      ELSE
         DRAWPOINT(xB, yB, 3) COLOURED(bR, bG, bB, bA)
      ENDIF
      // numbers inside the bubble
      IF showLabels = 1 THEN
         IF labelContent = 2 THEN
            vY = yB + $bGap[i] / 2
            rY = yB - $bGap[i] / 2
         ELSE
            vY = yB
            rY = yB
         ENDIF
         vFmt = $bV[i]
         rFmt = $bRt[i]
         IF labelContent = 0 OR labelContent = 2 THEN
            IF $bU[i] = 3 THEN
               DRAWTEXT("#vFmt#B", xB, vY, sansserif, standard, 9) COLOURED(0, 0, 0)
            ELSIF $bU[i] = 2 THEN
               DRAWTEXT("#vFmt#M", xB, vY, sansserif, standard, 9) COLOURED(0, 0, 0)
            ELSIF $bU[i] = 1 THEN
               DRAWTEXT("#vFmt#K", xB, vY, sansserif, standard, 9) COLOURED(0, 0, 0)
            ELSE
               DRAWTEXT("#vFmt#", xB, vY, sansserif, standard, 9) COLOURED(0, 0, 0)
            ENDIF
         ENDIF
         IF labelContent = 1 OR labelContent = 2 THEN
            DRAWTEXT("#rFmt#x", xB, rY, sansserif, standard, 9) COLOURED(0, 0, 0)
         ENDIF
      ENDIF
   NEXT
ENDIF
//--------------------------------------------------------------------//
// NO VOLUME WARNING
//--------------------------------------------------------------------//
once cumVol = 0
cumVol = cumVol + volume
IF islastbarupdate AND cumVol = 0 THEN
   DRAWTEXT("NO VOLUME DATA: this instrument does not provide volume, Volume Bubbles needs it", 0, 0, sansserif, bold, 14) COLOURED(255, 0, 0) ANCHOR(middle, xshift, yshift)
ENDIF
RETURN
Conclusion
Volume Bubbles turns the volume question into something you can read on the price chart: which bars traded unusually, how unusual they were, and which side was pushing. The percentile and consensus logic keeps the signals meaningful across instruments with very different volume profiles.