

SuperTrend + Relative Volume (Percentile)
Introduction
The classic SuperTrend is a price-only regime follower: an ATR band flips above or below price and stays there until price crosses through. It is fast, clean and — because it ignores volume entirely — prone to firing on thin, low-conviction breaks that reverse within a few bars.
The original SuperTrend + Relative Volume by FluxCharts on TradingView tackles this by attaching a probabilistic volume filter to the SuperTrend flip: every trend break is scored against a history of past breaks using Kernel Density Estimation (KDE), and the indicator only confirms the signal when the current relative volume ranks above a user-defined percentile of the historical distribution.
This ProBuilder adaptation keeps the full pipeline — SuperTrend, buy/sell volume classification, relative-volume ratio, confirmation threshold, gradient colouring and break labels — but replaces KDE with a direct empirical percentile rank on a FIFO of the last N break samples. The result is numerically equivalent for this use case, much simpler to reason about, and noticeably cheaper to compute on long histories.
Theory Behind the Indicator
SuperTrend Base
The SuperTrend is constructed from two candidate bands built on the bar’s midpoint:
src     = (high + low) / 2
candUp  = src + atrMult · ATR(atrLength)
candDn  = src − atrMult · ATR(atrLength)
The persisted bands follow a “sticky” rule designed to avoid chattering:
- The lower band only raises (never lowers) while price stays above it — so the support tightens under a running uptrend.
- The upper band only lowers (never rises) while price stays below it — so the resistance tightens under a running downtrend.
- A break is declared when close crosses the active band.
The indicator exposes stDir (+1 bearish / −1 bullish) and two event flags, bullBreak and bearBreak, fired exactly on the bar where the regime flips.
Buy / Sell Volume Classification
Before the volume can be ranked, it must be split into a buy component and a sell component. The classic “close-within-range” heuristic is used:
buyVolRaw  = volume · (close − low)  / (high − low)
sellVolRaw = volume · (high  − close) / (high − low)
If the close is at the high, 100 % of the bar’s volume is attributed to buyers; at the low, 100 % to sellers; halfway, 50/50. On bars where high = low (no range), the split defaults to 50/50.
Relative Volume as a Short/Long EMA Ratio
The relative volume is the ratio of a fast EMA (10) to a slow EMA (barLength, default 25) of the buy and sell components respectively:
buyVol  = EMA(10, buyVolRaw)  / EMA(barLength, buyVolRaw)
sellVol = EMA(10, sellVolRaw) / EMA(barLength, sellVolRaw)
A value of 1.0 means the current buying (selling) activity matches its recent 25-bar baseline. 2.0 means it is running at twice the baseline, 0.5 at half.
This is a relative metric, not an absolute one — it stays comparable across assets and timeframes without rescaling.
Percentile Ranking Replaces KDE
The FluxCharts original treats every past break as a sample, fits a Gaussian Kernel Density Estimate over those samples, and asks: what is the probability mass of the KDE that lies below the current relative volume? That probability is the signal’s “conviction score”.
KDE is an elegant tool when the underlying distribution matters — typically for visualisation or density reconstruction. For a threshold filter, the only quantity that matters is the rank of the current observation within the historical sample. The empirical cumulative distribution — literally count how many historical samples are ≤ current / total samples — answers that question directly:
rank = count_i( sample_i ≤ current ) / N
This is a non-parametric, bandwidth-free, assumption-free estimator of the same probability KDE approximates. On a FIFO of 100 samples it converges to a smooth curve as N grows, without any of KDE’s pitfalls (bandwidth choice, boundary artefacts, reflection).
The ProBuilder version stores break samples in two FIFO arrays ($bullVols for bullish breaks, $bearVols for bearish breaks), each capped at maxSamples entries (default 100). When a new break fires, its relative volume is ranked against the appropriate FIFO:
volumeProb = rank of buyVol in $bullVols    // on bullBreak
volumeProb = rank of sellVol in $bearVols   // on bearBreak
The result is a number between 0 and 1 — and is the same probability FluxCharts’ KDE computes, just estimated empirically rather than smoothed.
Threshold Gate and Final Direction
The confirmation rule is:
- If actEnabled = 1, the break is only confirmed when volumeProb ≥ actThreshold / 100 (default 70 %).
- If actEnabled = 0, every break is confirmed (the indicator behaves as a classic SuperTrend).
A confirmed bullish break sets finalDir = 1; a confirmed bearish break sets finalDir = 0. Between breaks, finalDir holds its previous value — so the “active” state persists until the next confirmed break, regardless of whether the SuperTrend has already flipped back.
Key Features at a Glance
| Feature | Behaviour |
|---|---|
| SuperTrend base | Classic ATR bands with sticky persistence logic |
| Buy / sell volume split | Close-within-range classifier, 50/50 fallback on zero-range bars |
| Relative volume | Fast EMA(10) / slow EMA(25) ratio on each side |
| Percentile scoring | Empirical rank of current break against last 100 break samples |
| Threshold gate | Optional, default 70 % percentile |
| Gradient fill | Colour between bar midpoint and SuperTrend line, alpha modulated by `volumeProb` |
| Break arrows | Up / down arrows on confirmed breaks only |
| Volume labels | `"Vol:NN%"` text at the break, if `showLabels = 1` |
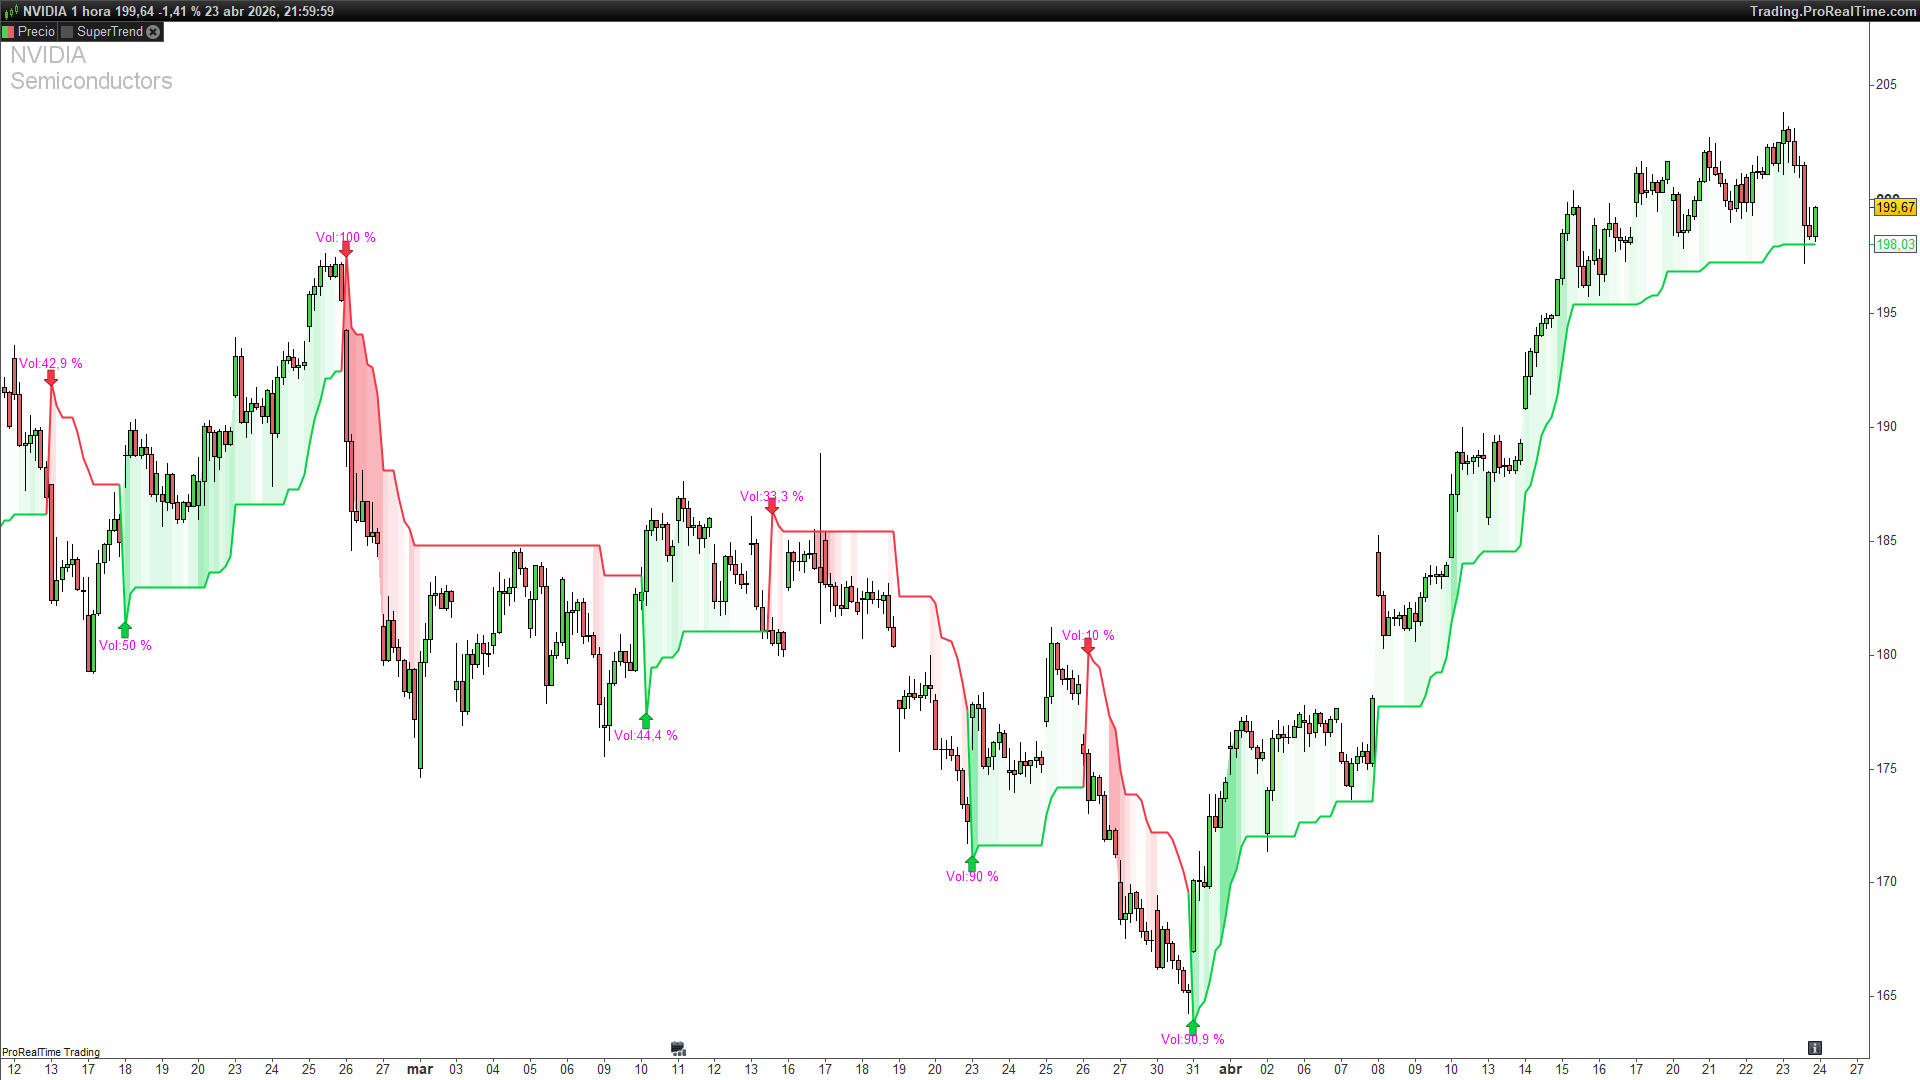
How to Read the Indicator
- The SuperTrend line itself — green in bullish regime, red in bearish, grey in the “waiting” state between a raw break and its confirmation. The line tells you the underlying ATR trend; the colour tells you whether the last break was confirmed by volume.
- The alpha intensity of the gradient fill — the fill between the midpoint and the SuperTrend line is transparent when volumeProb is low and saturated when it is high. On a confirmed break with 95 % percentile you will see a near-solid colour; on a weak break in the grey zone you will see a faint tint. This is a continuous conviction read, not a binary one.
- Arrow + label on breaks — the label prints Vol:NN%, the exact percentile of the break’s volume against its own history. A Vol:95 % break is a historically high-volume regime change; a Vol:50 % one is median, and will only pass the gate if actThreshold has been lowered.
- Disabling the threshold (actEnabled = 0) gives you the classic SuperTrend plus a volume meter — every flip is marked, the percentile tells you after the fact how unusual it was. Useful for building intuition before enabling the gate.
Practical Applications
- Filter-mode trading. With actEnabled = 1 and actThreshold = 70 the indicator suppresses roughly 70 % of raw SuperTrend flips — the lowest-volume ones, which are the ones most likely to be noise. The remaining 30 % are the higher-conviction regime changes.
- Regime confirmation for breakout systems. Feed finalDir into any breakout rule (open = 1 when finalDir = 1, close when it flips). The volume gate adds a confirmation layer that a price-only system lacks.
- Volume-percentile context on the rest of the chart. Keeping actEnabled = 0 and watching the Vol:NN% labels builds a feel for what “high volume” means on this instrument on this timeframe — a number that, in absolute terms, varies by orders of magnitude between a small-cap stock and a futures contract, but that is always bounded in [0, 100] in percentile form.
- Calibrating actThreshold. Start at 70. If the instrument is thinly traded or the timeframe is very fast, percentiles will be noisier — raise the threshold to 80 or 85. On heavy markets (index futures, major FX) the volume signal is more stable and 60 is often enough.
Indicator Configuration
| Parameter | Default | Description |
|---|---|---|
| `atrLength` | 10 | ATR length for the SuperTrend bands |
| `atrMult` | 3 | ATR multiplier (band half-width) |
| `maxSamples` | 100 | Size of the FIFO ring buffer per side (bull / bear) |
| `barLength` | 25 | Slow EMA length for the relative-volume ratio |
| `actThreshold` | 70 | Percentile threshold (%) required to confirm a break |
| `actEnabled` | 0 | 1 = apply the threshold gate, 0 = confirm every break |
| `showLabels` | 1 | 1 = print `Vol:NN%` on each confirmed break |
The defaults are deliberately close to the FluxCharts original. The two knobs worth exploring are actThreshold (the gate’s strictness) and barLength (the baseline of the relative-volume ratio, which controls how much of a “short-term spike” the buy/sell volume has to be to score high).
Implementation Notes
Translating this indicator to ProBuilder surfaced a few decisions worth documenting for anyone porting volume-filter logic from Pine.
1. KDE → empirical percentile. The original uses a Gaussian KDE over break samples, which requires a bandwidth parameter and is sensitive to sample size. The replacement loop — a single FOR that counts how many historical samples are ≤ current — is asymptotically equivalent to KDE for a threshold comparison (both estimate the same CDF), bandwidth-free, and roughly an order of magnitude cheaper per bar:
pctCount = 0
for i = 1 to bullCount do
    if $bullVols[i] <= buyVol then
        pctCount = pctCount + 1
    endif
next
volumeProb = pctCount / bullCount
Accuracy is bounded by the FIFO size (1/100 = 1 percentile point of resolution), which is more than enough for a threshold gate.
2. FIFO via DOWNTO shift, not a ring buffer index. A proper ring buffer with a rotating write pointer would be more efficient, but it complicates the ranking loop (which needs to skip the “unused” slots before the buffer fills). The DOWNTO shift pattern — when full, drop the oldest by shifting everyone down and write to the tail — is simple, correct and only runs on break bars (infrequent by construction):
if bullCount >= maxSamples then
    for i = 1 to maxSamples - 1 do
        $bullVols[i] = $bullVols[i + 1]
    next
    $bullVols[maxSamples] = buyVol
else
    bullCount = bullCount + 1
    $bullVols[bullCount] = buyVol
endif
3. “Sticky” SuperTrend bands must persist. ProBuilder’s default behaviour is to recompute every variable from scratch on every bar. The band persistence logic — the lower band can only rise, never fall, while price stays above it — requires explicit self-reference to the previous bar’s value, via prevLower = lowerST[1]. Without that step the indicator collapses to two bare ATR bands and the whole flip logic breaks.
4. finalDir = finalDir in the else branch. ProBuilder has no implicit “carry-forward” for scalars assigned conditionally. If finalDir is only set inside if bullCond / elsif bearCond, the compiler does not keep its previous value between breaks. The explicit else finalDir = finalDir line is the idiomatic “no change” pattern — it is a no-op on one bar, but it tells the language that the variable’s state should carry between bars.
5. Alpha modulation via colorbetween. The FluxCharts original uses a Pine-specific gradient fill. ProBuilder’s colorbetween(series1, series2, r, g, b, alpha) fills the region between two series with a single colour whose alpha can itself be a variable. Setting alpha = round(3 + volumeProb · 117) produces a fill that fades to nearly transparent at volumeProb ≈ 0 and saturates at ≈ 1, reproducing the Pine gradient’s visual logic with a single native call.
6. Text labels via #var# interpolation. drawtext(“Vol:#volPct#%”, …) inlines the variable’s runtime value into the string — the ProBuilder equivalent of Pine’s string concatenation. The variable must exist at the moment the drawing is emitted.
Code
//---------------------------------------------------------------//
// PRC_SuperTrend + Relative Volume (Percentile)
// Adapted from PineScript (FluxCharts) to ProBuilder
// KDE replaced by empirical percentile ranking
// version = 0
// Iván González @ www.prorealcode.com
// Sharing ProRealTime knowledge
//---------------------------------------------------------------//

//-----Inputs----------------------------------------------------//
atrLength = 10        // ATR Length
atrMult = 3           // ATR Multiplier
maxSamples = 100      // Max break samples (bins in original)
barLength = 25        // Relative Volume EMA Length
actThreshold = 70     // Activation Threshold % (0-100)
actEnabled = 0        // 1=Enable Threshold Gate
showLabels = 1        // 1=Show Vol% labels on breaks

//-----ATR & SuperTrend (ML Adaptive pattern)--------------------//
myATR = averagetruerange[atrLength](close)
src = (high + low) / 2
candUp = src + atrMult * myATR
candDn = src - atrMult * myATR

ONCE upperST = candUp
ONCE lowerST = candDn
prevUpper = upperST[1]
prevLower = lowerST[1]

IF (candDn <= prevLower AND close[1] >= prevLower) THEN
    lowerST = prevLower
ELSE
    lowerST = candDn
ENDIF

IF (candUp >= prevUpper AND close[1] <= prevUpper) THEN
    upperST = prevUpper
ELSE
    upperST = candUp
ENDIF

ONCE stValue = src
prevST = stValue[1]

IF barindex = 0 THEN
    stDir = 1
ELSE
    IF prevST = prevUpper THEN
        IF close > upperST THEN
            stDir = -1
        ELSE
            stDir = 1
        ENDIF
    ELSE
        IF close < lowerST THEN
            stDir = 1
        ELSE
            stDir = -1
        ENDIF
    ENDIF
ENDIF

IF stDir = -1 THEN
    stValue = lowerST
ELSE
    stValue = upperST
ENDIF

// Trend flags & breaks
bull = stDir = -1
bear = stDir = 1
bullBreak = bull AND bull[1] = 0
bearBreak = bear AND bear[1] = 0

//-----Buy/Sell Relative Volume----------------------------------//
IF high <> low THEN
    buyVolRaw = volume * (close - low) / (high - low)
    sellVolRaw = volume * (high - close) / (high - low)
ELSE
    buyVolRaw = volume * 0.5
    sellVolRaw = volume * 0.5
ENDIF

buyVolAvg = average[barLength,1](buyVolRaw)
buyVolShort = average[10,1](buyVolRaw)
sellVolAvg = average[barLength,1](sellVolRaw)
sellVolShort = average[10,1](sellVolRaw)

IF buyVolAvg > 0 THEN
    buyVol = buyVolShort / buyVolAvg
ELSE
    buyVol = 1
ENDIF

IF sellVolAvg > 0 THEN
    sellVol = sellVolShort / sellVolAvg
ELSE
    sellVol = 1
ENDIF

//-----FIFO Arrays (volume on breaks)----------------------------//
ONCE bullCount = 0
ONCE bearCount = 0

IF bullBreak AND volume > 0 THEN
    IF bullCount >= maxSamples THEN
        FOR i = 1 TO maxSamples - 1 DO
            $bullVols[i] = $bullVols[i + 1]
        NEXT
        $bullVols[maxSamples] = buyVol
    ELSE
        bullCount = bullCount + 1
        $bullVols[bullCount] = buyVol
    ENDIF
ENDIF

IF bearBreak AND volume > 0 THEN
    IF bearCount >= maxSamples THEN
        FOR i = 1 TO maxSamples - 1 DO
            $bearVols[i] = $bearVols[i + 1]
        NEXT
        $bearVols[maxSamples] = sellVol
    ELSE
        bearCount = bearCount + 1
        $bearVols[bearCount] = sellVol
    ENDIF
ENDIF

//-----Percentile Ranking (replaces KDE)-------------------------//
volumeProb = 0.5

IF bull AND bullCount > 0 THEN
    pctCount = 0
    FOR i = 1 TO bullCount DO
        IF $bullVols[i] <= buyVol THEN
            pctCount = pctCount + 1
        ENDIF
    NEXT
    volumeProb = pctCount / bullCount
ENDIF

IF bear AND bearCount > 0 THEN
    pctCount = 0
    FOR i = 1 TO bearCount DO
        IF $bearVols[i] <= sellVol THEN
            pctCount = pctCount + 1
        ENDIF
    NEXT
    volumeProb = pctCount / bearCount
ENDIF

//-----Threshold & Final Direction-------------------------------//
IF actEnabled THEN
    thresholdOK = volumeProb >= actThreshold / 100
ELSE
    thresholdOK = 1
ENDIF

bullCond = bullBreak AND thresholdOK
bearCond = bearBreak AND thresholdOK

IF bullCond THEN
    finalDir = 1
ELSIF bearCond THEN
    finalDir = 0
ELSE
    finalDir = finalDir
ENDIF

//-----Colors----------------------------------------------------//
IF finalDir AND bull THEN
    sr = 0
    sg = 209
    sb = 66
    lineAlpha = 255
ELSIF finalDir = 0 AND bear THEN
    sr = 242
    sg = 54
    sb = 70
    lineAlpha = 255
ELSE
    sr = 128
    sg = 128
    sb = 128
    lineAlpha = 50
ENDIF

// Alpha: volumeProb 0->transparent, 1->visible
stAlpha = round(3 + volumeProb * 117)

//-----Drawing---------------------------------------------------//
midPrice = (open + close) / 2
colorbetween(midPrice, stValue, sr, sg, sb, stAlpha)

IF bullCond THEN
    drawarrowup(barindex, stValue * 0.999) coloured(0, 209, 66)
ENDIF
IF bearCond THEN
    drawarrowdown(barindex, stValue * 1.001) coloured(242, 54, 70)
ENDIF

IF showLabels THEN
    volPct = round(volumeProb * 100, 1)
    IF bullCond THEN
        drawtext("Vol:#volPct#%", barindex, stValue - myATR * 0.35) coloured("fuchsia")
    ENDIF
    IF bearCond THEN
        drawtext("Vol:#volPct#%", barindex, stValue + myATR * 0.35) coloured("fuchsia")
    ENDIF
ENDIF

RETURN stValue as "SuperTrend" coloured(sr, sg, sb) style(line, 2)
