Anderson Regression Line Stretch ARLS

v10.3
Anderson Regression Line Stretch ARLS

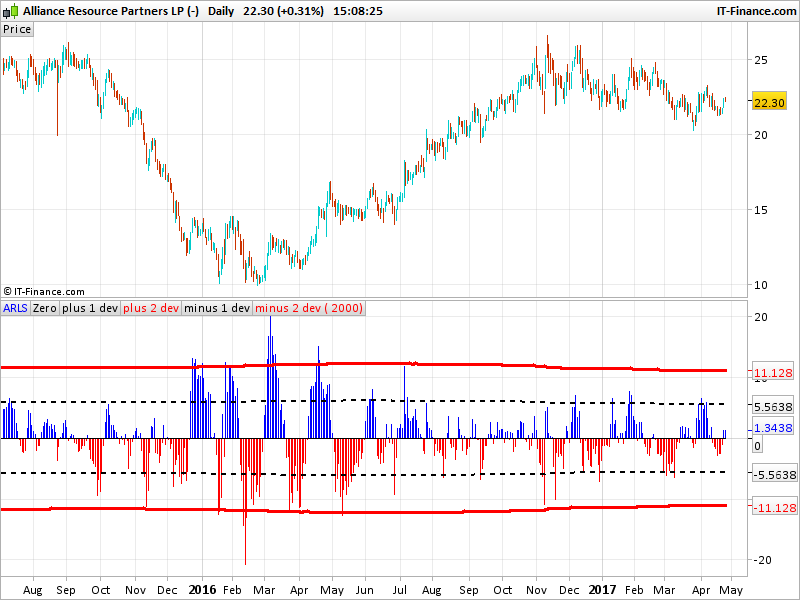
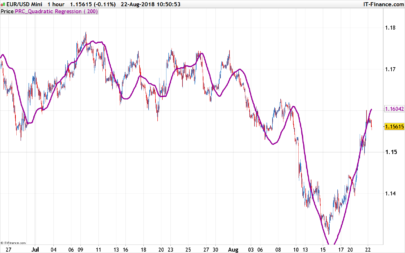
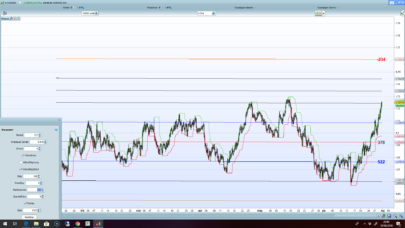
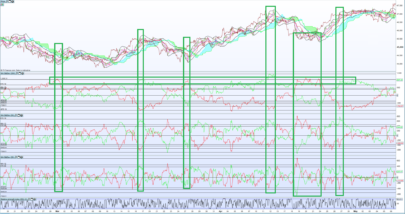
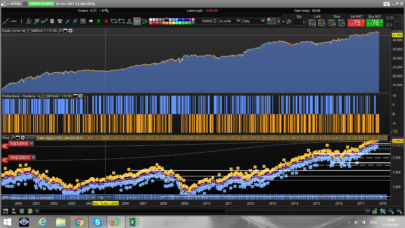
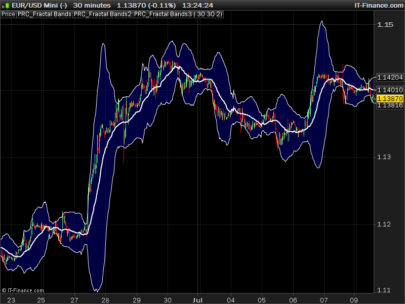
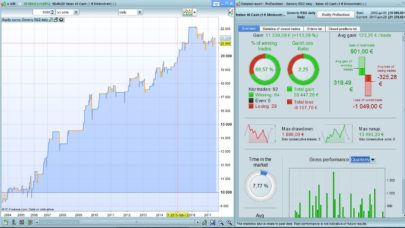
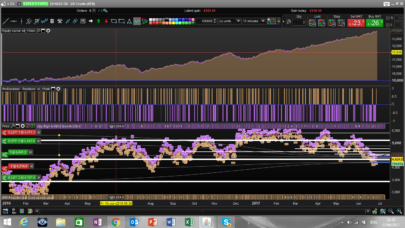
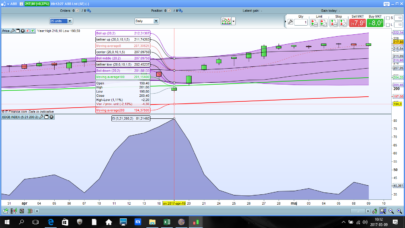
The Anderson Regression Line Stretch (ARLS) is an oscillator indicator conceptualised by me inspired by this paper that I found online (http://www.vantharp.com/Tharps-Thoughts/608_Dec_19_2012.html). The indicator measures the distance that price has moved away from its 30 period linear regression line expressed as a percentage of the current market price. If markets are orderly, price should not “stretch” too far away from the 30 period regression line. Therefore, statistically aberrant “stretches” beyond 2 standard deviations should be analysed by the trader. In order to make the indicator more useful, we apply +/- 2 & +/- 3 standard deviation lines on the ARLS oscillator. We deliberately do not plot a +/-1 standard deviation as this captures 68% of oscillation and it is the extreme moves (i.e. 2 & 3 standard deviations) that we want to identify for trading set ups. When the ARLS moves beyond the 2 standard deviation level, this should be noted and the trader should look at price action to see where price is in the context of the overall market trend. Markets that have experienced a prolonged up/downtrend and have moved beyond 2 standard deviations should be on watch for a statistical reversion. The price reversion should, at a minimum, go back to the 30 period regression line, which is interpreted as the current direction of travel for price. Another scenario is for price to remain steady and the regression line to catch up with price. The indicator is best combined with other statistical price observations such as ATR multiples and Bollinger bands to add context to the ARLS.

Text excerpt from the definition of the indicator posted by rowestock in this topic: https://www.prorealcode.com/topic/anderson-regression-line-stretch/

The upper and lower bands made of 2 and 3 standard deviation of the oscillator is calculated within the last ‘deviationP’ period which can be enlarged to get a more statistical deviation of the whole data set. Be sure that your current chart has enough bars to calculate completely this period.


Share this

Risk disclosure:

No information on this site is investment advice or a solicitation to buy or sell any financial instrument. Past performance is not indicative of future results. Trading may expose you to risk of loss greater than your deposits and is only suitable for experienced investors who have sufficient financial means to bear such risk.

ProRealTime ITF files and other attachments : How to import ITF files into ProRealTime platform?

PRC is also on YouTube, subscribe to our channel for exclusive content and tutorials

  1. Maxime Baudin • 04/26/2017 #

    Nice, thanks!

  2. rowestock • 04/26/2017 #

    Hi Nicolas,
    I am revisiting this indicator and wanted to ask, is it possible to replace style(histogram) with style(candle) in the code?
    I want to see extremes and the wicks of candles as the histogram can’t show me that.
    Hope this is possible!

    • Nicolas • 04/26/2017 #

      Why not, please add a new request in our probuilder forums.

avatar
Register or

Likes

avatar avatar avatar avatar avatar avatar avatar avatar avatar avatar avatar avatar avatar
Related users ' posts
Gianluca Hello Nicolas, my prt become stuck when i load the indicator, is there any problem with it?
m-zeter Has anyone found a solution for Sofitech? Would it be possible to draw two lines? An upper l...
m-zeter Hm, i dont know exactly why, but I think, that the indicator needs lots of power. I need als...
Marcot18 Buonasera Maurinho, interessante l'indicatore che ha i proposto ma ancora di più interessant...
maurinho ciao marcot18 l'indicatore pubblico /proffessional lo puoi scaricare si chiama progo di will...
james effiong This strategy looks good
anametsinwha Is it possible to change it to highs and lows rather than open and close?
apachx Hi. Please, describe the algorithm in words. I want to understand how it works, but for now...
Madrosat Bonjour Nicolas la formule du stop loss est elle vraiment valable ?? il n'y a pas au depart ...
Nicolas Il y a peut-être un erreur en effet, essayer avec: set stop ploss (averagetruerange[14] * ...
Madrosat ok merci Nicolas c'est avec /pipsize que ça fonctionne
Francesco78 @snucke the results are not the same because the pictures refers to a few years ago. I am no...
snucke @Francesco78 i mean the results differ when i test on my own. so im curious of what the p...
sfl still working, using with filters like : trendFilterUp=close>average[190](close) tren...
Nicolas No sorry, please use this file instead into a prorealtime trading platform.
rdabbs I just installed this indicator. It opens in its own pane rather than overlaid on the chart ...
Nicolas Just apply it on your price chart instead and you're ok.
Wilko I am not familiar with the screener function, but I am quite certain it should be quite simp...
Gubben @Wilko have you had a look at this again since MTF support? Heard you talk on Börssnack btw..
Wilko @Gubben not really. It was something I posted to show that simpler is usually better. Hope y...
DANY overfit
fatlung Excuse me. I would like to the time zone applied to this strategy.
UkCoopDownUnder Hi, ProOrder does not recognise, "avfullnessthreshold" any ideas, thanks
KarlBenjamin This "indicator" alone has completely changed my algorithms for the better! Id even go as fa...
ashee CAN YOU SHARE MT4 FILE
coyP Big thanks ! Can you explain me how can I put this ON my graph and not under the graph please ?
diegofe_2000 cordial saludo NICOLAS , gracias por excelente indicador. ¿ es posible obtenerlo en MT4 ? ...
Nicolas Lo siento, pero no estoy trabajando para ayudar a la gente aquí de forma gratuita para promo...
diegofe_2000 Nicolas , gracias por tu atención. La pregunta era por curiosidad (yo no trabajo ni manejo ...
reb Hello Marc your strat seems very intersting, will take a look Reb
897148 What exactly is meant by Total price? Is r1 =28 in your example the no of days for "Total P...
larmhen
7 years ago
HerveS_67 Bonjour, A quoi correspondent les données S, M, L ? Hello, What do the data S, M, L?
Vinks_o_7 aux paramètres à rentrer : 5 20 et 200...
majid52026 Hi I want MBXF Timing for mq5 Does anyone have this indicator???
dertopen Hi Nicolas good work for the code translation when i chek the mbfx system site i see in t...
Nicolas Yes, just change the color by yourself in the indicator settings window.
JanWd Thank you for the coding, it seems promising. FTSE gives for the short term (5 min) promis...
Jan Wind 21.04.2019: I retested the strategy for the DAX 5 minutes , it works fine for 10.000 bars, b...
bertrandpinoy hello Francesco, are you still working on this strategy?
Nicolas You'll need to preload bars to get the good calculations of you indicators. I did not test i...
David Nicolas I tried DEFPARAM Preloadbars = 5000 And still the same drawn output of entries/exit...
marcara Hi, Thank you very much for the Moving Average Daily indicator, I am using it as indicator i...
rpreviteri Hi Nicolas, thanks a  loto for sharing your knowliedge, Wasn't the original momentum pinball...
air Thank you!  
elanoa Buonasera sig. Nicolas......sarebbe possibile far in modo che quando l'indicatore raggiunga ...
Dimi.A Perfect for counter-trend scalping. I like this!
viktorthuns Hi Nicolas! Great work you've done with all your indicators. Just wondering about the code a...
Nicolas the value is not a boolean but an average of an addition of booleans. As stated in the descr...

Top