Hello,
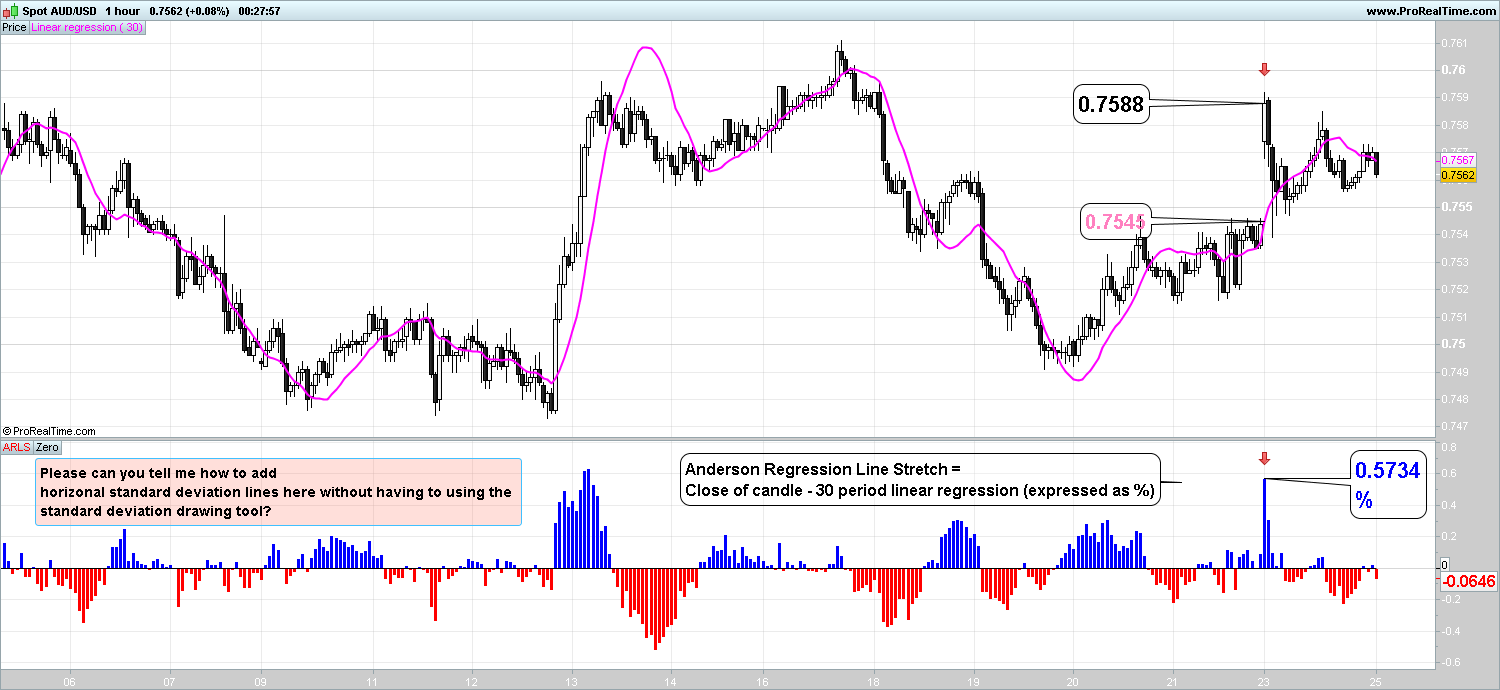
The Anderson Regression Line stretch measures the distance between the close of the candle and the 30 period linear regression expressed as a percentage.
The idea is that when price moves too far away from the 30 period regression line, that the price is “unfair” and near the end of its current move. The price sh0uld then revert back to a “fair” price, before the process starts again.
I should warn you this is my first attempt at writing code!
Q1. Please can you check the coding is correct?
Q2. Please could you improve the coding by making the indicator draw horizontal standard deviation lines on the indicator pane itself? e.g. +1SD & + 2SD together with -1SD & -2SD. I can draw standard deviation lines using the drawing tool, but I want the lines to display automatically as I change the timeframe on the chart.
If this works, my aim is to write code to give audible alerts to the trader to warn him that the price is stretching too far for the timeframe he is trading in.
// Define variables
a=LinearRegression[30](close)
b=Close

// Calculation of difference between the 30 period regression line and the last price expressed as a percentage of the current price
c=(b-a)/b*100
d=0

return c as "ARLS", d as "Zero"
Thanks, it looks great. What is the period of the standard deviation you’d like to be used? I mean, if you are using a short period, the deviation will move very fast with the oscillator (like a bollinger band) and with a longer one it will act more like a long term “statistical” threshold instead.
Hi Nicolas, I’ve attached a picture in excel to illustrate.
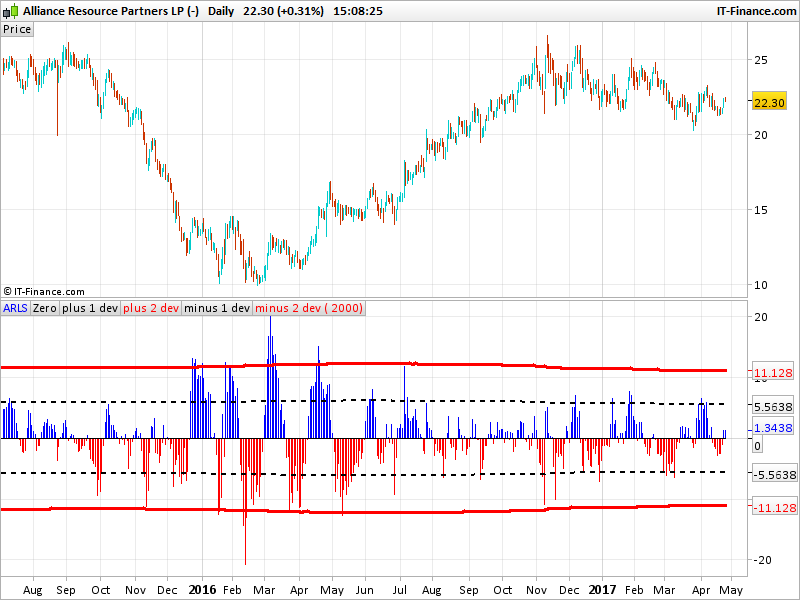
The longer the period studied to calculate the horizontal levels the better. I believe 10,000 units is the maximum?
I think it is important that the SD levels are calculated to cover as much data as possible. This helps to identify moves which are truly black swan or statistical aberrations versus just general noise.
I deliberately did not plot a +/- 1SD lines because I am only interested in moves that exceed +/-2 SD. Hope this helps!
P.S. I should mention that the calculations should be based on the time interval studied i.e. SD levels for the maximum possible number of days, hours, 15 min, 5 min etc (we assume 10,000).
I added a variable to set the lookback period for the standard deviation calculation. 10k bars mean that your chart must have +10.000 bars loaded and that’s not the case for some shares for instance, on a daily timeframe. So you can play with this setting if you want to.
You’ll find attached the modified indicator with the same look as your Excel example.
So I presume you are using this indicator as a mean reversion predictor? Do you have any more explanation about it please? I will certainly add it to the library for the benefit of everyone. Thank you.
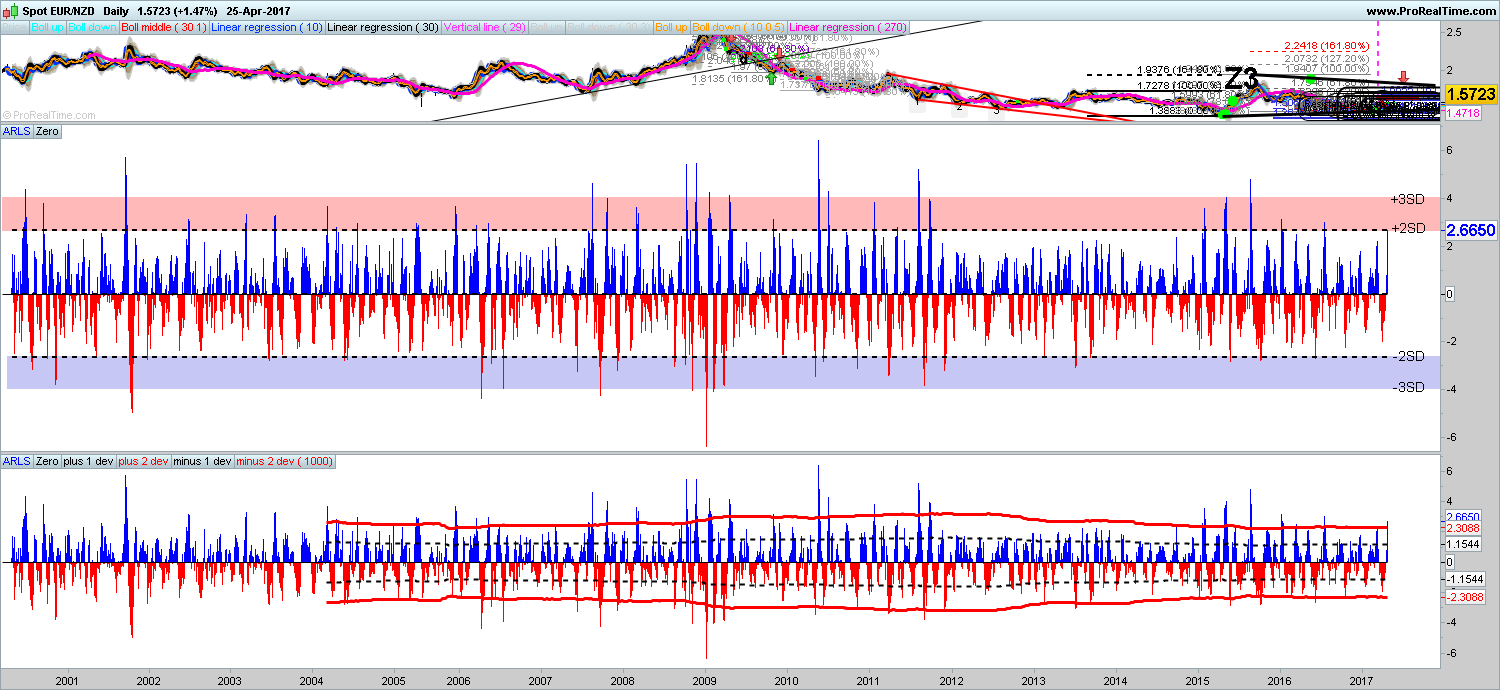
Hi Nicolas, I think you’ve set the standard deviations as +/-1 & +/-2. Could you correct to show the code for +/-2 & +/-3 instead?
Yes sorry, I’ll change it accordingly. Any chance to have explanations about the indicator or a strategy behind it? Thanks.
Thanks Nicolas, will wait to see the code adjusted.
———————————————————–
BACKGROUND TO INDICATOR
The Anderson Regression Line Stretch (ARLS) is an oscillator indicator conceptualised by me inspired by this paper that I found online (http://www.vantharp.com/Tharps-Thoughts/608_Dec_19_2012.html).
The indicator measures the distance that price has moved away from its 30 period linear regression line expressed as a percentage of the current market price. If markets are orderly, price should not “stretch” too far away from the 30 period regression line. Therefore, statistically aberrant “stretches” beyond 2 standard deviations should be analysed by the trader.
In order to make the indicator more useful, we apply +/- 2 & +/- 3 standard deviation lines on the ARLS oscillator. We deliberately do not plot a +/-1 standard deviation as this captures 68% of oscillation and it is the extreme moves (i.e. 2 & 3 standard deviations) that we want to identify for trading set ups.
When the ARLS moves beyond the 2 standard deviation level, this should be noted and the trader should look at price action to see where price is in the context of the overall market trend. Markets that have experienced a prolonged up/downtrend and have moved beyond 2 standard deviations should be on watch for a statistical reversion. The price reversion should, at a minimum, go back to the 30 period regression line, which is interpreted as the current direction of travel for price. Another scenario is for price to remain steady and the regression line to catch up with price.
The indicator is best combined with other statistical price observations such as ATR multiples and Bollinger bands to add context to the ARLS.
————————————– contd.
Thank you for your work thus far. I did plot a Bollinger band on the ARLS as a test and noticed the results were the same. This is a shame (c’est dommage!) as the ARLS is visually more appealing when the 2&3 standard deviation lines are horizontal and do not “bulge” (“gonfler”). Is there any way this be corrected? RSI lines are fixed at 70 and 30 and really we should be able to able to fix the standard deviation lines in the same way or at least let adjust as time and price progresses, but still remain horizontal. If I use the standard deviation drawing tool on the ARLS, the lines remain horizontal and fixed based on the data on the screen. Perhaps there is a way to take the code from the drawing tool and insert this?
I modified the indicator and it is now available to download in its library post: https://www.prorealcode.com/prorealtime-indicators/anderson-regression-line-stretch-arls/
Because Bollinger Bands are made of standard deviation around a simple moving average, it is obvious that you’ll get the same thing by applying it on the oscillator. It is bulged because you need to add a sufficient long period of analysis for the standard deviation to be more smoothed to the whole data set. That’s why I add the “deviationP” period into the indicator setting to play a bit with smoothing this information, recent deviation or a more averaged one? Depends of what you want!
EDIT: the deviation bands are not fixed because they are recalculated each new bar with the current bar include in the new calculation. If you only want the last deviation value drawn over the whole chart as a straight line, this is also possible, but you will not see the past behaviour of the indicator though.