Three lower (and higher) Closes John Carter’s Scalping Indicator

v10.3
Three lower (and higher) Closes John Carter’s Scalping Indicator

Hi to all,

I’m reading chapter 14 of John Carter’s “Mastering The Trade” (2nd edition), which describes a setup to open position after trend has changed and a three candle pattern has been formed.

For example, to go short following new trend when old trend was bullish, Carter says that you have to check for three consecutive lower closes, that means that reversal has been confirmed and trader has to go short at market.

At the same way, reversed rules are valid for bullish signal: after a reversal from a bearish to bullish, you have to check for three consecutive higher closes.

Carter adds a filter to avoid “Flags” (consolidation situations): in case of three lower closes, the close of the last two candles must be lower than the low of the first candle of the pattern; at the same way for bullish, the close of the last two candles must be higher than the high of the first candle of the pattern.

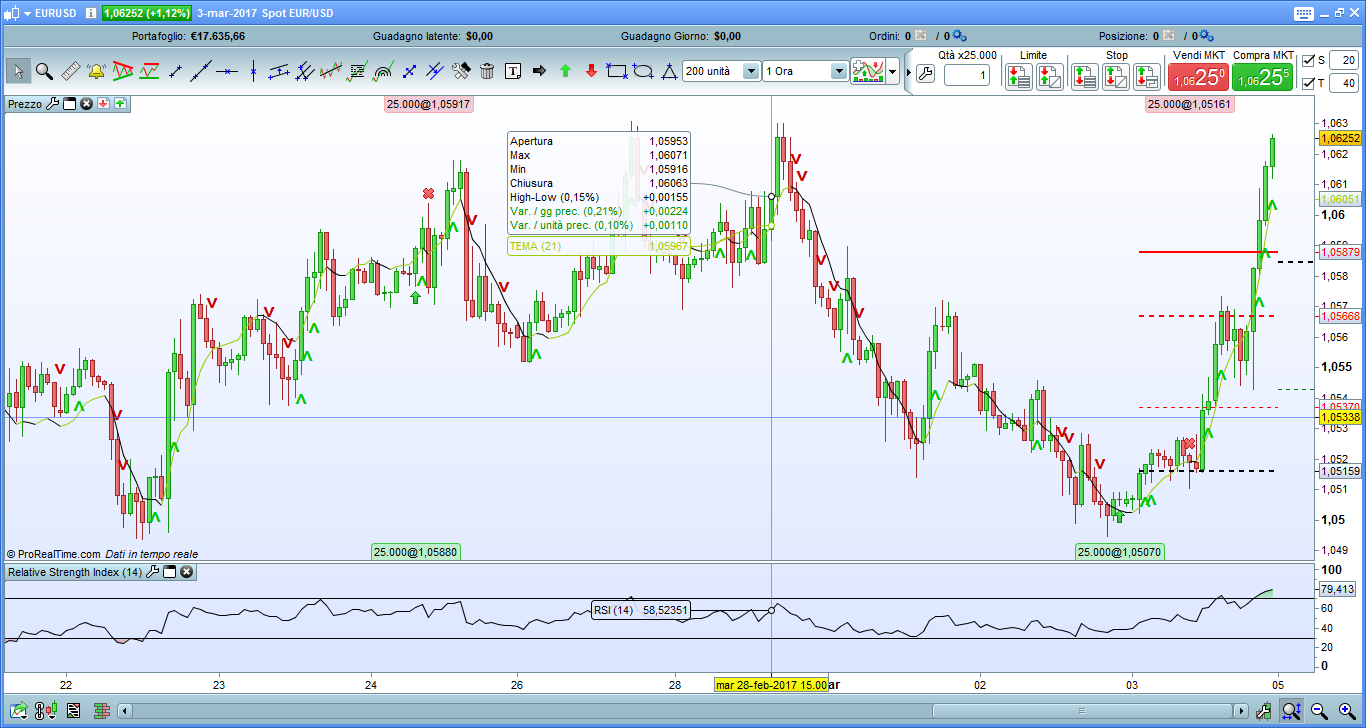
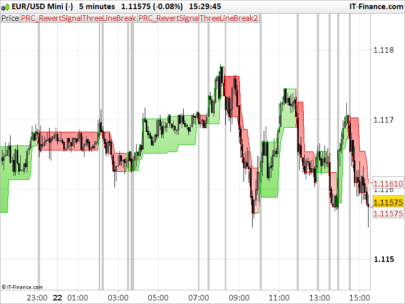
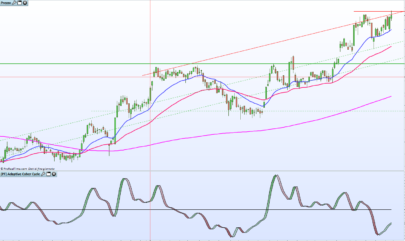
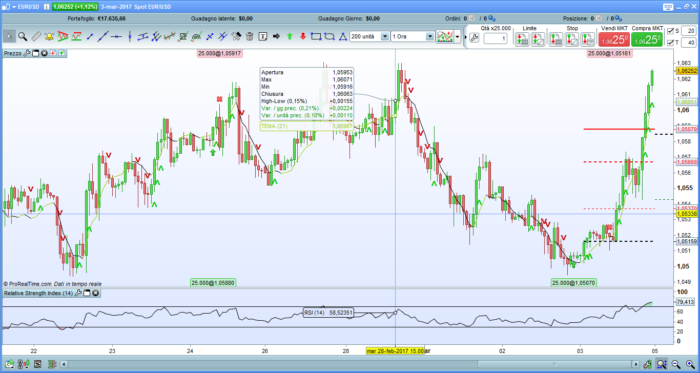
Using that rules, I tried to write an indicator that paint green (for bullish) an red (for bearish) arrows on the chart.

Note that when the first arrow is painted after a market reversal, You are on the market so You must ignore the following candles having the same color.

The original John Carter’s indicator for Trade Station put the signal to the first candle of the pattern. My indicator put the arrow to the third candle of the pattern, that is the entry candle.

Here’s the code:


Share this

Risk disclosure:

No information on this site is investment advice or a solicitation to buy or sell any financial instrument. Past performance is not indicative of future results. Trading may expose you to risk of loss greater than your deposits and is only suitable for experienced investors who have sufficient financial means to bear such risk.

ProRealTime ITF files and other attachments : How to import ITF files into ProRealTime platform?

PRC is also on YouTube, subscribe to our channel for exclusive content and tutorials
  1. zilliq • 03/06/2017 #

    Hi Francesco,
    Thanks for your code,
    There is a little error. You need to add the notion of reversal (-1/+1). Because without this you will have too much signal as you see on your picture
    Carter advice to take position to the third and exit wit hthe other signal
    Sadly, I do an algo last week and the results are not very fantastic…May be the things change since his book
    Regards
    Zilliq
     
    https://www.zilliqtradingresearch.fr/
    Coding is not a crime 😉
     

    • mikael • 03/06/2017 #

      Hi Zilliq!
      I don`t understand were to put the notion of  reversal (-1/+1). Can you please exlain or show in the code?
       
      Regards Mikael

  2. Sofitech • 03/06/2017 #

    Hello. How can we modify the code to have an alert on each arrow buy and sell…? RETURN…..So we can test it with an alert in Prorealtime ?

avatar
Register or

Likes

avatar avatar avatar avatar avatar avatar
Related users ' posts
Nicolas
8 years ago
AutoFlanders Quelqu'un a-t-il déjà remarqué, sur ce graphique, que les bougies montantes sont rouges et l...
lilo789 Bonjour, Merci Mr Nicolas pour ce très bon indicateur. Une excellente stratégie qui est t...
Nicolas Les codes postés sont libres et appartiennent à tous, faites en ce que vous voulez :)
bolsatonimora2 Hi, nice indicator, it´s possible to include a middle line with 50 value? ty!
gabri Hi, EMA26 approximate almost exactly the 50% line
Alain Wilder MA is exactly the 50% line
Nicolas
8 years ago
Loop Hi All! Would it be possible to have the same indicator with the MACD calculated with the DE...
Nicolas Why not, but do you think it would make such a noticeable difference?
Loop Good question Nicolas! That's why I was curious to check it! MACD based on DEMA is usually m...
Leo Hi Gabri, have you ever try this in a trading system?
gabri Leo, I used to crosscheck this indicator a long time ago. For the trading I was doing at tha...
Nolubok Bonjour Gabri, merci pour l'ensemble de vos publications, serait il possible d'avoir le scr...
bolsatrilera
8 years ago
Volume Stops
v10.3
Volume Stops
6
Indicators
Aragorna Hello, ask for a help, please. why the indicator in my PRT is in a different area and not in...
Nicolas Add it on the price chart: https://www.prorealcode.com/blog/video-tutorials/how-to-add-an-in...
Infanta Congratulations. Of all the indicators that I have been able to examine, in my opinion and f...
gabri
8 years ago
Alex975 Wilder personalmente lo definisco un poeta del trading..  Utilizzo alcuni strumenti di Wild...
AleX Vi faccio partecipi dell'evoluzione del mio studio, mi avete appassionato a Wilder che da ig...
gabri Grazie mille Alex!!  
wtangsiri Bonjour J'ai importé le fichier ITF en question, mais cela me donne, en bas de l'écran, un...
Nicolas Il faut ajouter l'indicateur sur le graphique du prix.
skuggan89 This is a great indicator, works very well!! Is there any algo based on this indicator that ...
gabri
8 years ago
Marcel Thank you for this one. I played around with this indicator with Bollinger Bands around it i...
Doctrading Hello, Higher timeframes are better. I suggest D1 or H4.Best regards,
Pinkybouh hello, I propose to add another conditions: ie: haussier: close > open and close >...
TheHovisTrader I'd be interested in the actual profit of this - in the example the stop range is at least 2...
Regan2020 Hi, has anybody update the above code to enable on a 15m or 5m TF?
gigi64 ik heb de code op mijn pro realtime gezet , en bij indicator staat hij erbij maar komt niet ...
gigi64 I have put the code on my pro realtime, and it is on the indicator, but it does not appear o...
supertiti Thanks you so much Lucassen
dreif123 hi, copied the above code, not working on 10.3 the system says "return can only be used at ...
LUCASSEN Hallo , i have no problem , and i have the same versie 10.3, maybe you can ask Nicolas, tha...
Nicolas
8 years ago
Nicolas Para cambiar los colores del histograma, deben usarse las variables r, gyb entre las líneas ...
leofib Hello, I was looking for a MACD Histogram with red and green bars according to the value of ...
Helgart Hi, it's great to have this option of having a histogram coloured based on rising or fall...
Nicolas Rien, il faut l'appliquer sur la charte. Soit le mettre sur le graphique du prix, à l'aide d...
signorini Merci pour votre réponse. Je l'applique sur la charte, j'utilise la petite clé pour effacer ...
signorini Je vous remercie, Nicolas. C'est fixé. Très bon week-end.
owes29 Hi is there anyway to develop this for the pro scanner on daily or hourly scans. so it woul...
Nicolas Of course, please add a query in the proscreener forum.
Bruno Carnazzi C'est dommage, cette histoire d'énergie fractale bousille complètement la précision de l'ind...
otty82  all right. thanks
mmichael Hello, I noticed that the indicator shows the initial balance of today but also for all the ...
leyoy Bonjour, comment l'adapter sur 15 minutes au lieu de 1 heures ... j'ai changé 090000 par 081...
Abz  hi , you need to add the indicator from the "price" menu in chart
Francesco Thank you Abz!
phanz Hi Nicolas, this is an interesting strategy. For long position, I assume entry when prices ...
Krallenmann Hallo Nicolas, kannst du mir die Regeln für den Halftrend Indikator sagen? Aus dem Code kann...
davefransman Dear Nicolas, i want set a alert on the "HalfTrend "custom moving average" met Heikin Ashi w...
Nicolas Please post the question in a new forum topic, that would need custom coding I believe.
jelogui merci beaucoup Nicolas, je m'en occupe.
zeD22 Hello There Nicolas, When i try to copy the code i get an Error says: the following varia...
Nicolas Download the itf file and import it.

Top