CCI Magic DID V1

v10.3
CCI Magic DID V1

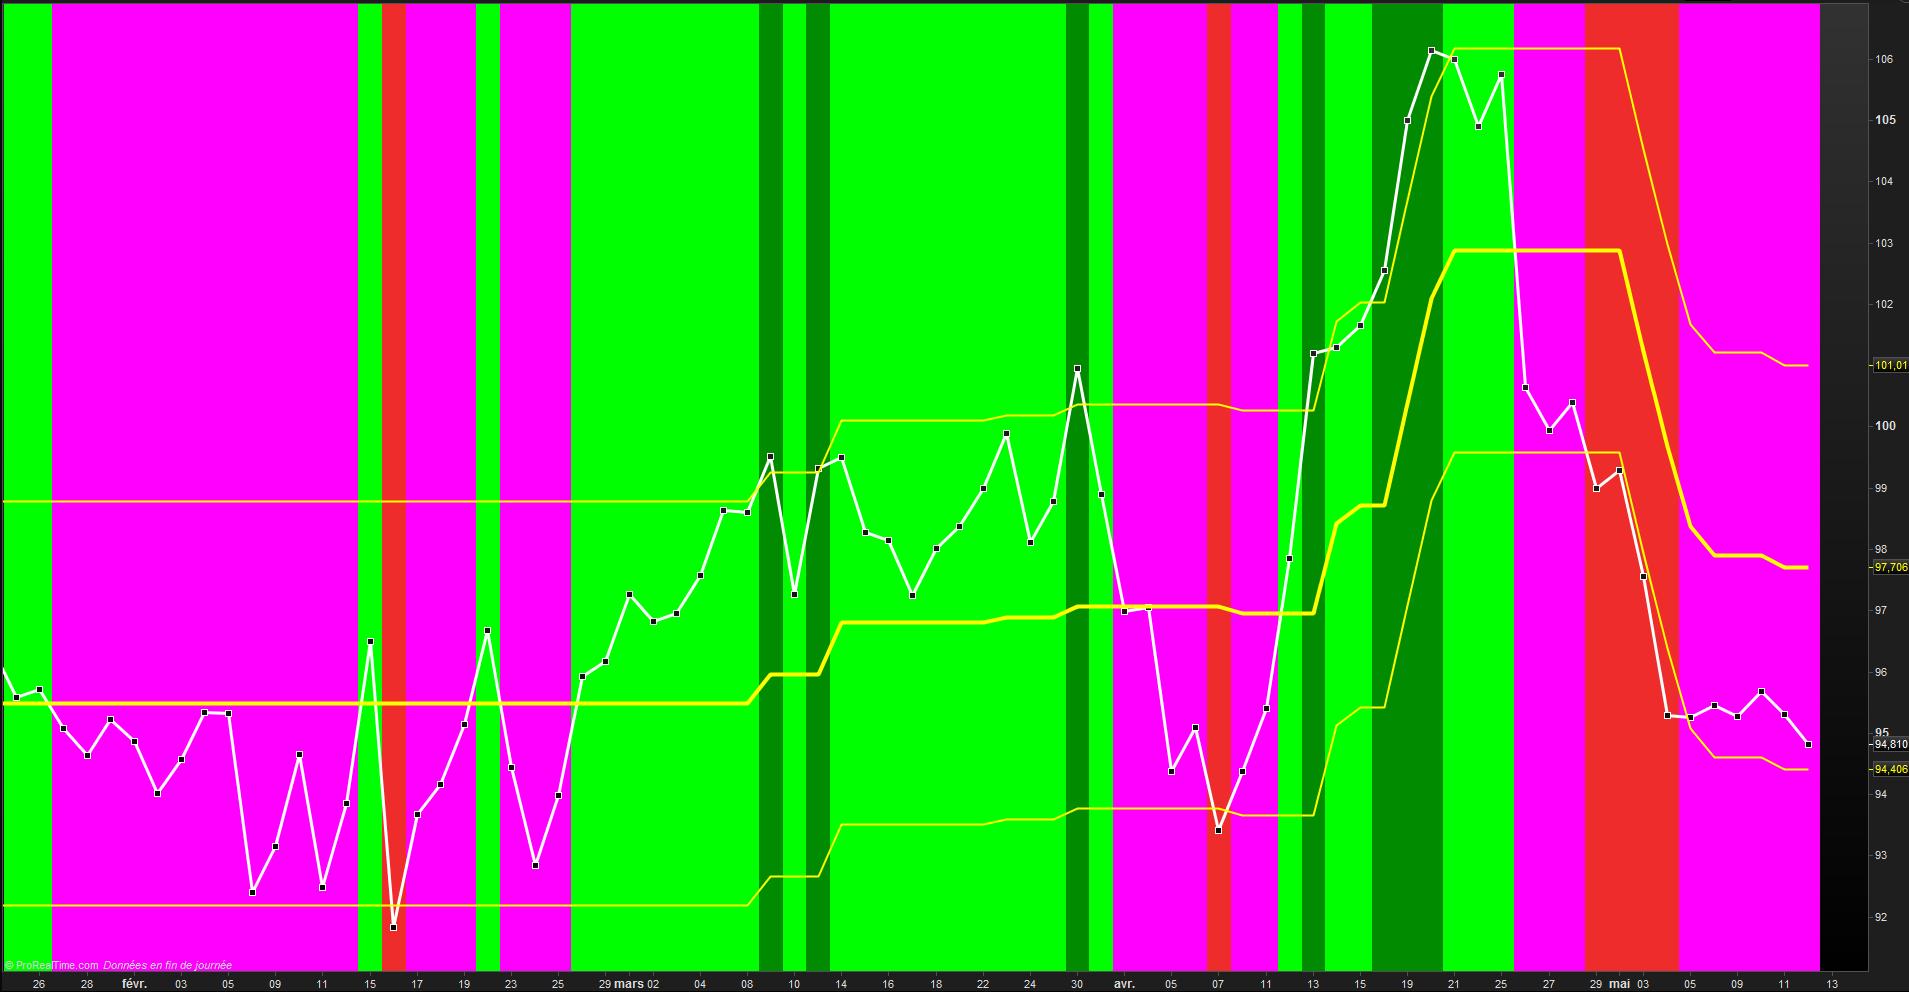
This indicator add a trend line on chart accordingly to the CCI value. It also painting background charts to identify bearish and bullish trend.

Share this

Risk disclosure:

No information on this site is investment advice or a solicitation to buy or sell any financial instrument. Past performance is not indicative of future results. Trading may expose you to risk of loss greater than your deposits and is only suitable for experienced investors who have sufficient financial means to bear such risk.

ProRealTime ITF files and other attachments : How to import ITF files into ProRealTime platform?

PRC is also on YouTube, subscribe to our channel for exclusive content and tutorials

  1. ÀNGEL PUJALT I GOMIS • 05/15/2016 #

    Lo instalo con el archivo y me da errores de síntaxis. A ver, si por favor, lo podéis arreglar. Saludos

  2. supertiti • 05/15/2016 #

    Hola Angel,
    No hay problema con el codigo. Lo comprobado  hoy con el codigo de la patalla y el fechero .itf. El problema viene de ti.
    un saludo
    Didier
     

  3. AngelPujalt • 05/15/2016 #

    pues no sé. Lo instalo con el fichero que adjuntas y me da errores de sintaxi.

  4. AngelPujalt • 05/15/2016 #

    en la beta 10.3 de prorealtime no me da problemas. Todo muy raro.

  5. AngelPujalt • 05/15/2016 #

    podrías por favor desarrollar un poco más la idea de este indicador.

  6. supertiti • 05/15/2016 #

    Primero tienes que leer un poco el manual de probuilder. aqui tienes las respuestas. el trading es ante todo un trabajo !  la 10.2 vs la 10.3 no es lo mismo !!
    saludos

  7. AngelPujalt • 05/15/2016 #

    pues lo leeré. Tienes razón esto de la bolsa es un trabajo.

  8. AngelPujalt • 05/15/2016 #

    Lo estoy probando con tu indicador y en velas semanales el Santander es alcista. Veremos como evoluciona la semana que viene. Saludos y gracias por contestarme tan rápido.  

  9. supertiti • 05/15/2016 #

    Hola Angel
    Las funciones backgroundcolor etc etc no funcionan con la version 10.2.
    Para saber mas sobre la 10.3  tu tienes un resumen muy completo de Nicolas dentro de ” documentacion” and ” graphical “

  10. AngelPujalt • 05/15/2016 #

    ok

  11. Lotech123 • 05/15/2016 #

    It may be a little late in the day, but having only just discovered this utility, I have messed around with various time frames and found that on the longer term Daily and Weekly chart, the tracking is quite clear, however on the very short term frames, it is necessary to experiment until a workable match is found by comparing with other indicators that might show the same trend characteristics. Thank you

avatar
Register or

Likes

avatar avatar avatar
Related users ' posts
2 Fast Two things stand out to me: I see a lot of horizontal blocks in the chart instead of vertica...
lkiklkik thanks for the hard work and sharing
adeelq79 Great work Ivan. Thanks
Quino Another really interesting indicator. It works very well on periods below 25. Just a few cos...
MaoRai54 hello, it seems to be very good, but I'm doing intraday and I'm getting very different forec...
Iván Hi! I use this indicator in daily basis. In intraday timeframes, volume changes a lot depend...
LucasBest Thanks for the translation. This one can be compared to dynamic zone RSI
sam00075 Accuracy is on point.
Mubin1308 Bonjour à tous, J'ai importé le fichier mais ça ne marche pas, rien qui s'affiche. Pourriez...
Iván
2 months ago
Iván Sorry... There is a mistake in line 76. Should be if openday[i]openday[i+1] then
DLVx You do not specify how to read the Calmar ratio. Above 1 is OK and 0 is neutral? Can you she...
lee HI thank you for this indicator. Is it possible to create a screener based on this for when ...
xpe74 Hello it seems the file format does not allow to import the file. At importation stage, an e...
Iván You always can copy/paste directly from the post
roccafragius Thank you so much, for my point of view very useful!!!
NicoGB67 Excelente trabajo!!
Jrmjrm Bonsoir est-il possible d'avoir cet indicateur, mais à la place du Wilder Average, utiliser ...
geroniman merci Ivan, super indicatuer. Les cours vont souvent toucher 50% des zones vertes ou rouges....
Iván Pour ajouter une ligne supplémentaire, il suffit de créer une nouvelle variable, par exemple...
Maurizio A. excellent indicateur ! comment puis-je modifier le code pour afficher uniquement les dernier...

Top