







Average (Daily) Range
Hello all,
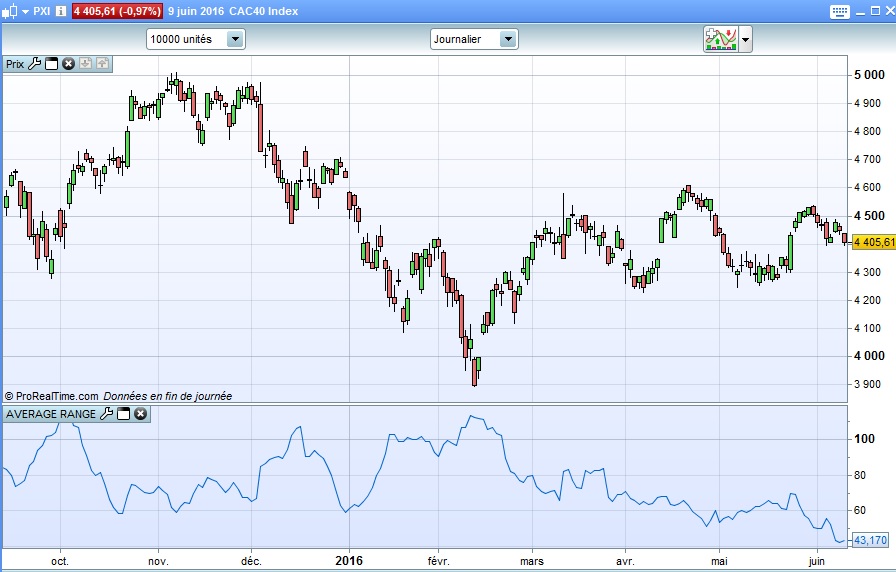
I was very surprised that I couln’t find the “Average Daily Range” indicator, although it is a very simple and important one.
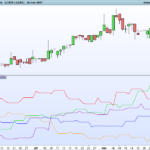
This simplified code can draw the ADR, but can also be applied to any timeframe.
So it would be the average range of the “p” last bars.
Beware, it is not the Average True Range.
// Amplitude moyenne (Average Range)

P = 10 // nombre de périodes

HAUTmoyen = average[p](high)
BASmoyen = average[p](low)
AMPLITUDEmoyenne = HAUTmoyen-BASmoyen

return AMPLITUDEmoyenne as "Average Range"
Comments
You must be logged in to post a comment.

Hello, I wanted to create a percent ADR based on this indicator, so I wrote this code that IMO it looks ok: // AVERAGE DAILY RANGE PERCENTAGE PMAXAVG = average[p](high) PMINAVG = average[p](low) PAVG = average [p] (close) ADRP = (PMAXAVG - PMINAVG)/PAVG*100 return ADRP as "Average Daily Range Percent" However, when I use it, it doesn't seem to give out correct values as it is giving me a higher value than the ATRP described in this post for the same 20 daily periods: https://www.prorealcode.com/prorealtime-indicators/average-true-range-percent-atrp/#:~:text=The%20Average%20True%20Range%20Percent,variation%20and%20not%20prices%20itselves. From my understanding of ADRP and ATRP, ADRP should always be lower than ATRP as it doesn't include gaps. Can someone help me out? thanks

Hi Doc. Thanks for sharing. To me there's isn't much difference between this and the ATR and your code is not set for "daily" unless you use the daily chart?
I'm looking at developing the Average Daily Range to use on lower time-frames like I did here for the Moving Average Daily here: http://www.prorealcode.com/topic/daily-moving-average-with-customclose-on-non-daily-timeframe/#post-18761
I might try to make it during the holidays but thought you might be interested in making it the meantime if you have free time.

Hi David, this code is not the proper daily ATR, which is calculated as follow according to the probuilder documentation:
True range is the highest data in absolute value among :
(today’s high – today’s low)
(today’s high – yesterday’s close)
(today’s low – yesterday’s close)
To calculate the Average True Range, it is necessary to apply a Wilder moving average of the True Range.
The code should be:
period = 14

//True range calculation
d1 = Dhigh(0)-Dlow(0)
d2 = abs(Dhigh(0)-Dclose(1))
d3 = abs(Dlow(0)-Dclose(1))

dailyTR =max(d1,max(d2,d3))

c = wilderaverage[period](dailyTR)

RETURN c as "Daily Timeframe ATR"
But there is still a problem to calculate the Wilder Average of daily values array into a lower timeframe.. Understand, that this code don't give you the good value because in this case the WilderAverage of 14 periods use the last 14 candlesticks of the timeframe on which the indicator is attached, not the last 14 daily values.
At first glance, I see this mistake. You shouldn't average the highs and the lows. You should be averaging the ranges.