Would anyone be interested in me releasing any of these indicators

Viewing 7 posts - 1 through 7 (of 7 total)
  • Author
    Posts
  • #136318 quote
    murit89murit89
    Participant
    Junior

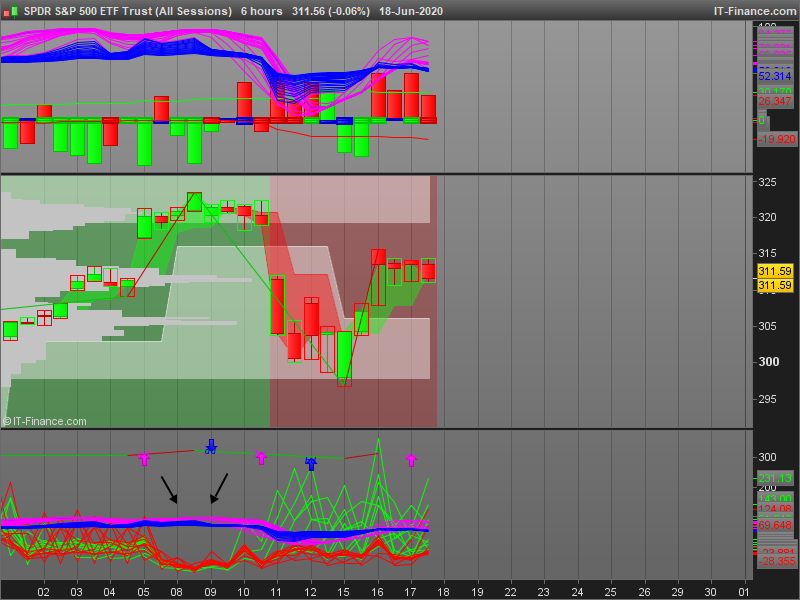
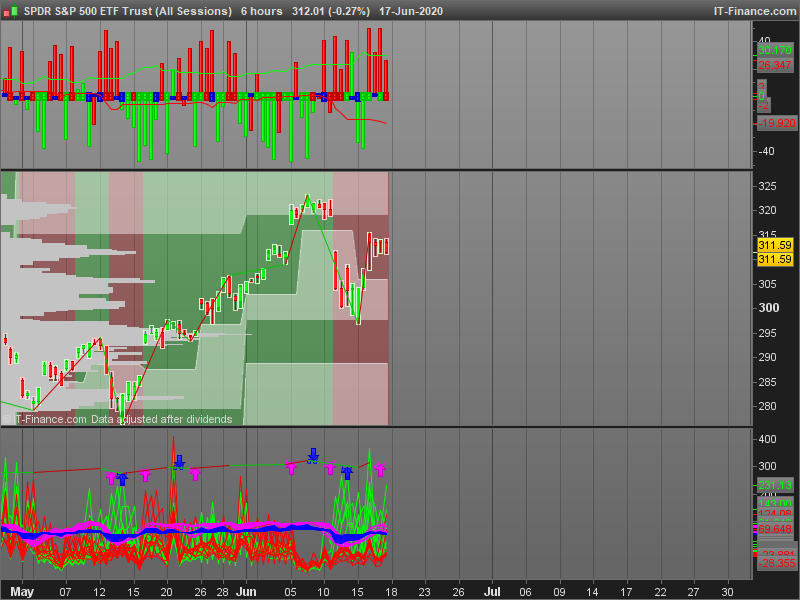
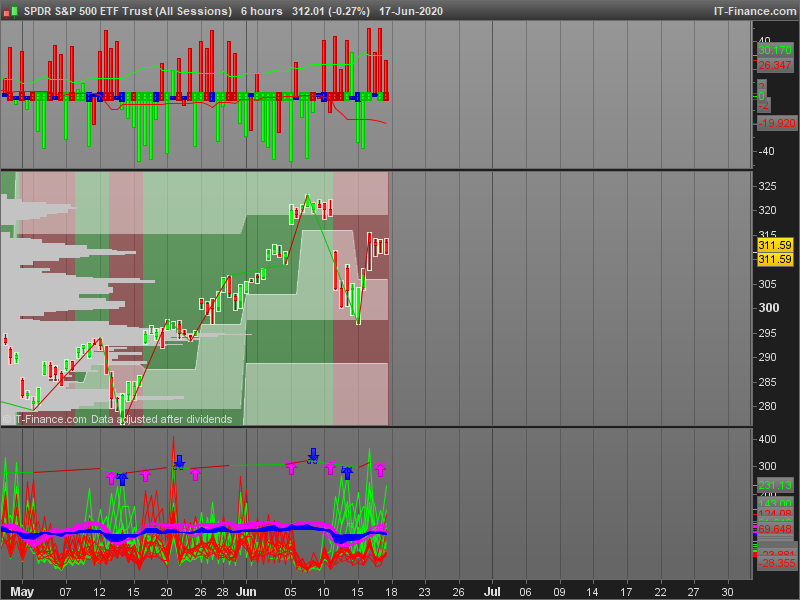
    feel like the professional market has an unfair advantaged over the normal user with rsi/macd and want to close that gap, will release the code later in the comments if anyone wants it

    top indicator is candlestick analysis

    middle is supply/demand zones

    bottom is a momentum/volume squeeze indicator

    spyhours-1592430565plc84.png spyhours-1592430565plc84.png spyhours-1592430565plc841.png spyhours-1592430565plc841.png
    #136435 quote
    robertogozzirobertogozzi
    Moderator
    Legend

    You should post your full functional code, otherwise I can’t understand the meaning of this post.

    #136436 quote
    robertogozzirobertogozzi
    Moderator
    Legend

    Topic moved to the English forum.

    #136443 quote
    murit89murit89
    Participant
    Junior

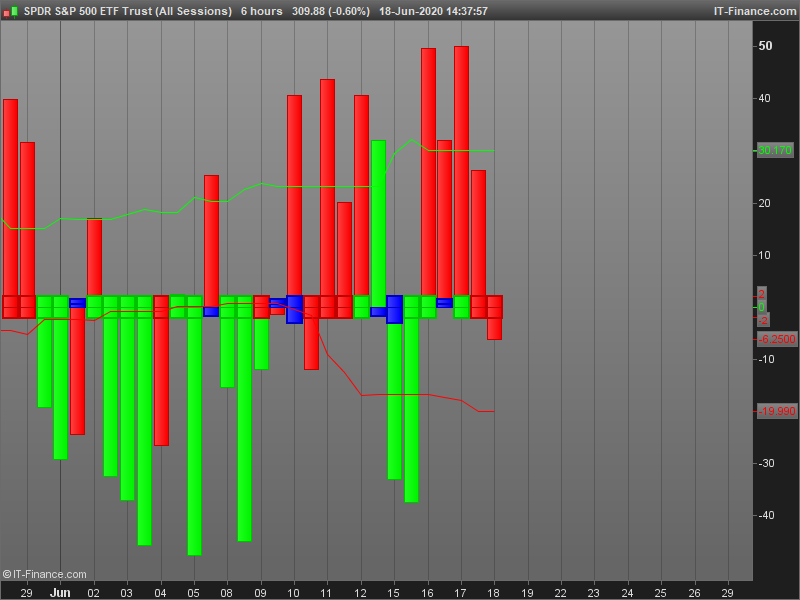
    code for the volume indicator shows buying/selling pressure, used for unnatural volume spikes and finding equilibriums which indicates a squeeze is coming if you look at when spy dropped all the red/green lines met in a gap which showed buying pressure had reached its limit and a profit taking region was coming

    st1=volumeroc [5]
    st2=volumeroc [6]
    st3=volumeroc [7]
    st4=volumeroc [8]
    st5=volumeroc [9]
    st6=volumeroc [10]
    st7=volumeroc [11]
    st8=volumeroc [12]
    st9=volumeroc [13]
    st10=volumeroc [14]
    st11=volumeroc [15]
    st12=volumeroc [17]
    st13= volumeroc[16]
    st14=volumeroc [18]
    st15=volumeroc [19]
    st16=volumeroc [20]
    st17=volumeroc [21]
    st18=volumeroc [22]
    st19=volumeroc [23]
    st20=volumeroc [24]
    return st1, st2, st3, st4, st5, st6, st7, st8, st9, st10, st11, st12, st13, st14, st15, st16, st17, st18, st19, st20
    squeeze.png squeeze.png
    #136446 quote
    murit89murit89
    Participant
    Junior

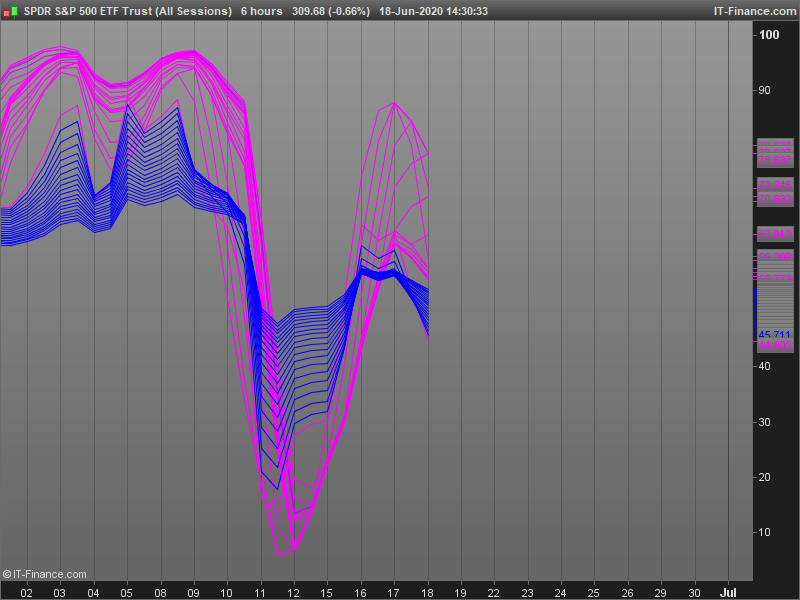
    code for the purple/blue trend line uses a combination of 20 rsi/stochastic periods and creates a trend following pattern based on spuds thread theory and shows ANY points of divergence, this can be applied to any indicator like seen above or used on its own

    st5 = stochastic[5,3](close)
    st6 = stochastic[6,3](close)
    st7 = stochastic[7,3](close)
    st8 = stochastic[8,3](close)
    st9 = stochastic[9,3](close)
    st10 = stochastic[10,3](close)
    st11 = stochastic[11,3](close)
    st12= stochastic[12,3](close)
    st13= stochastic[13,3](close)
    st14= stochastic[14,3](close)
    st15= stochastic[15,3](close)
    st16= stochastic[16,3](close)
    st17= stochastic[17,3](close)
    st18= stochastic[18,3](close)
    st19= stochastic[19,3](close)
    st20= stochastic[20,3](close)
    st21= stochastic[21,3](close)
    st22= stochastic[22,3](close)
    st23= stochastic[23,3](close)
    st24= stochastic[24,3](close)
    st25 = rsi[5](close)
    st26 = rsi[6](close)
    st27 = rsi[7](close)
    st28 = rsi[8](close)
    st29 = rsi[9](close)
    st30 = rsi[10](close)
    st31 = rsi[11](close)
    st32= rsi[12](close)
    st33= rsi[13](close)
    st34= rsi[14](close)
    st35= rsi[15](close)
    st36= rsi[16](close)
    st37= rsi[17](close)
    st38= rsi[18](close)
    st39= rsi[19](close)
    st40= rsi[20](close)
    st41= rsi[21](close)
    st42= rsi[22](close)
    st43= rsi[23](close)
    st44= rsi[24](close)
    return st5,st6,st7, st8,st9,st10,st11,st12,st13,st14 as “Stoch14”,st15,st16,st17,st18,st19,st20,st21,st22,st23,st24,st25,st26,st27, st28,st29,st30,st31,st32,st33,st34 as “Stoch24”,st35,st36,st37,st38,st39,st40,st41,st42,st43,st44
    meyes.png meyes.png
    #136448 quote
    robertogozzirobertogozzi
    Moderator
    Legend

    Always use the ‘Insert PRT Code’ button when putting code in your posts to make it easier for others to read. Thank you 🙂

    I tidied it up.

    #136452 quote
    murit89murit89
    Participant
    Junior

    Top indicator is a combination of

    https://www.prorealcode.com/prorealtime-indicators/candle-strength/

    https://www.prorealcode.com/prorealtime-indicators/pivot-line-analysis-market-sentiment-candle/

    https://www.prorealcode.com/prorealtime-indicators/candle-run-analysis-tool/

    which if all applied to the same indicator show a green/red bull/bear strength line and also show the individual red/green candles and when a red candle goes above the buying pressure line, price drops or vice versa, which is a nice lagging indicator. Blue candles are also created for indecision candles, which shows you possible trend reversals/weaknesses

    GraHal thanked this post
    kiyou.png kiyou.png
Viewing 7 posts - 1 through 7 (of 7 total)
  • You must be logged in to reply to this topic.

ProRealAI ProRealAI New

Stuck on this ProBuilder code?

Describe what this topic is trying to build, in plain English, and ProRealAI writes the ProRealTime™ indicator, screener or system for you.

Available in 7 languages
Try ProRealAI

Would anyone be interested in me releasing any of these indicators


ProBuilder: Indicators & Custom Tools

New Reply
Author
author-avatar
murit89 @murit89 Participant
Summary

This topic contains 6 replies,
has 2 voices, and was last updated by murit89murit89
6 years, 3 months ago.

Topic Details
Forum: ProBuilder: Indicators & Custom Tools
Language: English
Started: 06/18/2020
Status: Active
Attachments: 4 files
ProRealCode ProRealCode
Loading...