Le spiegazioni, in inglese, con esempi:
New instructions
New trading instructions: better management of your orders!
New drawing instructions: anchoring in pixels
List of new instructions (indicators) available in PRT version 11
Let’s discover together a new way to position the graphic objects on a price chart, with the coordinates in pixels!
This is a much-awaited feature as it will allow to fix graphic objects (including texts) at precise places of the chart, without it moving according to the barindex or the price as it is currently the case.
It will of course still be possible to choose whether the object uses BARINDEX/PRICE coordinates or only PIXELS/PIXELS or even a mix of the 2!
Below is a list of the new instructions:
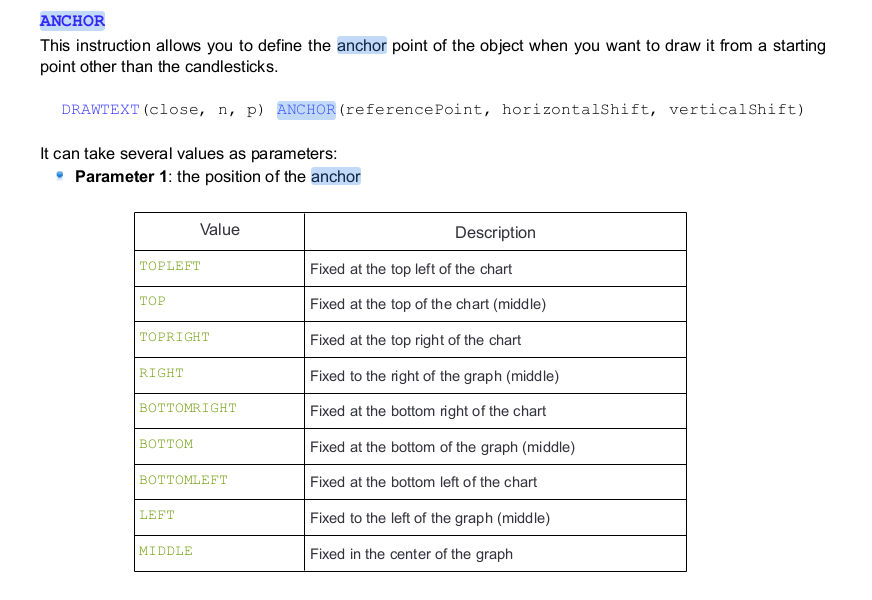
So we have the possibility to set an anchor point like this :
drawtext (“test”, 50 ,30) anchor(bottomleft)
1
drawtext (“test”, 50 ,30) anchor(bottomleft)
The new keywords are :
Xshift : defines an abscissa coordinate in pixel offset from the anchor point
Yshift : defines an ordinate coordinate in vertical pixel offset from the anchor point
Index : Defines an abscissa coordinate in barindex (classic way)
Value : Set an ordinate coordinate in price/value (classic way)
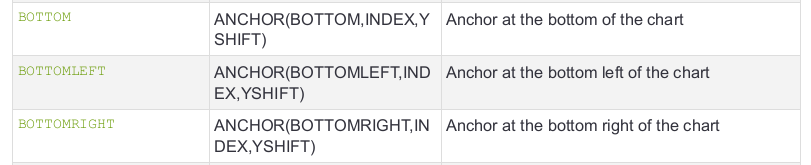
bottomright : bottom-right corner of the chart, the offset values will always be negative to shift left (X axis) and positive to shift up (Y axis).
bottomleft : bottom-left corner of the graph – the offset values will always be positive in order to shift to the right (X axis) and up (Y axis).
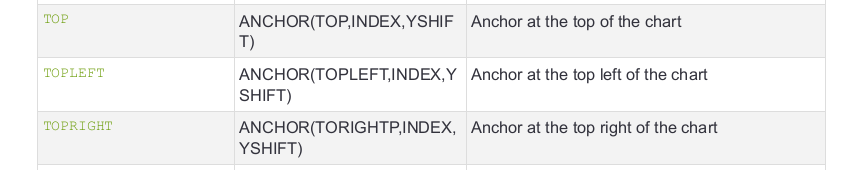
topright : top-right corner of the graph – the offset values will always be negative in order to shift to the left (X axis) and down (Y axis).
topleft : top-left corner of the graph – the offset values will always be positive in order to shift to the right (X axis) and negative in order to shift down (Y axis).
right : middle-right point of the graph – the shift values will always be negative to shift to the left (X axis) and can be positive or negative to shift up(+)/down(-) (Y axis)
left : middle-left point of the graph – the shift values will always be positive to shift to the right (X axis) and can be positive or negative to shift up(+)/down(-) (Y axis)
top : middle-top point of the graph – the shift values can be positive or negative for shift right(+)/left(-) (X axis) and will always be negative to shift down (Y axis)
bottom : middle-low point of the graph – the shift values can be positive or negative for shift to the right(+)/left(-) (X-Axis) and will always be positive in order to shift up (Y-Axis)
middle : middle point of the graph – the shift values can be positive or negative for shift to the right(+)/left(-) (X-Axis) and can be positive or negative for shift up(+)/down(-) (Y-Axis)
drawtext(“test”,barindex,close)
Writing of the word “test” on the current barindex and at the value of the current close.
drawtext(“test”, 50 ,30) anchor(bottomleft)
Writing of the word “test” at 50 pixels to the right and 30 pixels higher than the bottom-left corner of the graphic.
drawtext(“test”, barindex ,30) anchor(bottom,index,yshift)
Writing of the word “test” on the current barindex 30 pixel higher than the bottom of the graph.
drawtext(“test”, 0 ,high) anchor(middle,xshift,value)
Writing of the word “test” in the middle of the graph at the height of the high of the candlestick.
Write the word “test” on the current barindex and at the value of the current close:
drawtext (“test”, barindex ,close)
1
drawtext (“test”, barindex ,close)
Write the word “test” 50 pixels to the right and 30 pixels higher than the bottom-left corner of the graph.
drawtext (“test”, 50 ,30) anchor(bottomleft)
1
drawtext (“test”, 50 ,30) anchor(bottomleft)
Write the word “test” on the current barindex 30 pixel higher than the bottom of the graphic.
drawtext (“test”, barindex ,30) anchor(bottom,index,yshift)
1
drawtext (“test”, barindex ,30) anchor(bottom,index,yshift)
Write the word “test” in the middle of the chart at the height of the candlestick high.
drawtext (“test”, 0 ,high) anchor(middle,xshift,value)
1
drawtext (“test”, 0 ,high) anchor(middle,xshift,value)
//———————————————————————————————————————————————————————–
ShortTriggered[N] / LongTriggered[N] : Allows you to know if a Short / Long position has been opened on candlestick N (N optional by default at 0)
Useful to know when an order has been opened and its stop / profit has been triggered on the same candlestick, especially in the case of a position opening WO.
Set Stop Breakeven : Allows you to set a protective stop at the entry price of the current position, avoids the use of closing Working Orders (pending orders).
Set Stop Price X : Allows you to set a stop at a price X defined directly by the user and not in relation to the entry price of the position.
Set Stop pProfit/%Profit/$Profit/Profit X: Allows setting a stop at X points/%/€/unit above the entry price of the position.
Set target Breakeven : Allows setting a profit limit at the entry price of the current position, avoids the use of closing Working Order (pending order).
Set target Price X : Allows setting a profit limit at a price X defined directly by the user and not in relation to the entry price of the position.
Set target ploss/%loss/$loss/loss X : Allows setting a limit of X points/%/€/unit below the entry price of the position.
//———————————————————————————————————————————————————————–
8/10/2021
A new set of instructions is about to be added in prorealtime v11 during the month of October, here is the list and short explanation for each of them:
BarsSince(Condition,Occurence): Returns the number of candlesticks passed since the last true condition.
The occurrence parameter is optional and defaults to 0, it allows to search for the nth time the condition was true.
If no value, it will return the value -1.
HighestBars[Period](source)/ LowestBars[Period](source): Returns the offset of the candlestick with the highest/lowest value. If no value, it will return the value -1.
GetTimeframe : Returns the current timeframe in seconds. Only for linear time units, otherwise it will return the value -1.
Random(limit1,limit2) : Returns a random integer number located between 2 fixed limits. Attention this number will be necessarily different at each execution.
POW(Value,Power) : Power function, value the base value, power the power to apply.
Decimals : Return the number of decimal of the value
Second : Return the number of seconds of the current hour of the candlestick (idem hour and minute but for the seconds)
OpenSecond : Returns the number of seconds of the opening hour of the candlestick
ASIN(value) : Return the arc sine of the value.
ACOS(value) : Return the cosine arc of the value
Unset($var) : Reset the whole array
ArraySort($var,mode) : Sort ASCEND or DESCEND (mode) of the whole data of an array
Timestamp : Returns the unix timestamp of the candlestick closing.
OpenTimestamp : Returns the unix timestamp of the opening of the candlestick.
Coloured(“Red”) : Adds pre-registered color definitions, rather than using RGB values Red = 255,0,0 – Works with any instructions using colors
Available colors are the ones from the HTML w3c standard: https://www.w3schools.com/colors/colors_names.asp
ColorBetween (value1,value2,r,g,b,a) : make a backgroundcolor only between two values. This coloring will have priority over the background color of the platform or the indicator.
Then each color defined in the client code will have priority over the previously defined colors. The alpha parameter is optional.
//———————————————————————————————————————————————————————–
Future instructions:
DEFPARAM indicatorOnprice = true
Allows to define if the indicator will be added to the price or in a new section, directly by the code (comes in addition to the addition on the interface side).
StrategyProfitCurrent
Allows to retrieve the value of the current gains/losses of the strategy calculated with the last tick rather than the close of the last candle.
arrayPush/median/average/sum
Add a set of utility functions for arrays to facilitate their manipulation as well as calculations on a data set.
DEFPARAM min/maxScale
Parameter which will allow to limit the display of the values to a MIN and MAX to avoid “deranging” the scales when outliers are returned by an indicator (0, negative values etc…).
Correspondence number associated with the parameters in text form
For several drawing functionalities we have to fill in some values in text format, some examples :
DRAWTEXT(“My text in serif font”,x1,y1,SERIF)
DRAWLINE (x1,y1,x2,y2,) STYLE(DOTTEDLINE1,1)
This can sometimes make the drawing of these objects complex when we want to alternate between different types in the same code.
We therefore wish to associate with each of these values an equivalent number, which will allow us to fill in a variable instead of this value in the form of text. As we do for example for the different types of average.
It will be necessary of course to provide the correspondence tables in the documentation.
Addition of the types of calculation of average missing
We are currently missing 4 types of average calculation for the instruction average it would be nice to add them (DEMA, TEMA, VWMA, eVWMA)
Improvement of DRAWTEXT
Introduce the possibility to orient the text vertically (DRAWTEXT(“Text”,x1,y1,vertical))
Allow to format the text to align it left or right (alignLeft, alignRight)
Allow to choose the size of the displayed text
Use screener data formats to enhance the display of special numeric values from a DRAWTEXT: PERCENTFORMAT, DATEFORMAT, NUMBERFORMAT, STRINGFORMAT
Orientation of objects drawn at a point
Give the possibility of orientation of objects via a new attribute
This allows for example to write text vertically, to align a text to the left or to the right, to turn an arrow at 90° so that it is horizontal.
Example : drawtext(“toto”,barindex, close) rotate(90) align(left)
DRAWPOLY()
Allows to draw a quadrilateral with N points
Example:
drawpoly($arrayX, $arrayY)
drawpoly(x1,y1,x2,y2,x3,y3 etc..)
////////////////////////////////////////////////////////////////////////////////////////////////////////////////////////////////////////
// ###_DrawText example:
DEFPARAM DrawOnLastBarOnly = true
ONCE Whigh = 0
IF (OpenDayOfWeek = 1) AND (OpenDayOfWeek <> OpenDayOfWeek[1]) THEN
Whigh = high
ENDIF
Whigh = max(Whigh,high)
//
// https://www.prorealcode.com/documentation/drawtext/
//
DrawText(“— Weekly HIGH #Whigh#”,BarIndex,Whigh*1.05,dialog, standard, 10)coloured(“Blue”) //min 1 (not readable), lower than 10 is not recommended
DrawText(“— Weekly HIGH #Whigh#”,BarIndex,Whigh*1.04,serif, bold, 14)coloured(“Black”)
DrawText(“— Weekly HIGH #Whigh#”,BarIndex,Whigh*1.03,sansserif, italic, 18)coloured(“Green”)
DrawText(“— Weekly HIGH #Whigh#”,BarIndex,Whigh*1.02,monospaced,bolditalic,30)coloured(“Red”) //max 30
RETURN
/*
// Anchor, drawtext, TopRight, TopLeft, BottomRight, BottomLeft, Middle, Index, Volume, Bottom, Top, Right, Left, Xshift, Yshift
//
// TSR-ADR-Indikators display Änderung
//
// https://www.prorealcode.com/topic/tsr-adr-indikators-display-anderung/
//
//PRC_TSR_DailyRange_display | indicator
//11.12.2018
//Nicolas @ http://www.prorealcode.com
//Sharing ProRealTime knowledge
//translated from MT4 version
defparam drawonlastbaronly=true
if day<>day[1] then
startbar=barindex
FIVE=0
TEN=0
TWENTY=0
for i = 1 to 20 do
if i<6 then
FIVE=FIVE+(dhigh(i)-dlow(i))
endif
if i<11 then
TEN=TEN+(dhigh(i)-dlow(i))
endif
TWENTY=TWENTY+(dhigh(i)-dlow(i))
next
FIVE = FIVE/10
TEN = TEN/20
TWENTY = TWENTY/40
AV = (FIVE+TEN+TWENTY)/3
endif
HIDaily = dhigh(0)-(AV)
LOWDaily = dlow(0)+(AV)
HIDaily1 = dhigh(0)
LOWDaily1 =dlow(0)
HIDaily2 = dhigh(0)-(AV)*2
LOWDaily2 =dlow(0)+(AV)*2
//——————————————————————————————————————–
drawrectangle(-350,0,-245,-20) anchor(TopRight) coloured(“YellowGreen”) bordercolor(“Black”)
drawtext (“Top DAILY Range “, -301 ,-10) anchor(TopRight) coloured(“Black”)
//
drawrectangle(-350,-20,-245,-40) anchor(TopRight) coloured(“Silver”) bordercolor(“Black”)
drawtext (“Open”, -314 ,-30) anchor(TopRight) coloured(“Black”)
//
drawrectangle(-350,-40,-245,-60) anchor(TopRight) coloured(“PapayaWhip”) bordercolor(“Black”)
drawtext (“Bottom DAILY Range”, -298 ,-50) anchor(TopRight) coloured(“Black”)
//——————————————————————————————————————–
drawrectangle(-245,0,-170,-20) anchor(TopRight) coloured(“YellowGreen”) bordercolor(“Black”)
x = round(LowDaily2,1)
drawtext (“#x#”, -196 ,-10) anchor(TopRight) coloured(“Black”)
//
drawrectangle(-245,-20,-170,-40) anchor(TopRight) coloured(“Silver”) bordercolor(“Black”)
x = Dopen(0)
drawtext (“#x#”, -196 ,-30) anchor(TopRight) coloured(“Black”)
//
drawrectangle(-245,-40,-170,-60) anchor(TopRight) coloured(“PapayaWhip”) bordercolor(“Black”)
x = round(HiDaily2,1)
drawtext (“#x#”, -196 ,-50) anchor(TopRight) coloured(“Black”)
//——————————————————————————————————————–
drawrectangle(-160,0,-90,-20) anchor(TopRight) coloured(“LightBlue”) bordercolor(“Black”)
drawtext (“Date: “, -140 ,-10) anchor(TopRight) coloured(“Black”)
//
drawrectangle(-160,-20,-90,-40) anchor(TopRight) coloured(“LightBlue”) bordercolor(“Black”)
drawtext (“High”, -140 ,-30) anchor(TopRight) coloured(“Black”)
//
drawrectangle(-160,-40,-90,-60) anchor(TopRight) coloured(“LightBlue”) bordercolor(“Black”)
drawtext (“Low “, -140 ,-50) anchor(TopRight) coloured(“Black”)
//——————————————————————————————————————–
drawrectangle(-90,0,-10,-20) anchor(TopRight) coloured(“LightBlue”) bordercolor(“Black”)
x = OpenDay
y = OpenMonth
z = OpenYear MOD 2000
drawtext (“#x##y##z#”, -40 ,-10) anchor(TopRight) coloured(“Black”)
//
drawrectangle(-90,-20,-10,-40) anchor(TopRight) coloured(“LightBlue”) bordercolor(“Black”)
x = Dhigh(0)
drawtext (“#x#”, -40 ,-30) anchor(TopRight) coloured(“Black”)
//
drawrectangle(-90,-40,-10,-60) anchor(TopRight) coloured(“LightBlue”) bordercolor(“Black”)
x = Dlow(0)
drawtext (“#x#”, -40 ,-50) anchor(TopRight) coloured(“Black”)
return
*/