The chronicals of an auto-trader
Hi there e-rik,
You did all very well (if I may say so), but :
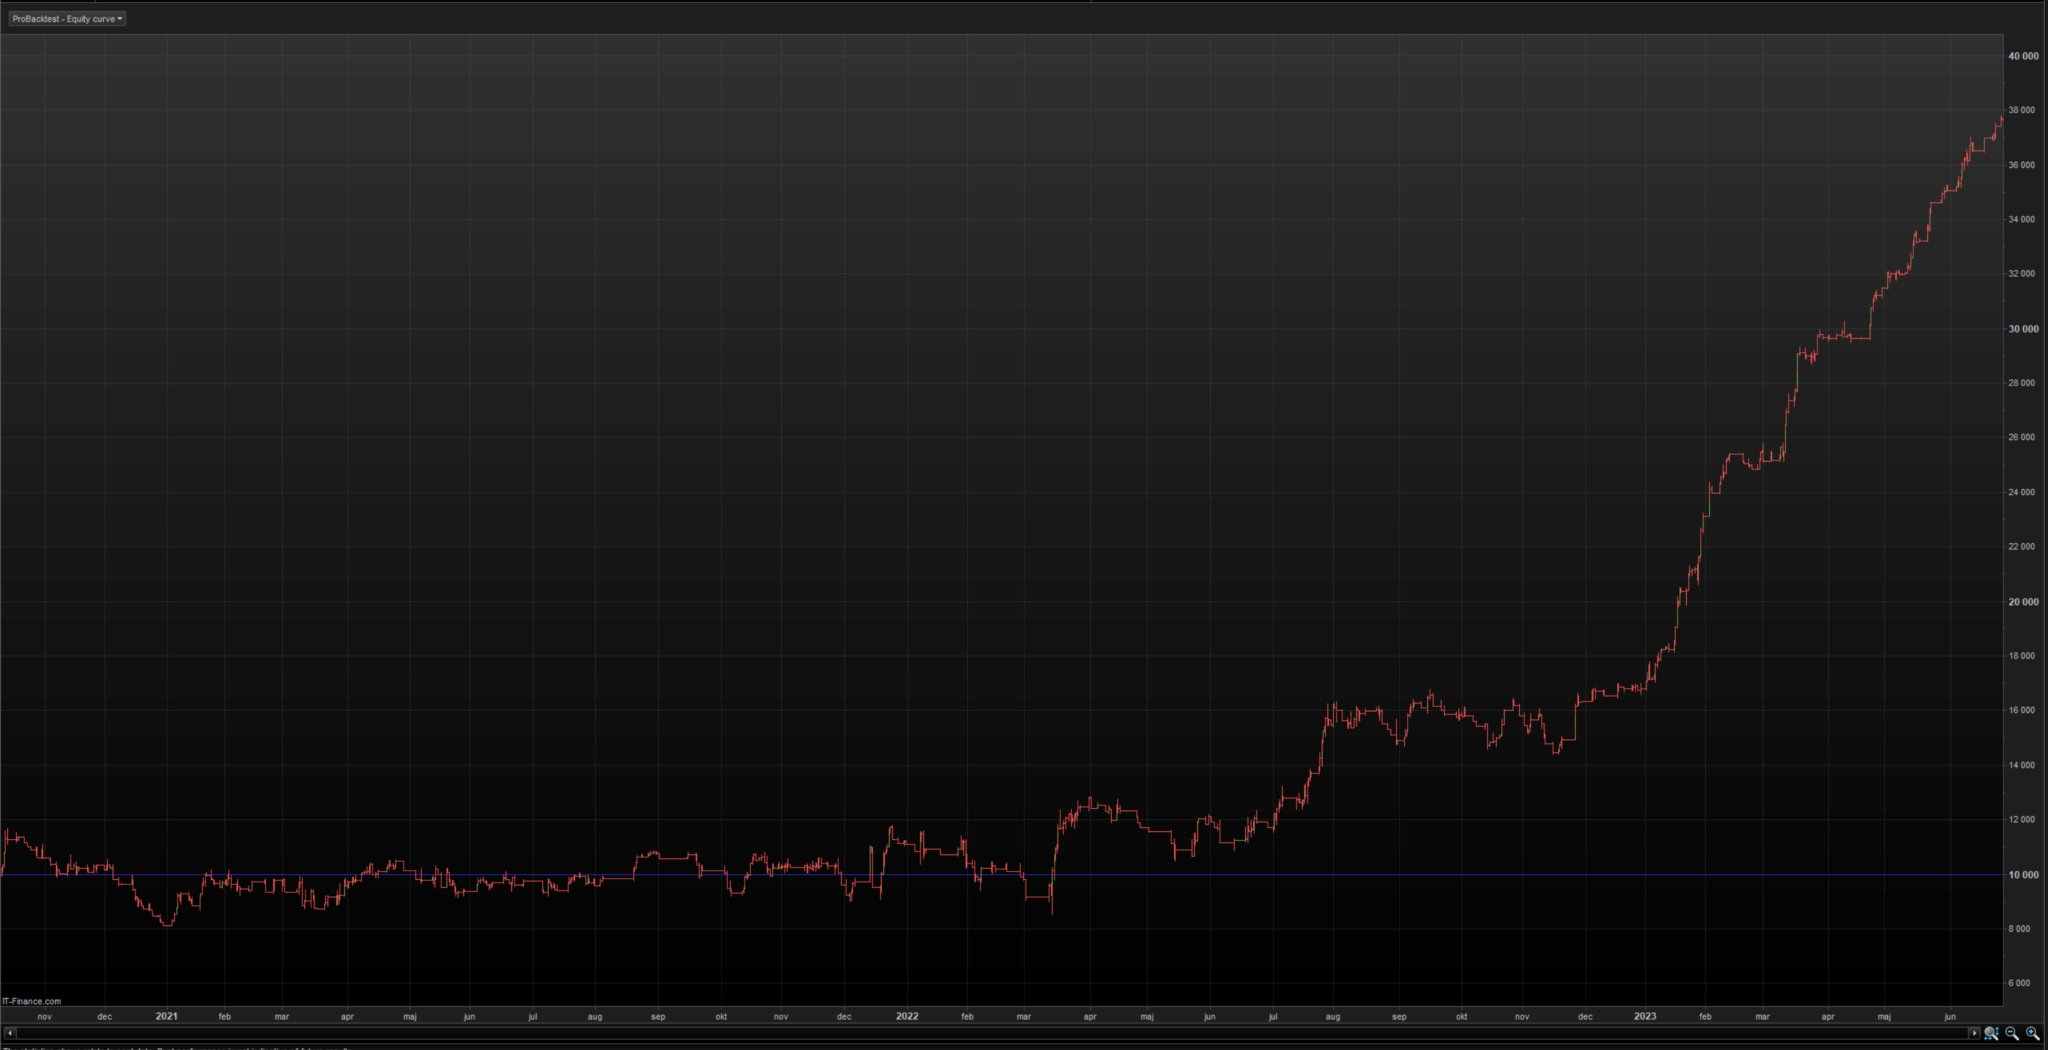
Anyhow, when I then try to backtest the code from 2021-2023 the equity goes quite horisontal from the beginning til the time from where my optimisation starts and then 45 degrees upwards.
That is quite typically the proof that you over-optimised after all. It happens to the best (if not all), no matter what you do not to do it. 🙂
The measures you took are technical measures, which indeed are necessary first (again, well done). What I can’t see is the instrument, and if it’s in another currency, you may have forgotten to factor out that. And Yes, these technical measures are hard as it is to begin with, but when covered then you have a good base not to be mislead.
I apply explicitly what you described : create a system for the period of just over 6 months (1 minute TF) and afterwards test it on over-fitting by letting loose 1M bars on it. If it is okay-ish I let it go, if the change is too wild (like in your case) I may start all over, but only within the 200K bars period.
Only one time – and only recently after now 5 years of development – I ran into a situation that the curve remained quite the same, and from there I could see why;
I appeared to use signals which just don’t relate to the market(-sentiment) at all which in this case was about a highs and lows system. Of course I optimized over the period of those highs and lows, but that was all. Fact in this case : the revenue was too low to work with it, and I ditched the system. Or ? …
I find myself to go lower and lower with expectations if only the System will withstand time. That *is* more important, right ?
Over time I more and more focus explicitly on what to do in order not to be over-fitting in the first place. No averages. No perceived cycles. No RSI’s. No-nothing ?
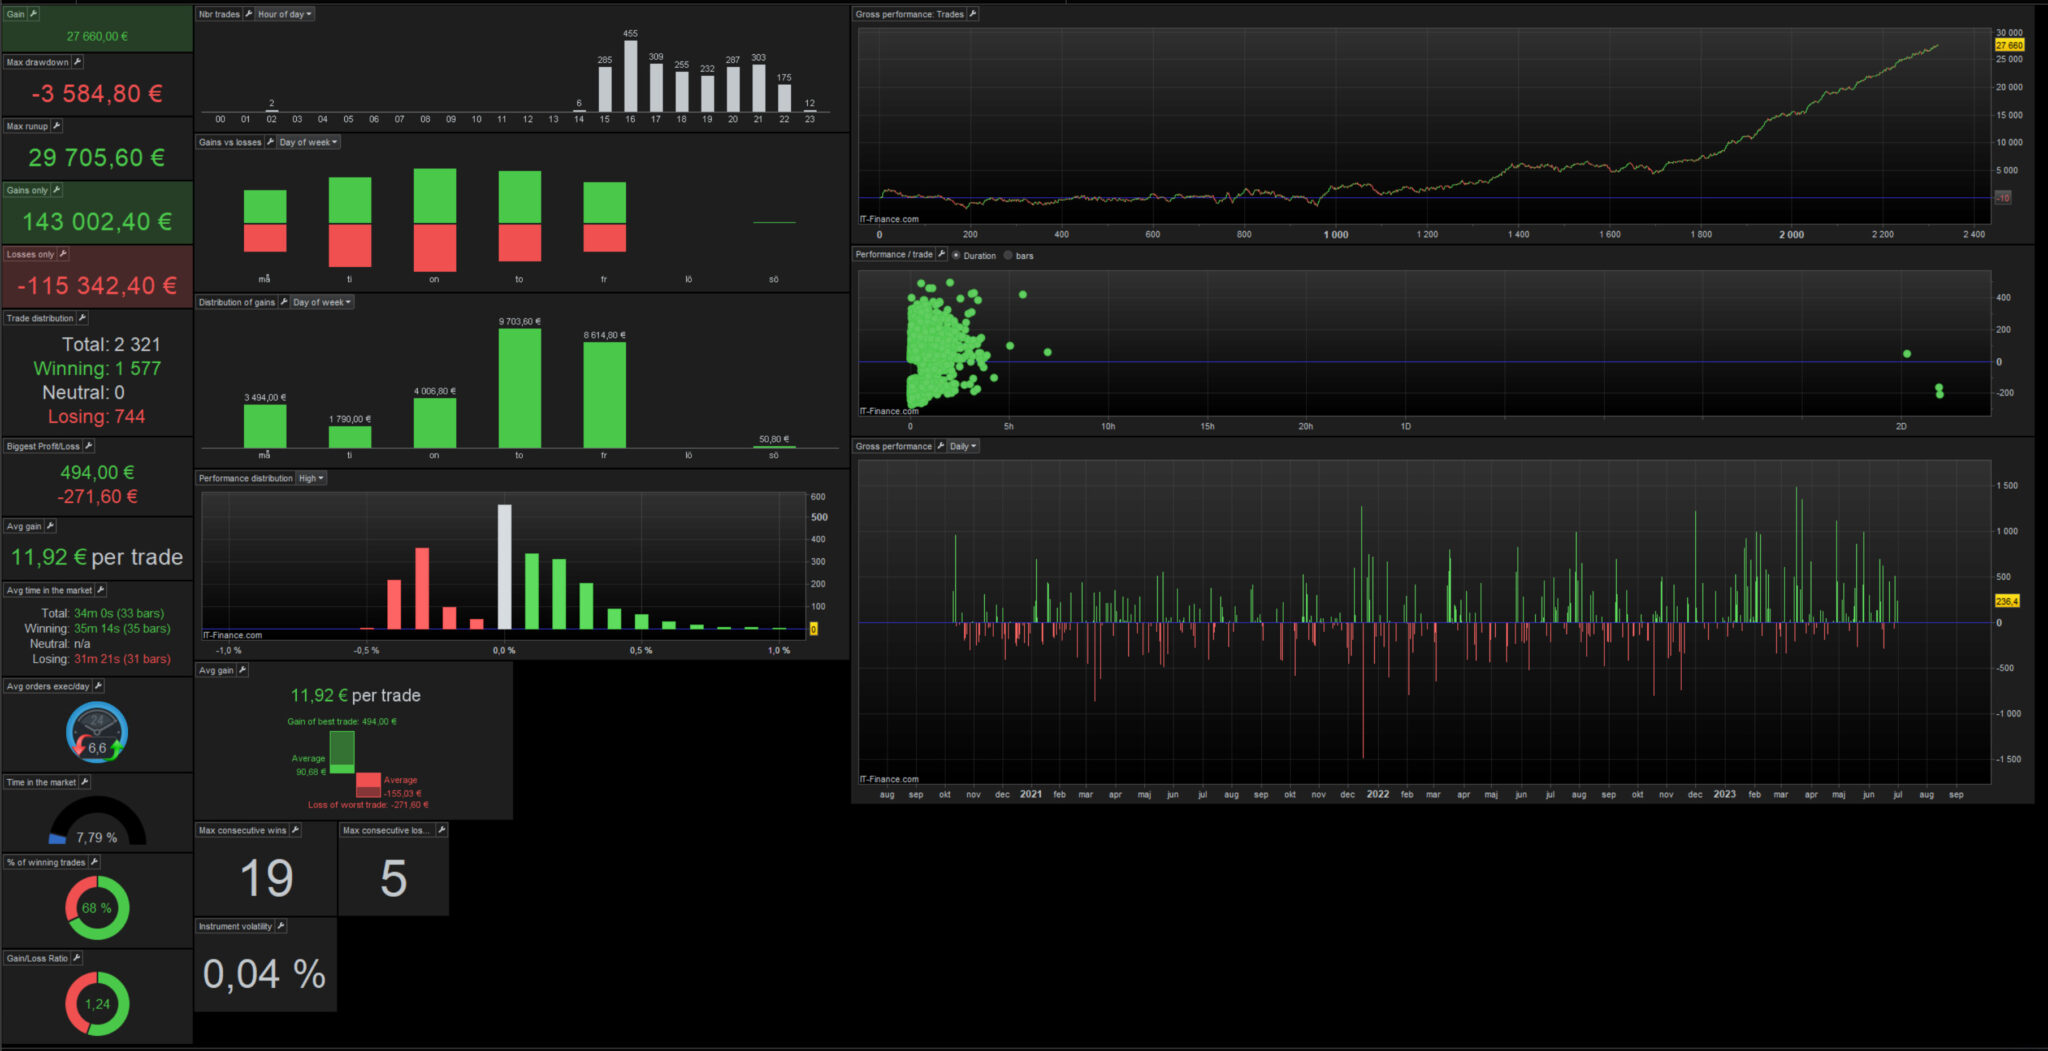
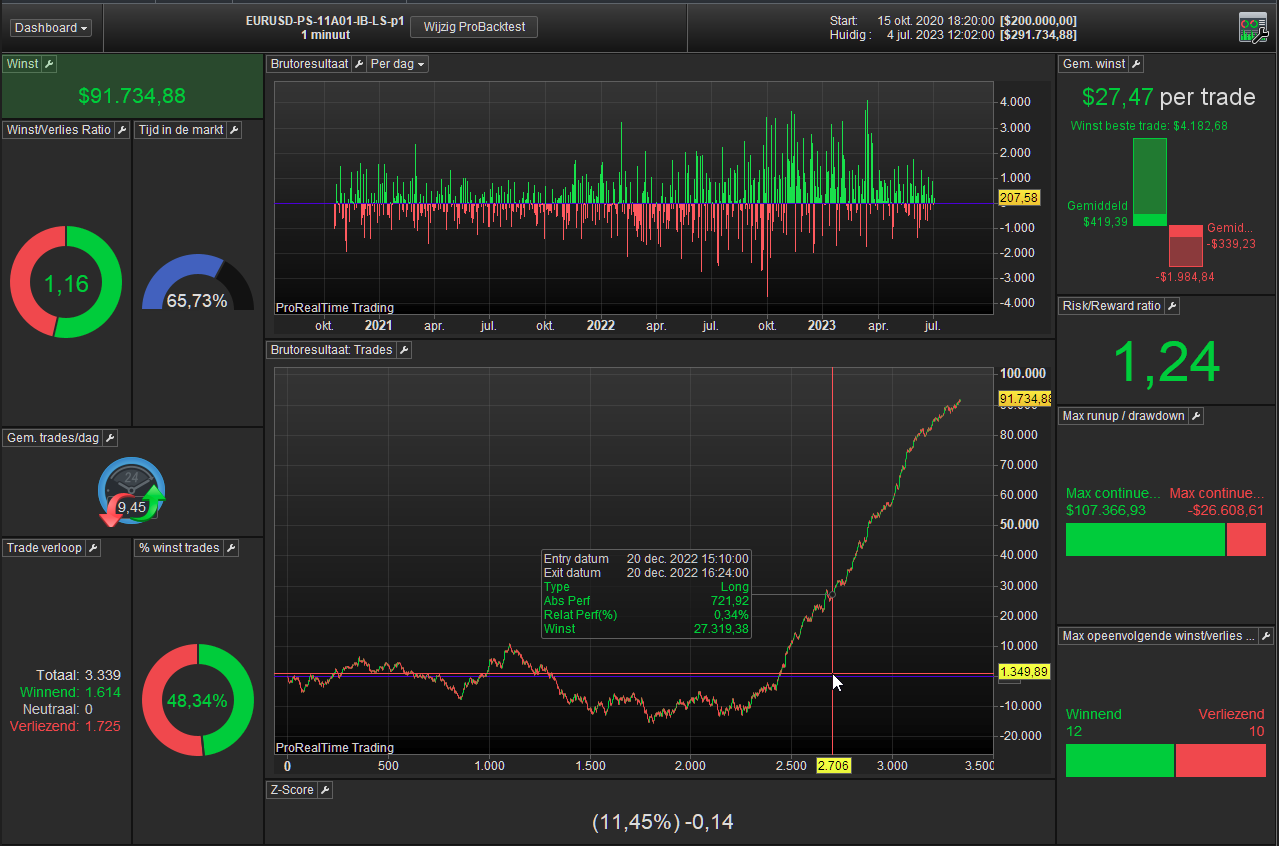
For fun I give you 4 screenshots (attachment 1-4). These are all backtests, except for virtually the first. They all work with USD 215000 (~EUR 200000).
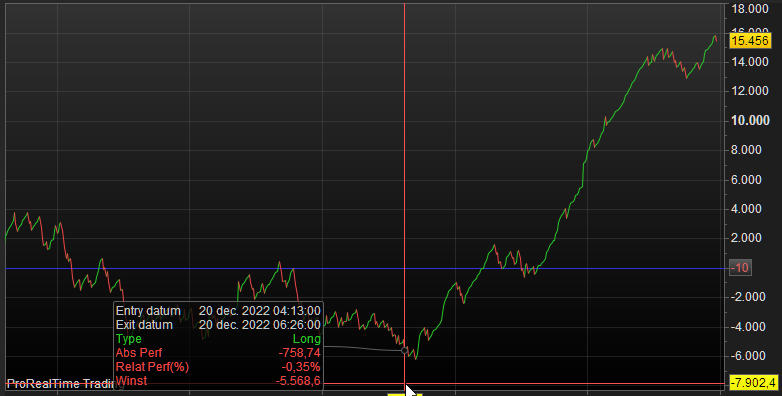
The first is the one I am using on Live since April somewhere. Psychologically I deem it wrong because of the so many wrong entries. However, that *is* a means to let things work over time. I can’t explain that really, but it works out. I wanted to change this psychological state of mine, and sat down this weekend to change it towards the other direction : make it winning mostly..
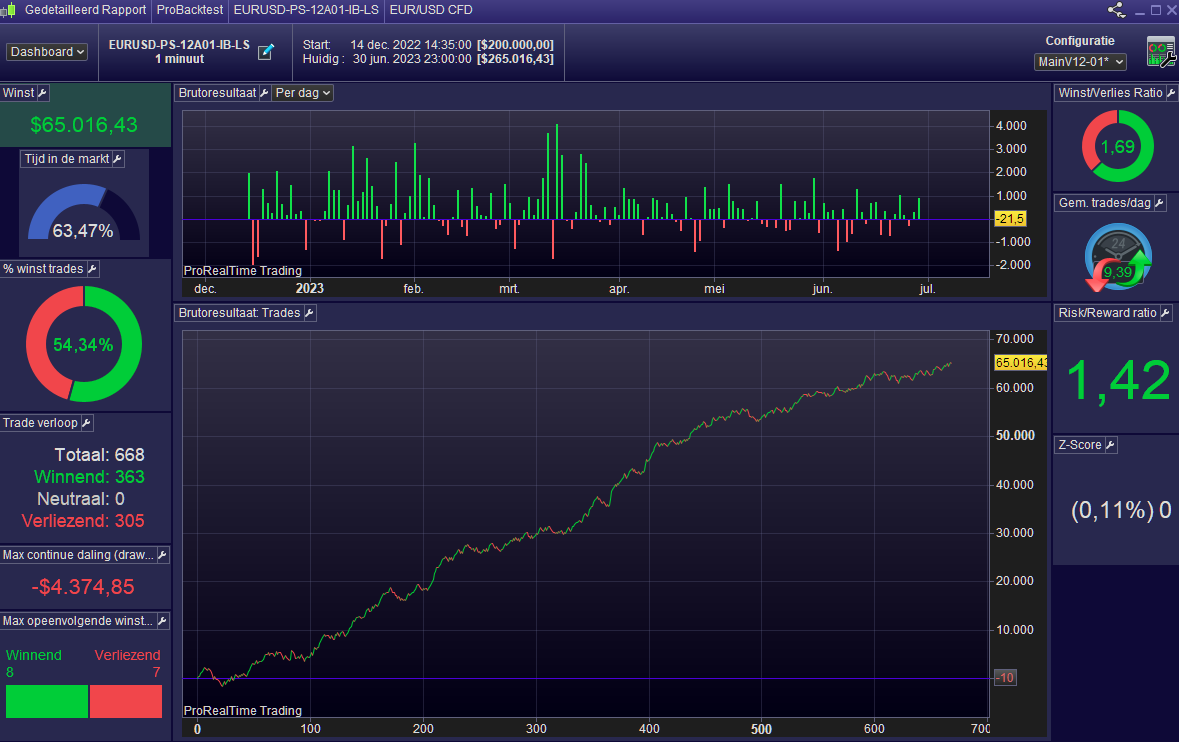
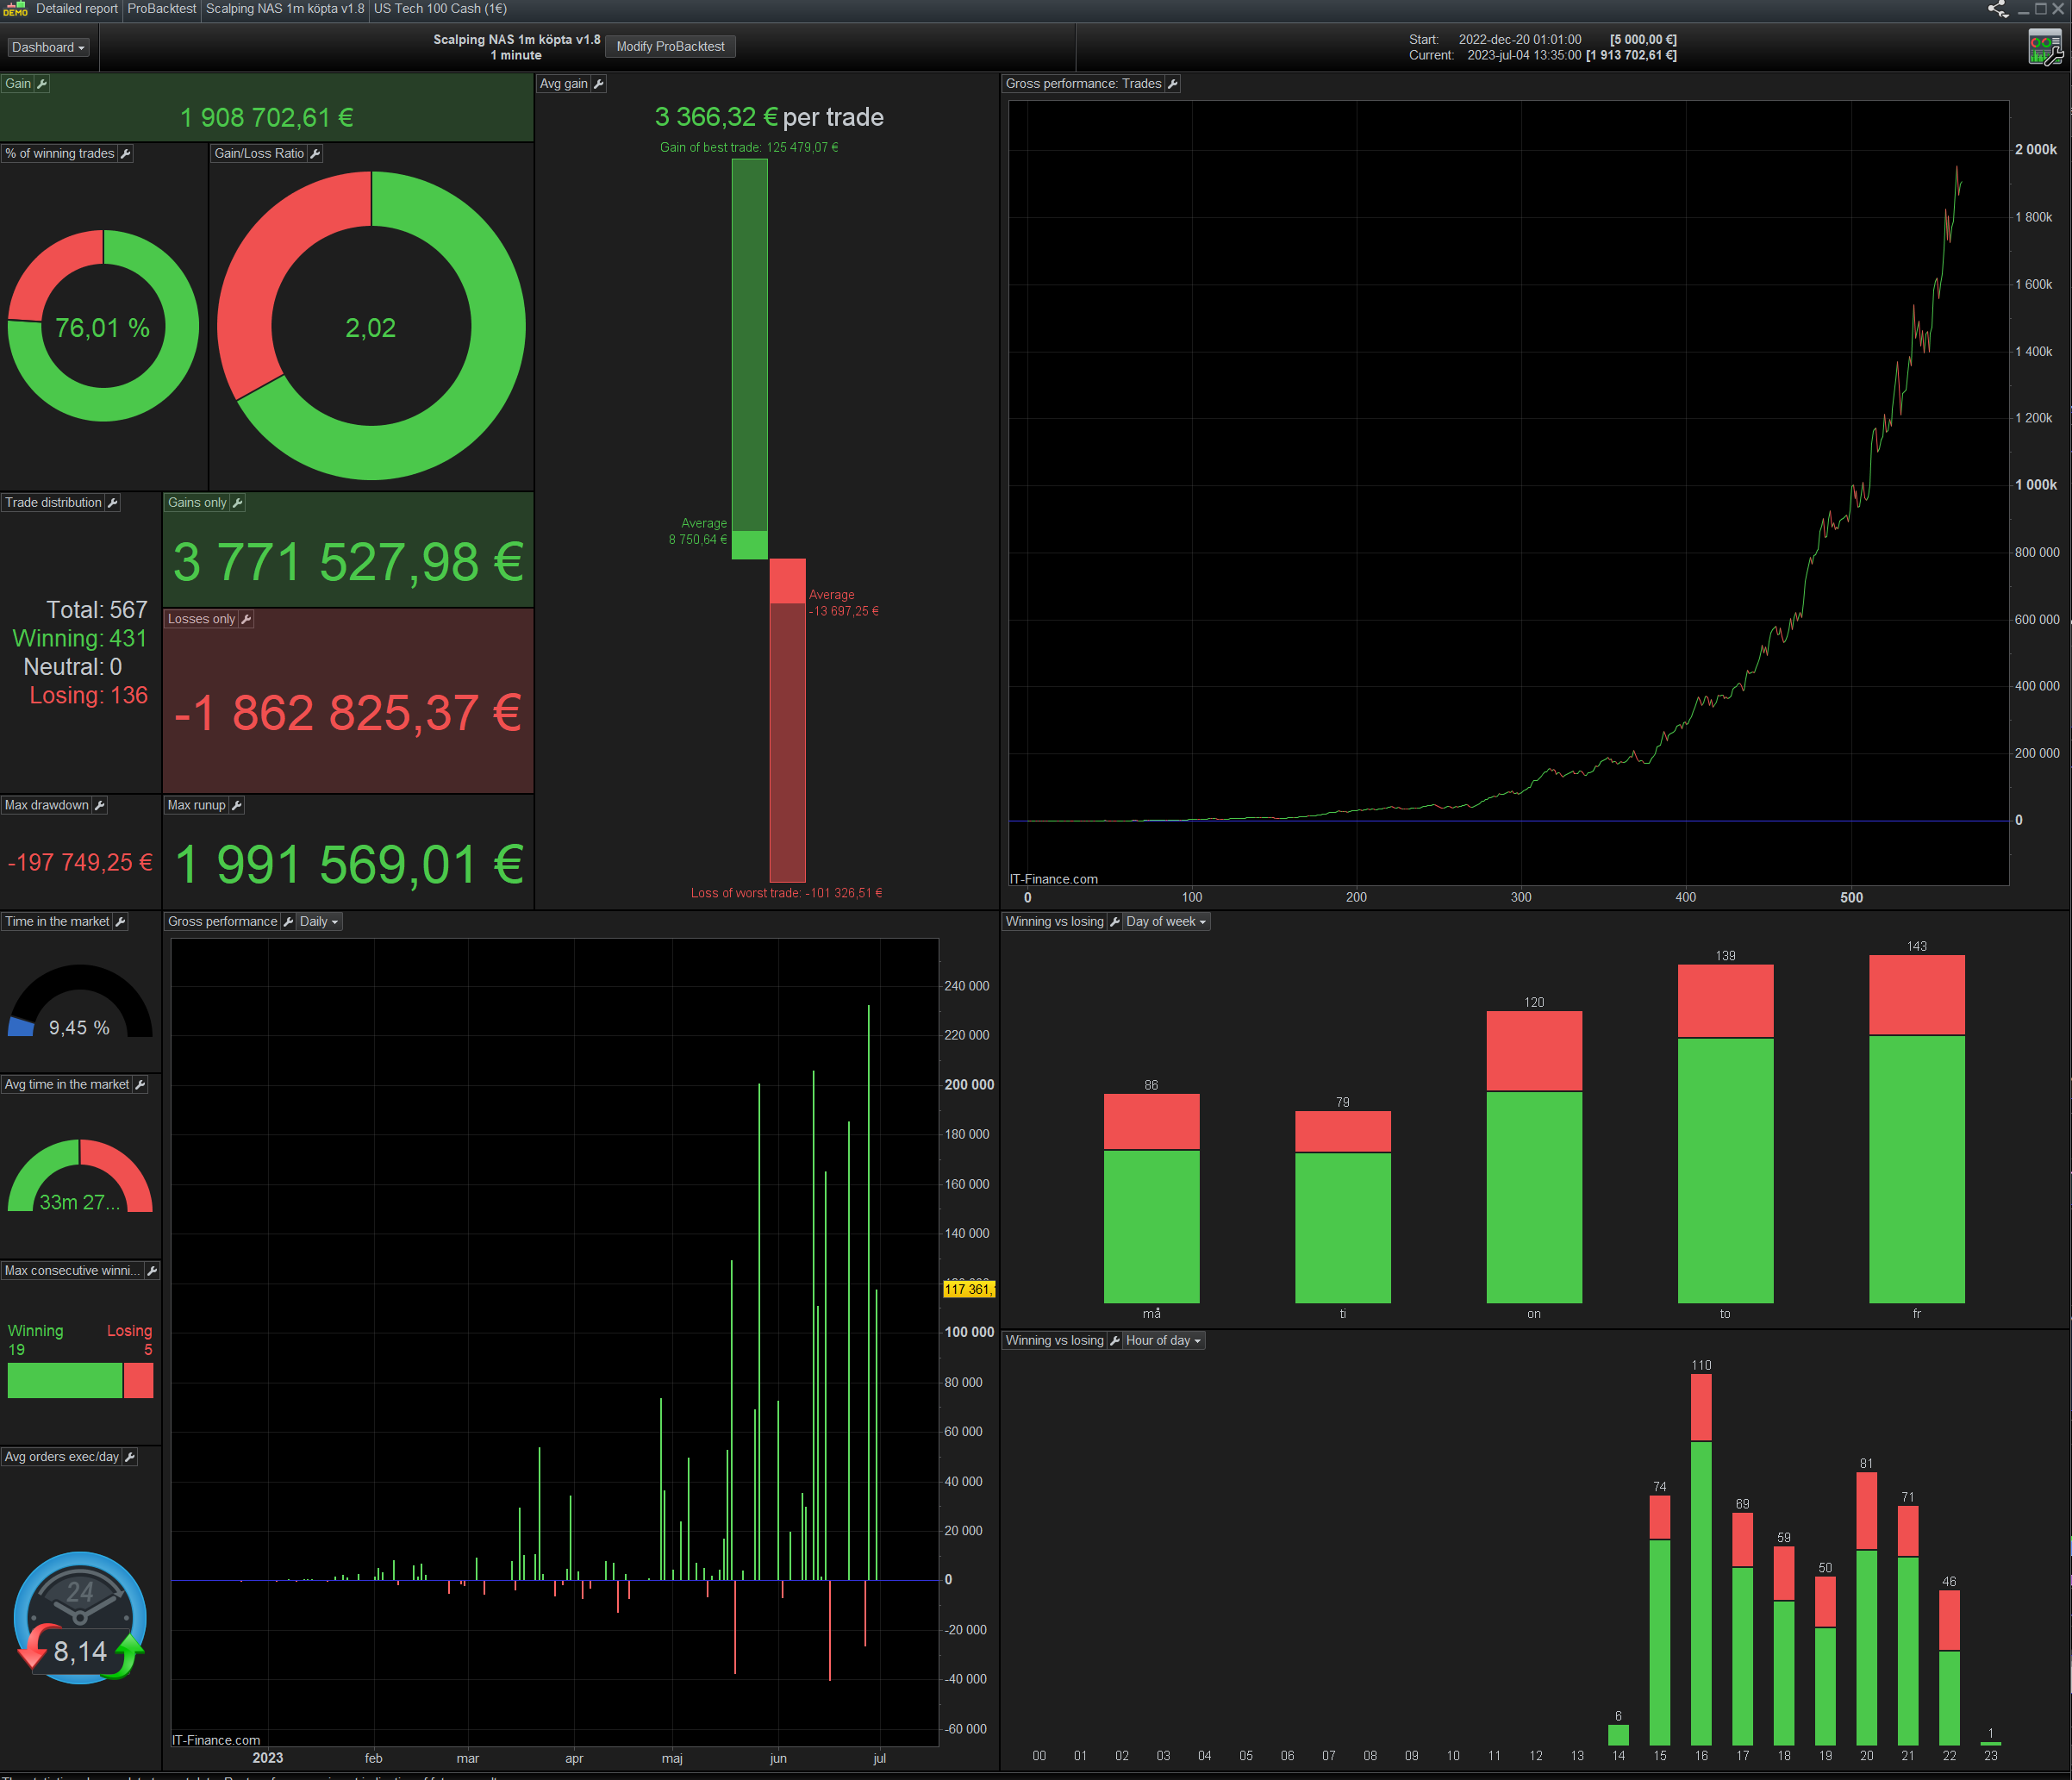
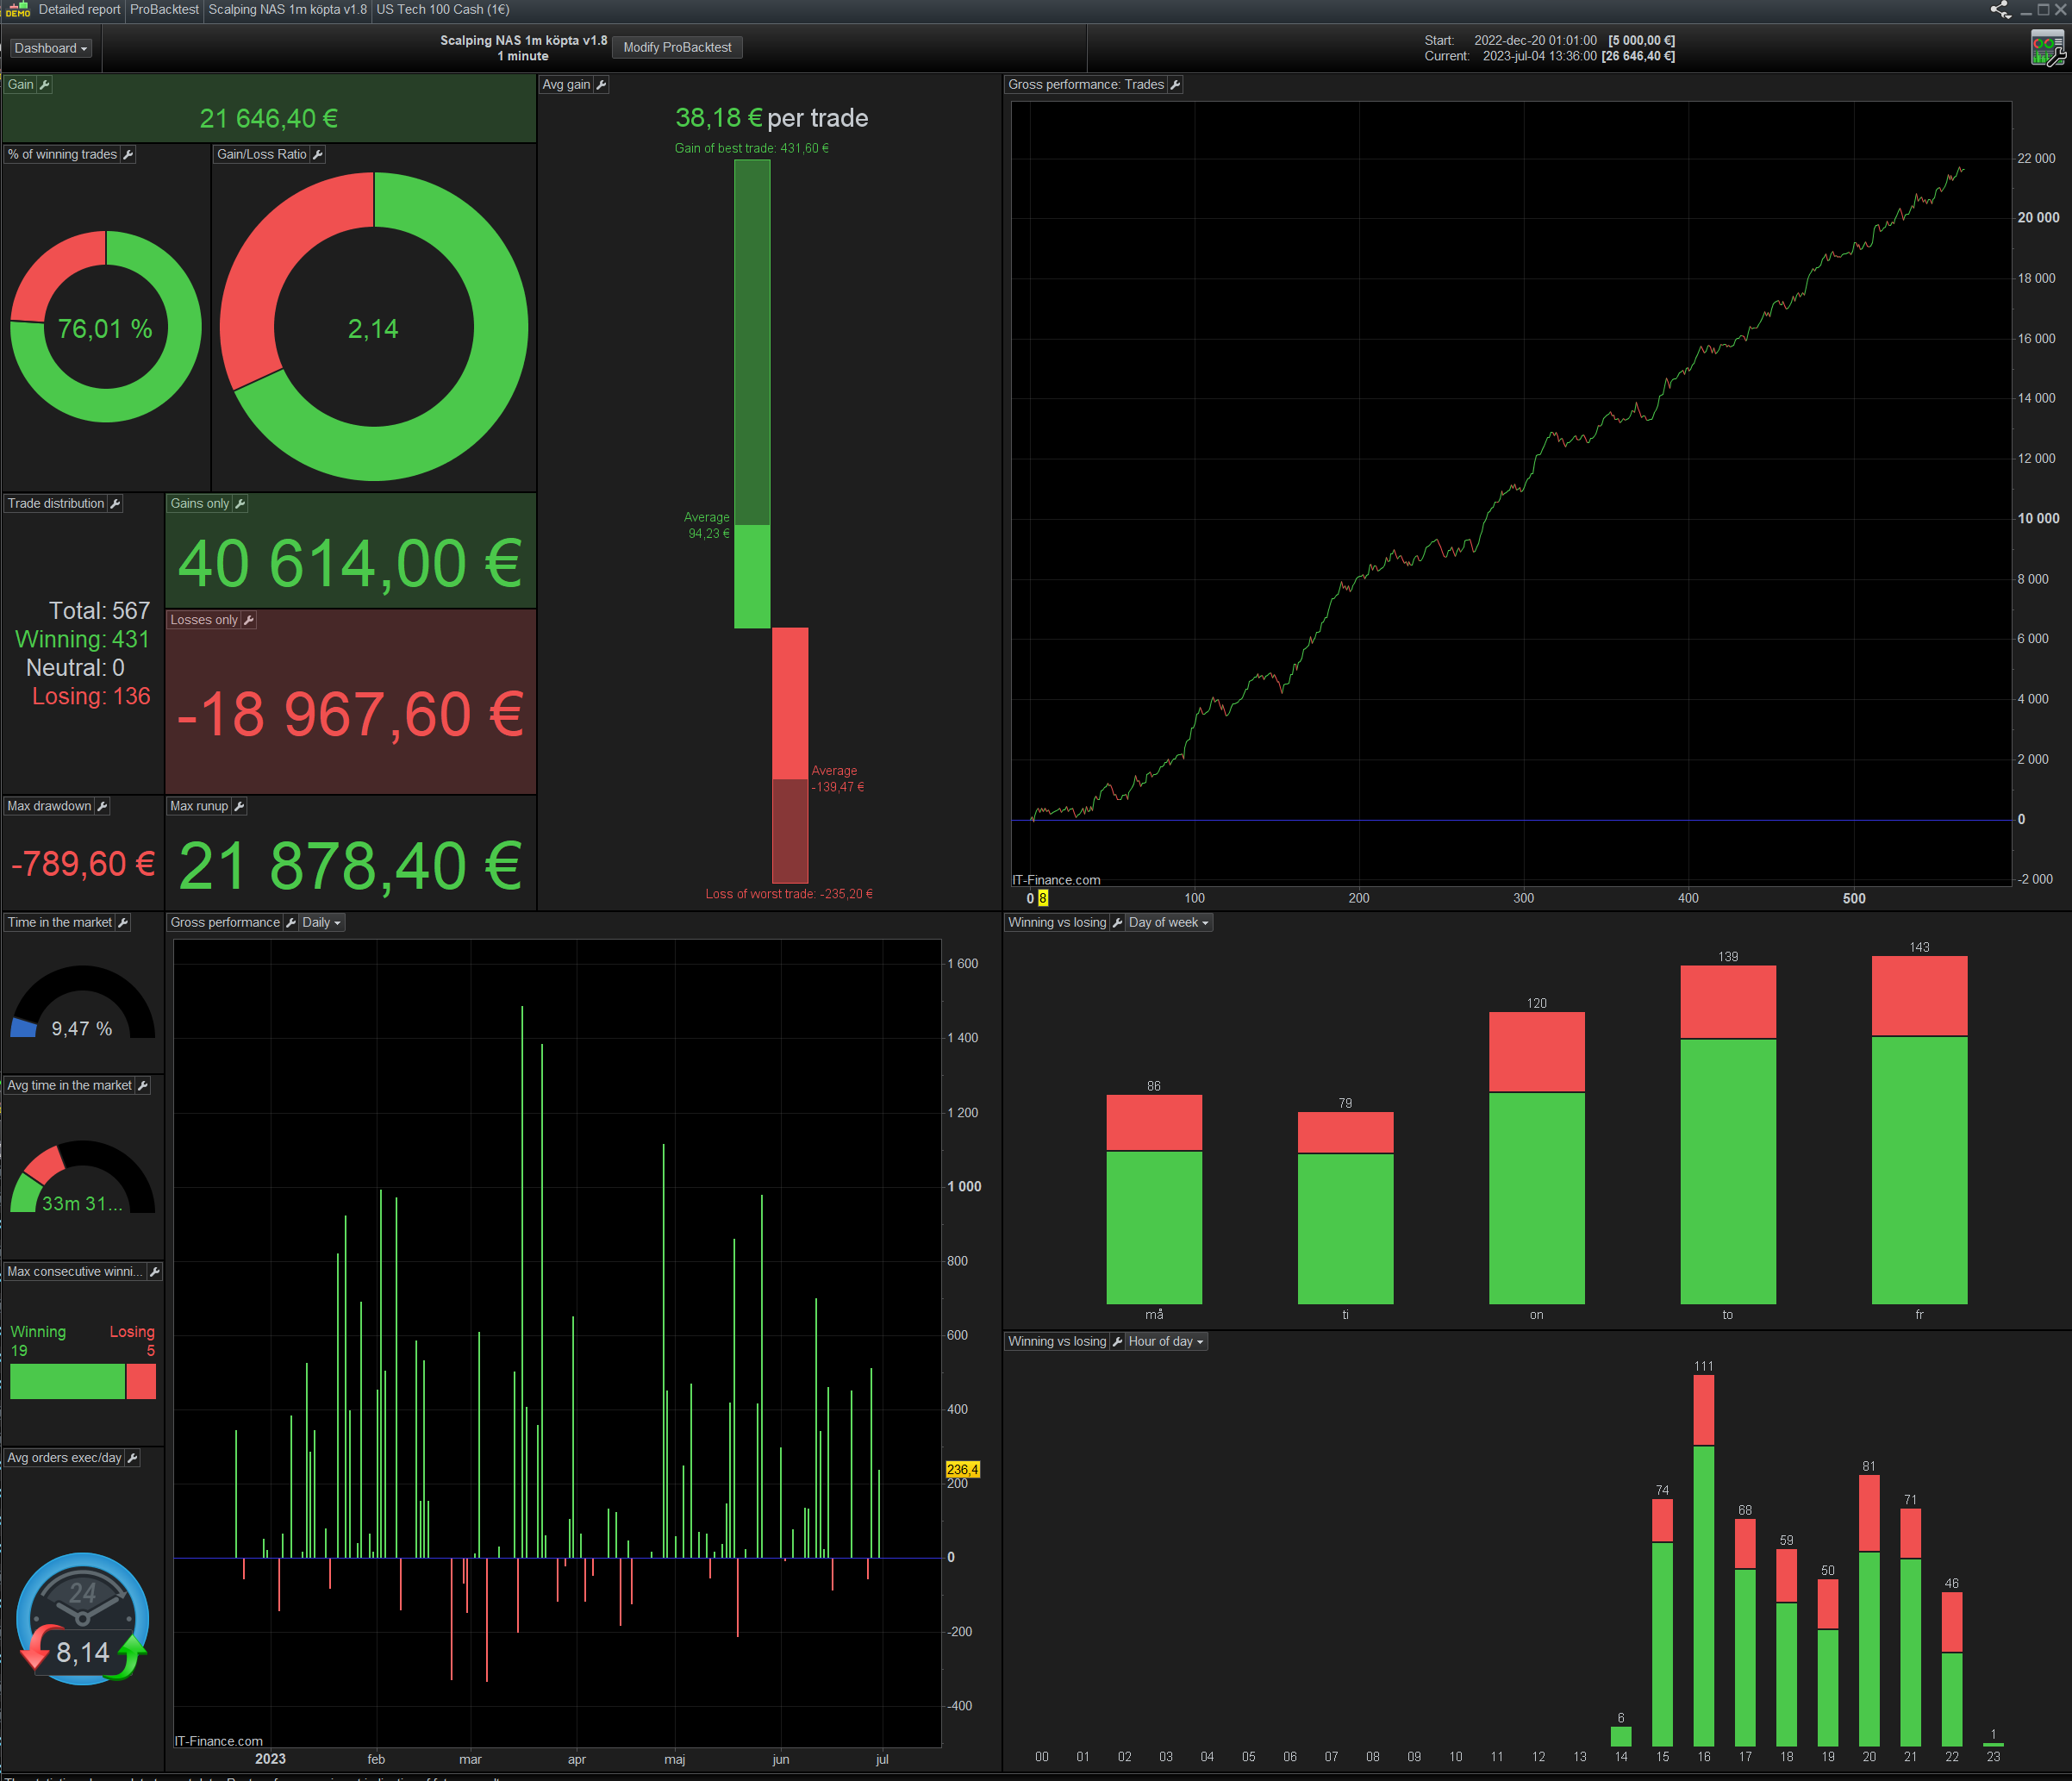
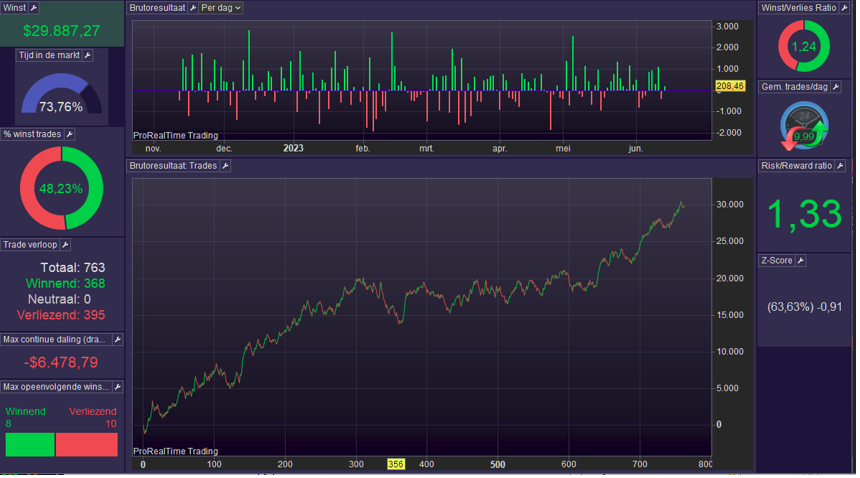
The second shows the result after a full Saturday of “hard work” but with a lot of experience on such mostly winning systems. Notice that the System itself was not – or hardly changed in code – this is all Parameter stuff (SL and such and 30 more). For the life of me I could not get rid of this bend-down towards this end, which is 25% of the period. Not a good prospectus, especially not when ending in a down trend.
For each of the maybe 100 backtests of that day, I stared at the cause. I could not see it, but possibly it was about volatility.
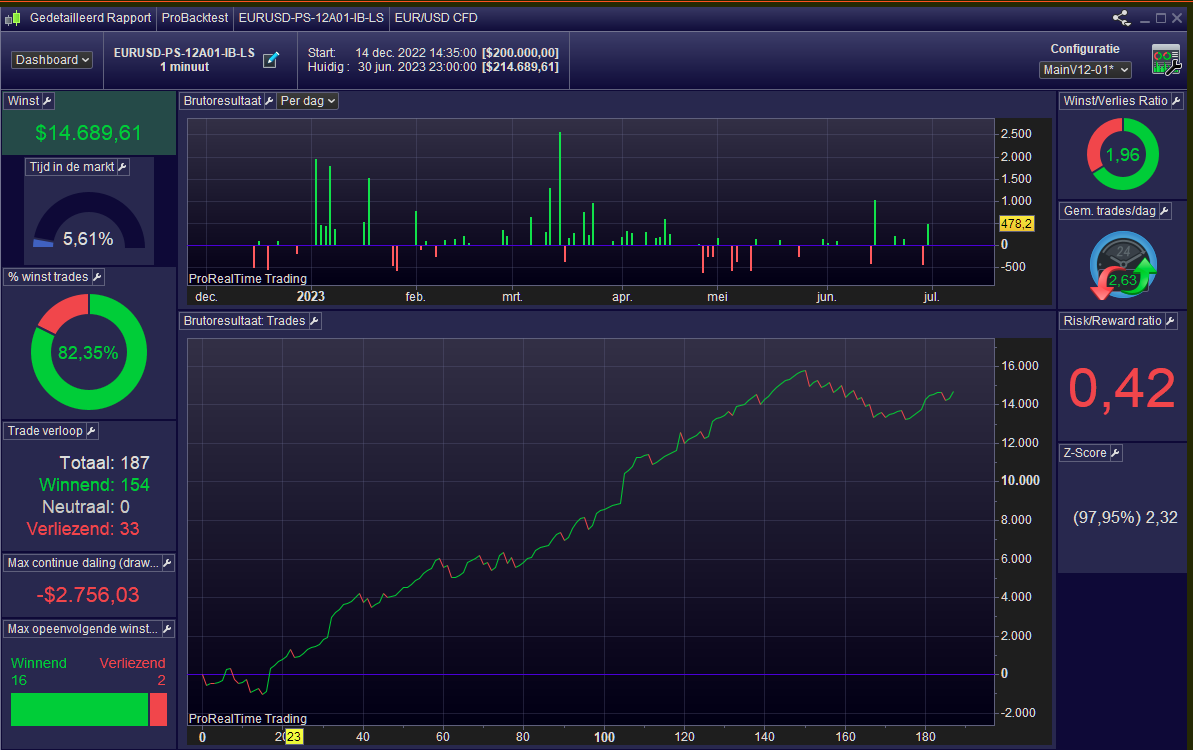
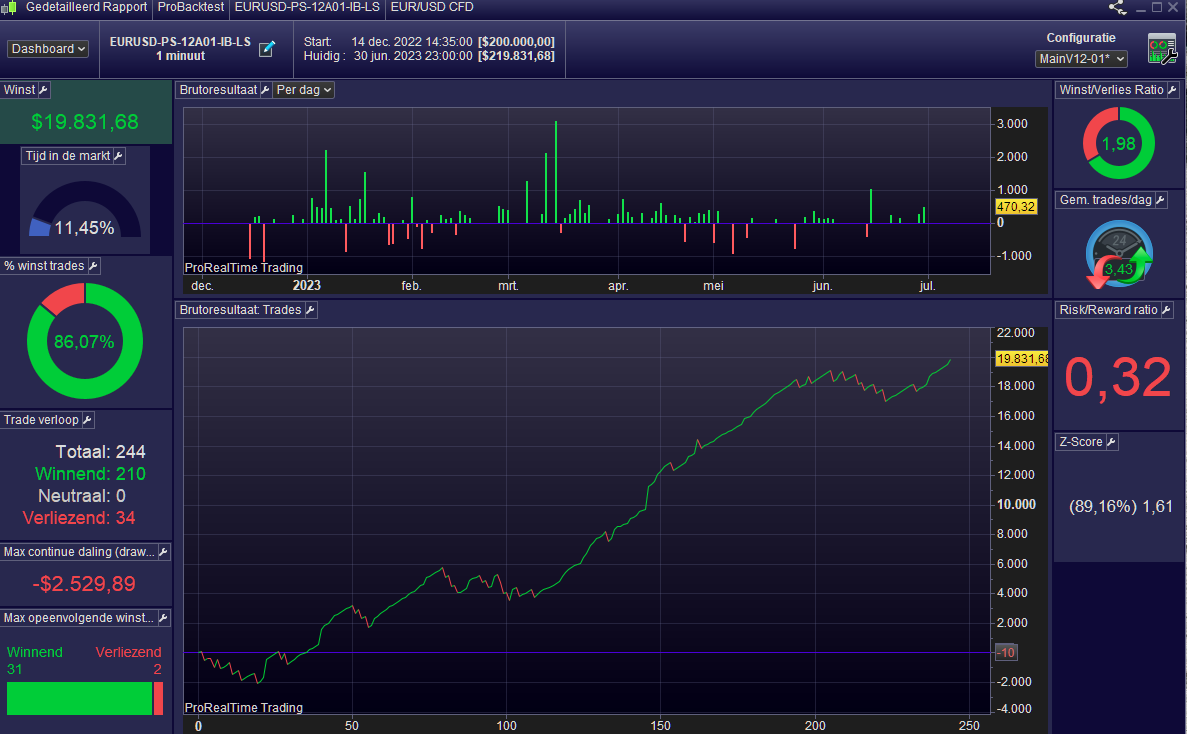
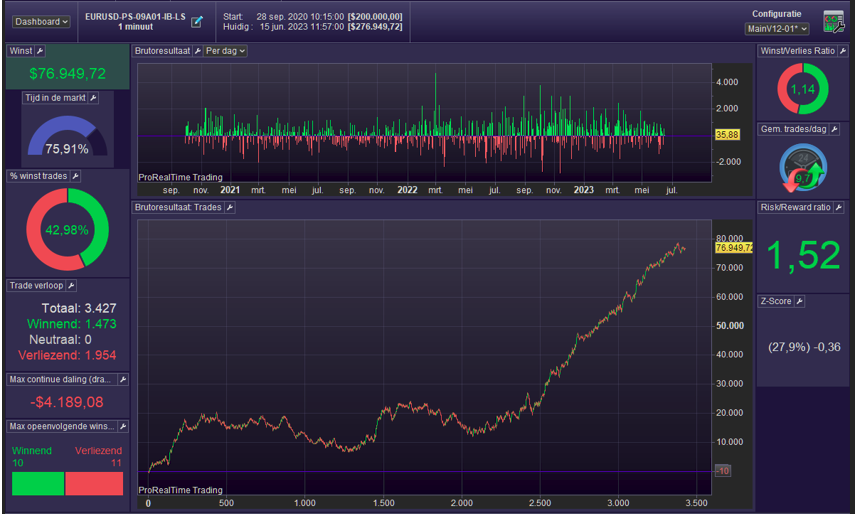
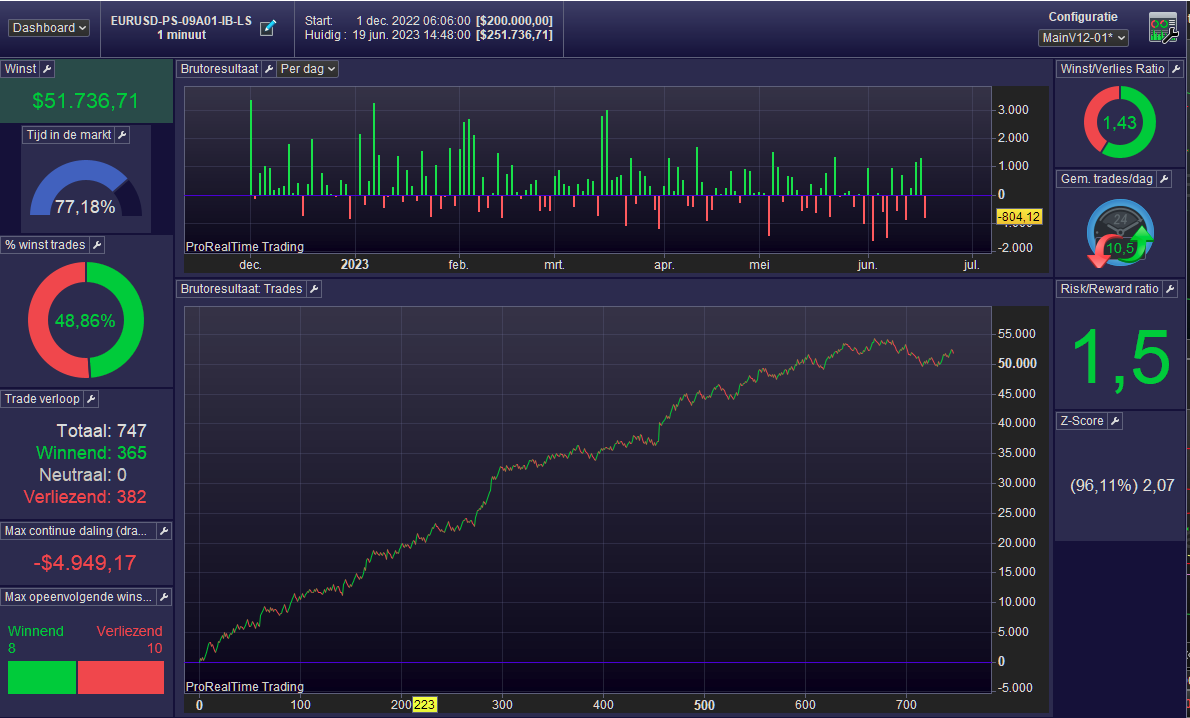
Sunday the whole of the day – except for watching F1, lead to the third and final result. All I did that day was selecting results with a technical means : the least subsequent losses which were only 2 to begin with at the end of Saturday. Thus, the fewest times that 2 subsequent losses occur. I the end result this was 2 times. Thus, over the 244 trades, only two times 2 subsequent losses occur. Notice that during the Saturday I ran into situation of none of these (so only 1 “subsequent” loss) but the curve of that I didn’t like at all.
All I did for code change was being able to cough-up those subsequent data right from the hart, instead of counting it in each result.
So as you can see, I now chose for 3 times less the revenue only because psychologically I can’t stand to see the Entry going in the wrong direction of what I would do manually, knowing that it would bring more net anyway. And careful, the sheer reason of the less revenue lays in the fewer trades. This is logic for the better entries – which thus will be fewer – but I will gain back on that by another technical means (Money Management) that anticipates less losses. I could not work on that yesterday, but I will finish that today and I will put this live instead of the old System. When it is finished, I may add the 1M backtest result and will show you that I did not bother about that this time (head in the sand). I anticipate it will be terrible.
I hope this “chronicals” will help you. It is really about the story and not about the results; a way of thinking.
Regards,
Peter