Expert Services

No recent search

VUSA daily Buy and hold v2.0
- Forums
- ProRealTime English Forum
- ProOrder: Automated Strategies & Backtesting
- VUSA daily Buy and hold v2.0
-
AuthorPosts
-
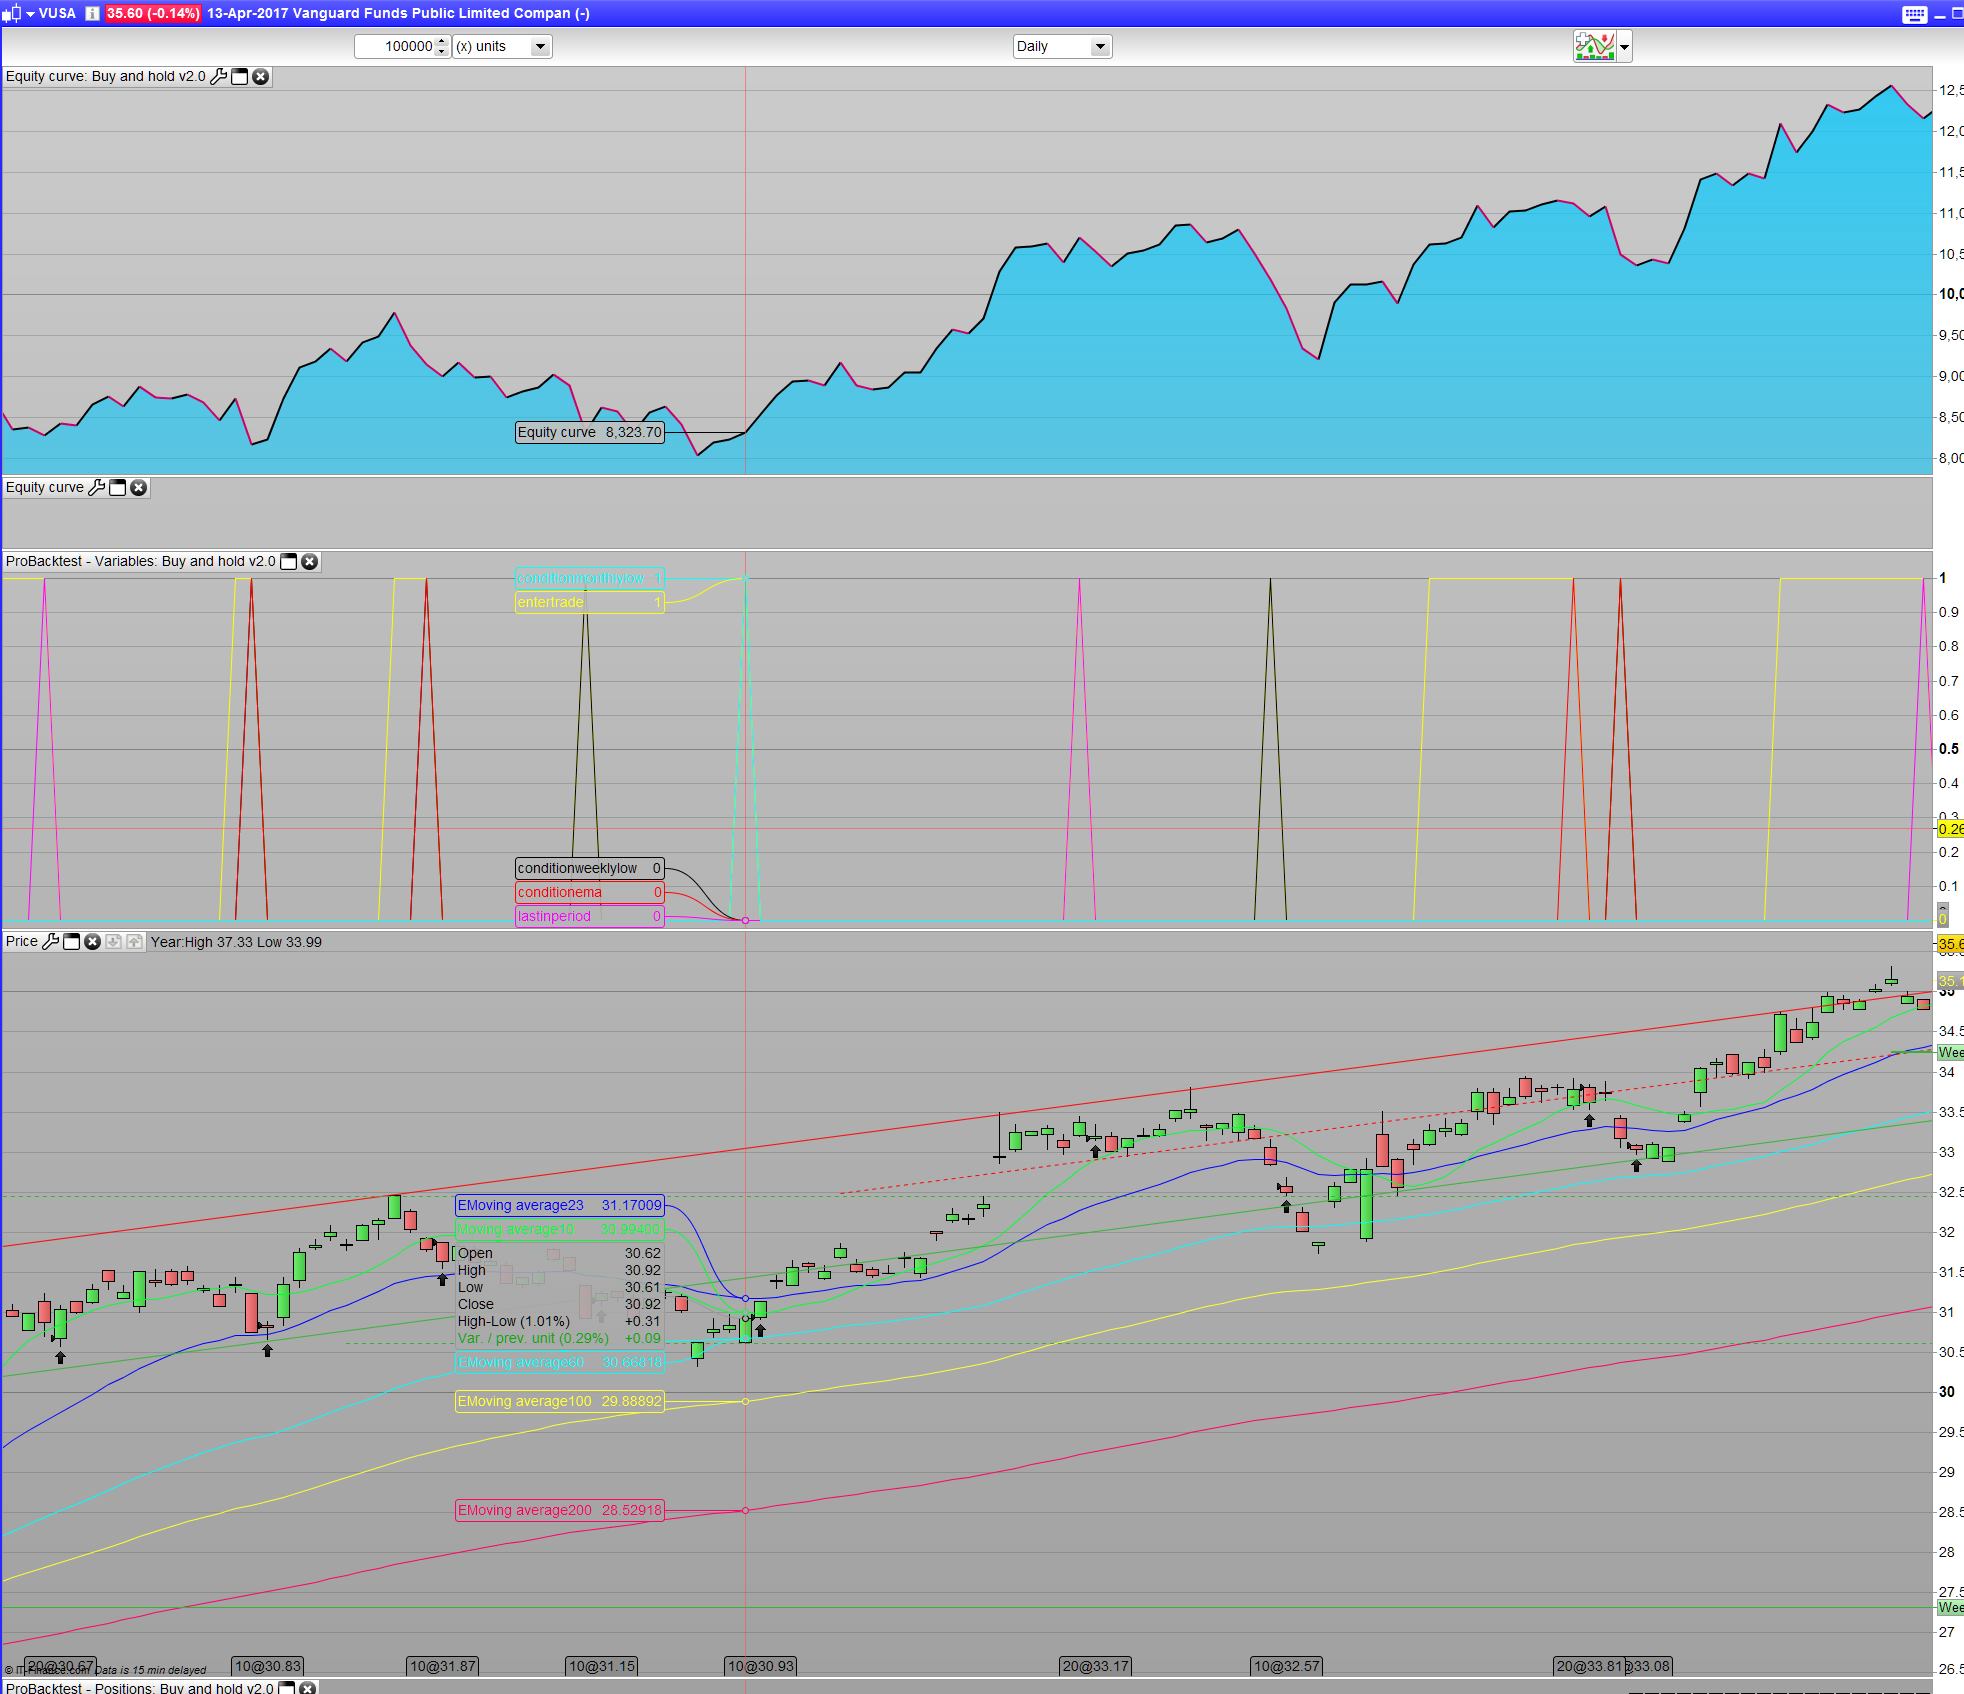
//-------------------------------------------------------------------------
// Main code : VUSA daily  Buy and hold v2.0
//Timeframe 1 Day
//Posiitonsize 10
// Kasper Elsborg @Elsborgtrading
//-------------------------------------------------------------------------
//==========Parameters===============================
DEFPARAM CumulateOrders = true // Cumulating position
DEFPARAM PRELOADBARS = 500

//====================Define Tradetime===============
IF (Time >= 090000 AND Time <= 1730000) THEN //VUSA Tradetime GMT+1
Tradetime=1
else
Tradetime=0
endif
//===================================================
//==================Define ONCE's====================
ONCE entertrade=1
ONCE CountOfTrades=0
ONCE mypos=10
//ONCE dailyHigh = 0
ONCE dailyLow = 0
//ONCE weeklyHigh = 0
//ONCE monthlyHigh = 0
ONCE monthlyLow = 0
ONCE lastWeekBarIndex = 0
ONCE lastMonthBarIndex = 0


//==================

positionsize = mypos


//==================Indicators====================
lastInPeriod=currentDayOfTheMonth = 14 or currentDayOfTheMonth = 30 and entertrade and tradetime//NEED CHECK for ending dates in weekends!!!
Myema=ExponentialAverage[10](close)//34


// calculate daily high/low (include sunday values if available)
//dailyHigh = DHigh(1)
dailyLow = DLow(1)

OnMarketBarCount=barindex-tradeindex
//==============================================================================================
//NOT IN USE, but implemented in a strategy that is a non buy and hold
// it will accumulate position counts and enter OnMarketBarCount with the number of positions you sold
//NOT WORKING ATM!!
//==============================================================================================
//Once Test1=1
//if not onmarket and test1 then
//test1=0
//mypos=countofposition[1]
//elsif onmarket then
//positionsize=mypos
//test1=1
//else
//mypos=mypos
//endif
//======================================================================================================


//Accumilate Positions if no trades in the 14 days period- an alternative to lastinperiod
if OnMarketBarCount>17 then
factor=2
//elsif OnMarketBarCount>=32 then
//factor=3
else
factor=1
endif
//=====================================================================================================


// calculate weekly high/low
If DayOfWeek < DayOfWeek[1] then
//weeklyHigh = Highest[BarIndex - lastWeekBarIndex](dailyHigh)
weeklylow = lowest[BarIndex - lastWeekBarIndex](dailylow)
lastWeekBarIndex = BarIndex
ENDIF

// calculate monthly high/low
If Month <> Month[1] then
//monthlyHigh = Highest[BarIndex - lastMonthBarIndex](dailyHigh)
monthlyLow = Lowest[BarIndex - lastMonthBarIndex](dailyLow)
lastMonthBarIndex = BarIndex
ENDIF
//monthbuy=open>monthlyHigh
//weekbuy=open>weeklyHigh

//Myema50=ExponentialAverage[x1](close)//30
//Myema200=ExponentialAverage[x2](close)//90
//
//bull=1//myema50>myema200
//bear=myema50<myema200
//=====================================Trade Conditions====================================================


//==============================Limmit Trades to one every 14th day===========
currentDayOfTheMonth = Date - ((CurrentYear * 10000) + CurrentMonth * 100)
midOfMonth = 15

if  currentDayOfTheMonth= 15 then
entertrade=1
elsif currentDayOfTheMonth = 14 and dayofweek=5 then
entertrade=1
elsif currentDayOfTheMonth = 13 and dayofweek=5 then
entertrade=1
else
entertrade=entertrade
endif

if currentDayOfTheMonth = 1  then
entertrade=1
if currentMonth = 2 or 4 or 6 or 9 or 11 then//30 days months
if currentDayOfTheMonth = 29 and dayofweek=5 then
entertrade=1
elsif currentDayOfTheMonth = 30 and dayofweek=5 then
entertrade=1
else
entertrade=entertrade
endif
if currentMonth = 1 or 3 or 5 or 7 or 8 or 10 or 12 then//31 days months
if currentDayOfTheMonth = 29 and dayofweek=5 then
entertrade=1
elsif currentDayOfTheMonth = 30 and dayofweek=5 then
entertrade=1
elsif currentDayOfTheMonth = 31 and dayofweek=5 then
entertrade=1
else
entertrade=entertrade
endif
endif
endif
endif


IF CurrentMonth = 1 or 2 or 3 or 4 or 5 or 6 or 7 or 8 or 9 or 10 or 11 or 12 THEN
IF OnMarketBarCount[1]<OnMarketBarCount and currentDayOfTheMonth <= midOfMonth and entertrade THEN
entertrade=1
CountOfTrades=CountOfTrades
elsif OnMarketBarCount[1]>OnMarketBarCount and currentDayOfTheMonth <= midOfMonth and entertrade THEN
entertrade=0
CountOfTrades=CountOfTrades+1
endif

IF OnMarketBarCount[1]<OnMarketBarCount and currentDayOfTheMonth >= midOfMonth and entertrade THEN
entertrade=1
CountOfTrades=CountOfTrades
elsif OnMarketBarCount[1]>OnMarketBarCount and currentDayOfTheMonth >= midOfMonth and entertrade THEN
entertrade=0
CountOfTrades=CountOfTrades+1
ENDIF
endif
//=============================================================================================================
conditionEMA=low crosses under myema and entertrade and tradetime //and bull
conditionMonthlylow=low crosses under monthlylow and entertrade and tradetime //and bull
conditionWeeklyLow= low crosses under weeklylow and entertrade and tradetime
lastInPeriod=(currentDayOfTheMonth = 14 or currentDayOfTheMonth = 30) and entertrade and tradetime//NEED CHECK for ending dates in weekends!!!
//lastInPeriod=currentDayOfTheMonth = 14 and entertrade and tradetime or currentDayOfTheMonth = 13 and dayofweek=5 and entertrade and tradetime or currentDayOfTheMonth = 30 and entertrade and tradetime or currentDayOfTheMonth = 29 and dayofweek=5 and entertrade and tradetime or currentDayOfTheMonth = 28 and dayofweek=5 and entertrade and tradetime
//conditionMonthlyHigh=high>MonthlyHigh and entertrade
//ConditionWeekleyHigh= high>weeklyHigh and entertrade and tradetime


//=======================================Enter LONG Position========================================
if conditionEMA or conditionMonthlylow or conditionWeeklylow or lastinperiod then//or conditionMonthlyHigh or ConditionWeekleyHigh then
buy Positionsize*factor shares at market
//if not conditionEMA and not conditionMonthlylow and not conditionWeeklylow and ConditionWeekleyHigh then
//buy Positionsize*factor shares at market
//endif
endif


//=====================================================================================================================================
//=============================================================GRAPH SECTION==========================================================
//=====================================================================================================================================
//========================================== rem out all lines from GRAPH SECTION to live trade the code=====================================
//once tradepricetest=1
//ONCE BrokerProfit=0
//once countofdays=0
//once AccumulatedTradeCost=tradeprice*mypos

//Comission from IG- given: the commission charge is 0.10% of total tradeprice or $10, whichever is higher

//comissiontest=0.001*tradeprice*positionsize
//IF OnMarketBarCount[1]<OnMarketBarCount then
//AccumulatedTradeCost=AccumulatedTradeCost
//if tradepricetest then
//AccumulatedTradeCost=AccumulatedTradeCost+tradeprice*mypos
//tradepricetest=0
//endif
//if comissiontest<10 then
//comission=10
//endif
//elsif OnMarketBarCount[1]>OnMarketBarCount then
//tradepricetest=1
//comission=comissiontest
//endif


//Capital = 500 // initial capital of account
//
//equity = Capital + StrategyProfit

//overnight fee from IG- given: (5 x 35.6425 x (2.5% + 0.25%))/365. This would give a total of £.0.0134 per evening.
//interestrate=0.025//2.5%
//adminfee=0.0025//0.25%
//overnightfee = (countofposition*tradeprice*(interestrate+adminfee))/365*countofdays //0.8 //broker overnight fee of a position (in money)
// ---equity = Capital + StrategyProfit

//DayChart=1 //can be set to bar qu
//
//if  not onmarket then
//countofdays=0
//elsif onmarket and DayOfWeek[1]<DayOfWeek then// = DayChart then
//countofdays=countofdays+1
//else
//countofdays=countofdays
//endif

//floatingprofit = ((((close-positionprice)*pointvalue)*countofposition)/pipsize)-(overnightfee+comission)//+(overnightfee+comission) //actual trade gains
//Brokerprofit=((((close-positionprice)*pointvalue)*countofposition)/pipsize)-Floatingprofit
//BrokerProfitinProcent=(((floatingprofit-Brokerprofit)/floatingprofit)-1)*100
//TrueEquity=AccumulatedTradeCost+floatingprofit+capital
//TrueProfitInProcent=((TrueEquity/AccumulatedTradeCost)-1)*100

//graph conditionMonthlyHigh COLOURED(0,0,255) AS "conditionMonthlyHigh"
//graph ConditionWeekleyHigh COLOURED(0,255,0) AS "ConditionWeekleyHigh"
//graph TrueEquity COLOURED(0,0,255) AS "trueEquity"

//graph BrokerProfit COLOURED(255,0,0) AS "BrokerProfit"
//graph countofdays COLOURED(0,0,0) AS "countofdays"
//graph entertrade COLOURED(255,255,0) AS "entertrade"
//graph conditionWeeklyLow COLOURED(0,0,0) AS "conditionWeeklyLow"
//graph conditionEMA COLOURED(255,0,0) AS "conditionEMA"
//graph lastinperiod COLOURED(255,0,255) AS "lastinperiod"
//graph conditionMonthlylow COLOURED(0,255,255) AS "conditionMonthlylow"
//graph tradetime  COLOURED(0,255,0) AS "tradetime"
//graph overnightfee COLOURED(0,0,0) AS "overnightfee"
//graph floatingprofit+capital COLOURED(0,0,0) AS "floatingprofit"
//graph BrokerProfit COLOURED(0,0,0) AS "BrokerProfit"
//graph countofdays COLOURED(255,255,255) AS "countofdays"
//graph OnMarketBarCount COLOURED(0,255,255) AS "OnMarketBarCount"
//graph CountOfTrades COLOURED(255,255,255) AS "CountOfTrades"
//graph comission COLOURED(255,0,255) AS "comission"
//graph AccumulatedTradeCost COLOURED(0,255,0) AS "AccumulatedTradeCost"
//graph tradeprice COLOURED(255,0,255) AS "tradeprice"
//graph TrueProfitInProcent COLOURED(255,0,255) AS "TrueProfitInProcent"
//graph BrokerProfit COLOURED(255,0,0) AS "BrokerProfit"
//graph BrokerProfitinProcent COLOURED(255,255,0) AS "BrokerProfitinProcent"
//graph marketchange COLOURED(255,0,0) AS "marketchange"


//=====================================================================================================================================
//=============================================================GRAPH SECTION END======================================================
//=====================================================================================================================================

//=================================EXIT and QUIT if market falls below 25% within a 365 days period

yearhigh =highest[365](high)
marketchange=((close/yearhigh)-1)*100
if onmarket and marketchange<-25 then
sell at market
elsif countofposition[1]>countofposition then
quit
endif
Here is a Buy and hold strategy on Vanguard Funds Public Limited Companey – Vanguard S&P 500 UCITS ETF
Remeber you and you only are entirely responsible for: what and how you invest your money, your risk, you gain, your losses. So do you homework an research before venturing into investing and trading. This is just an example on how it could have been if you invested 4,7 years ago, not guarantee for the future.
Cheers Kasper
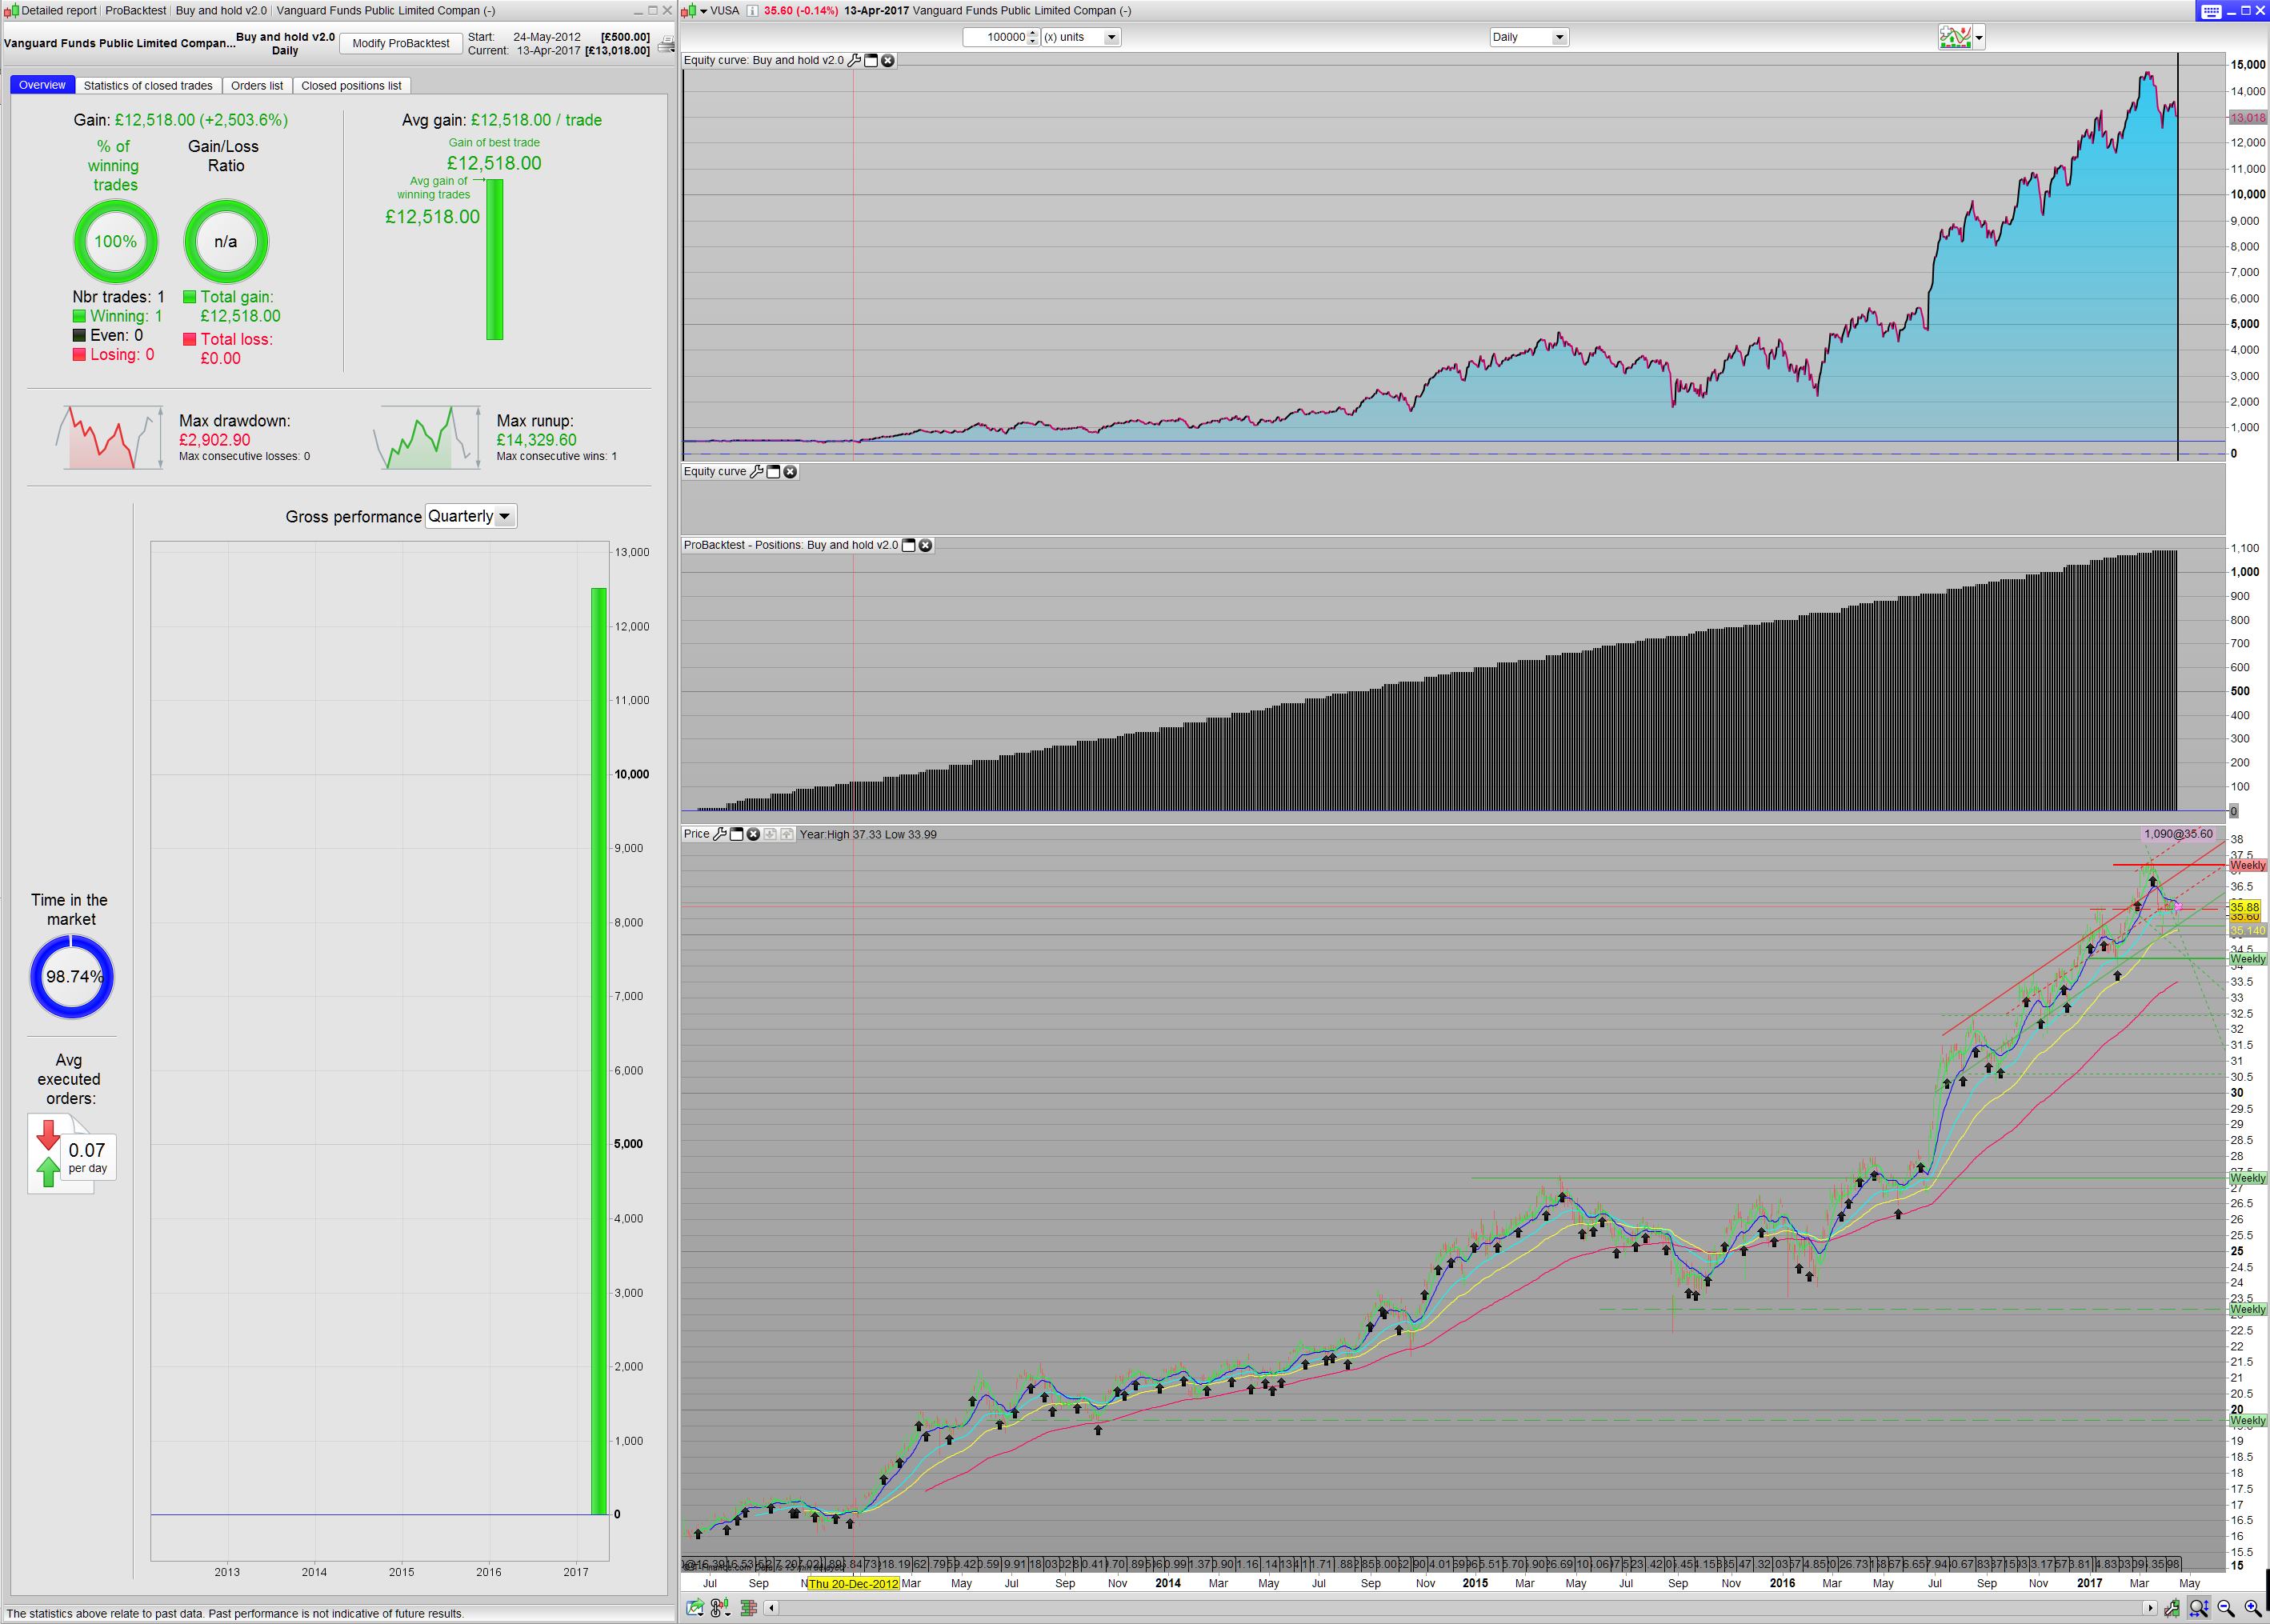
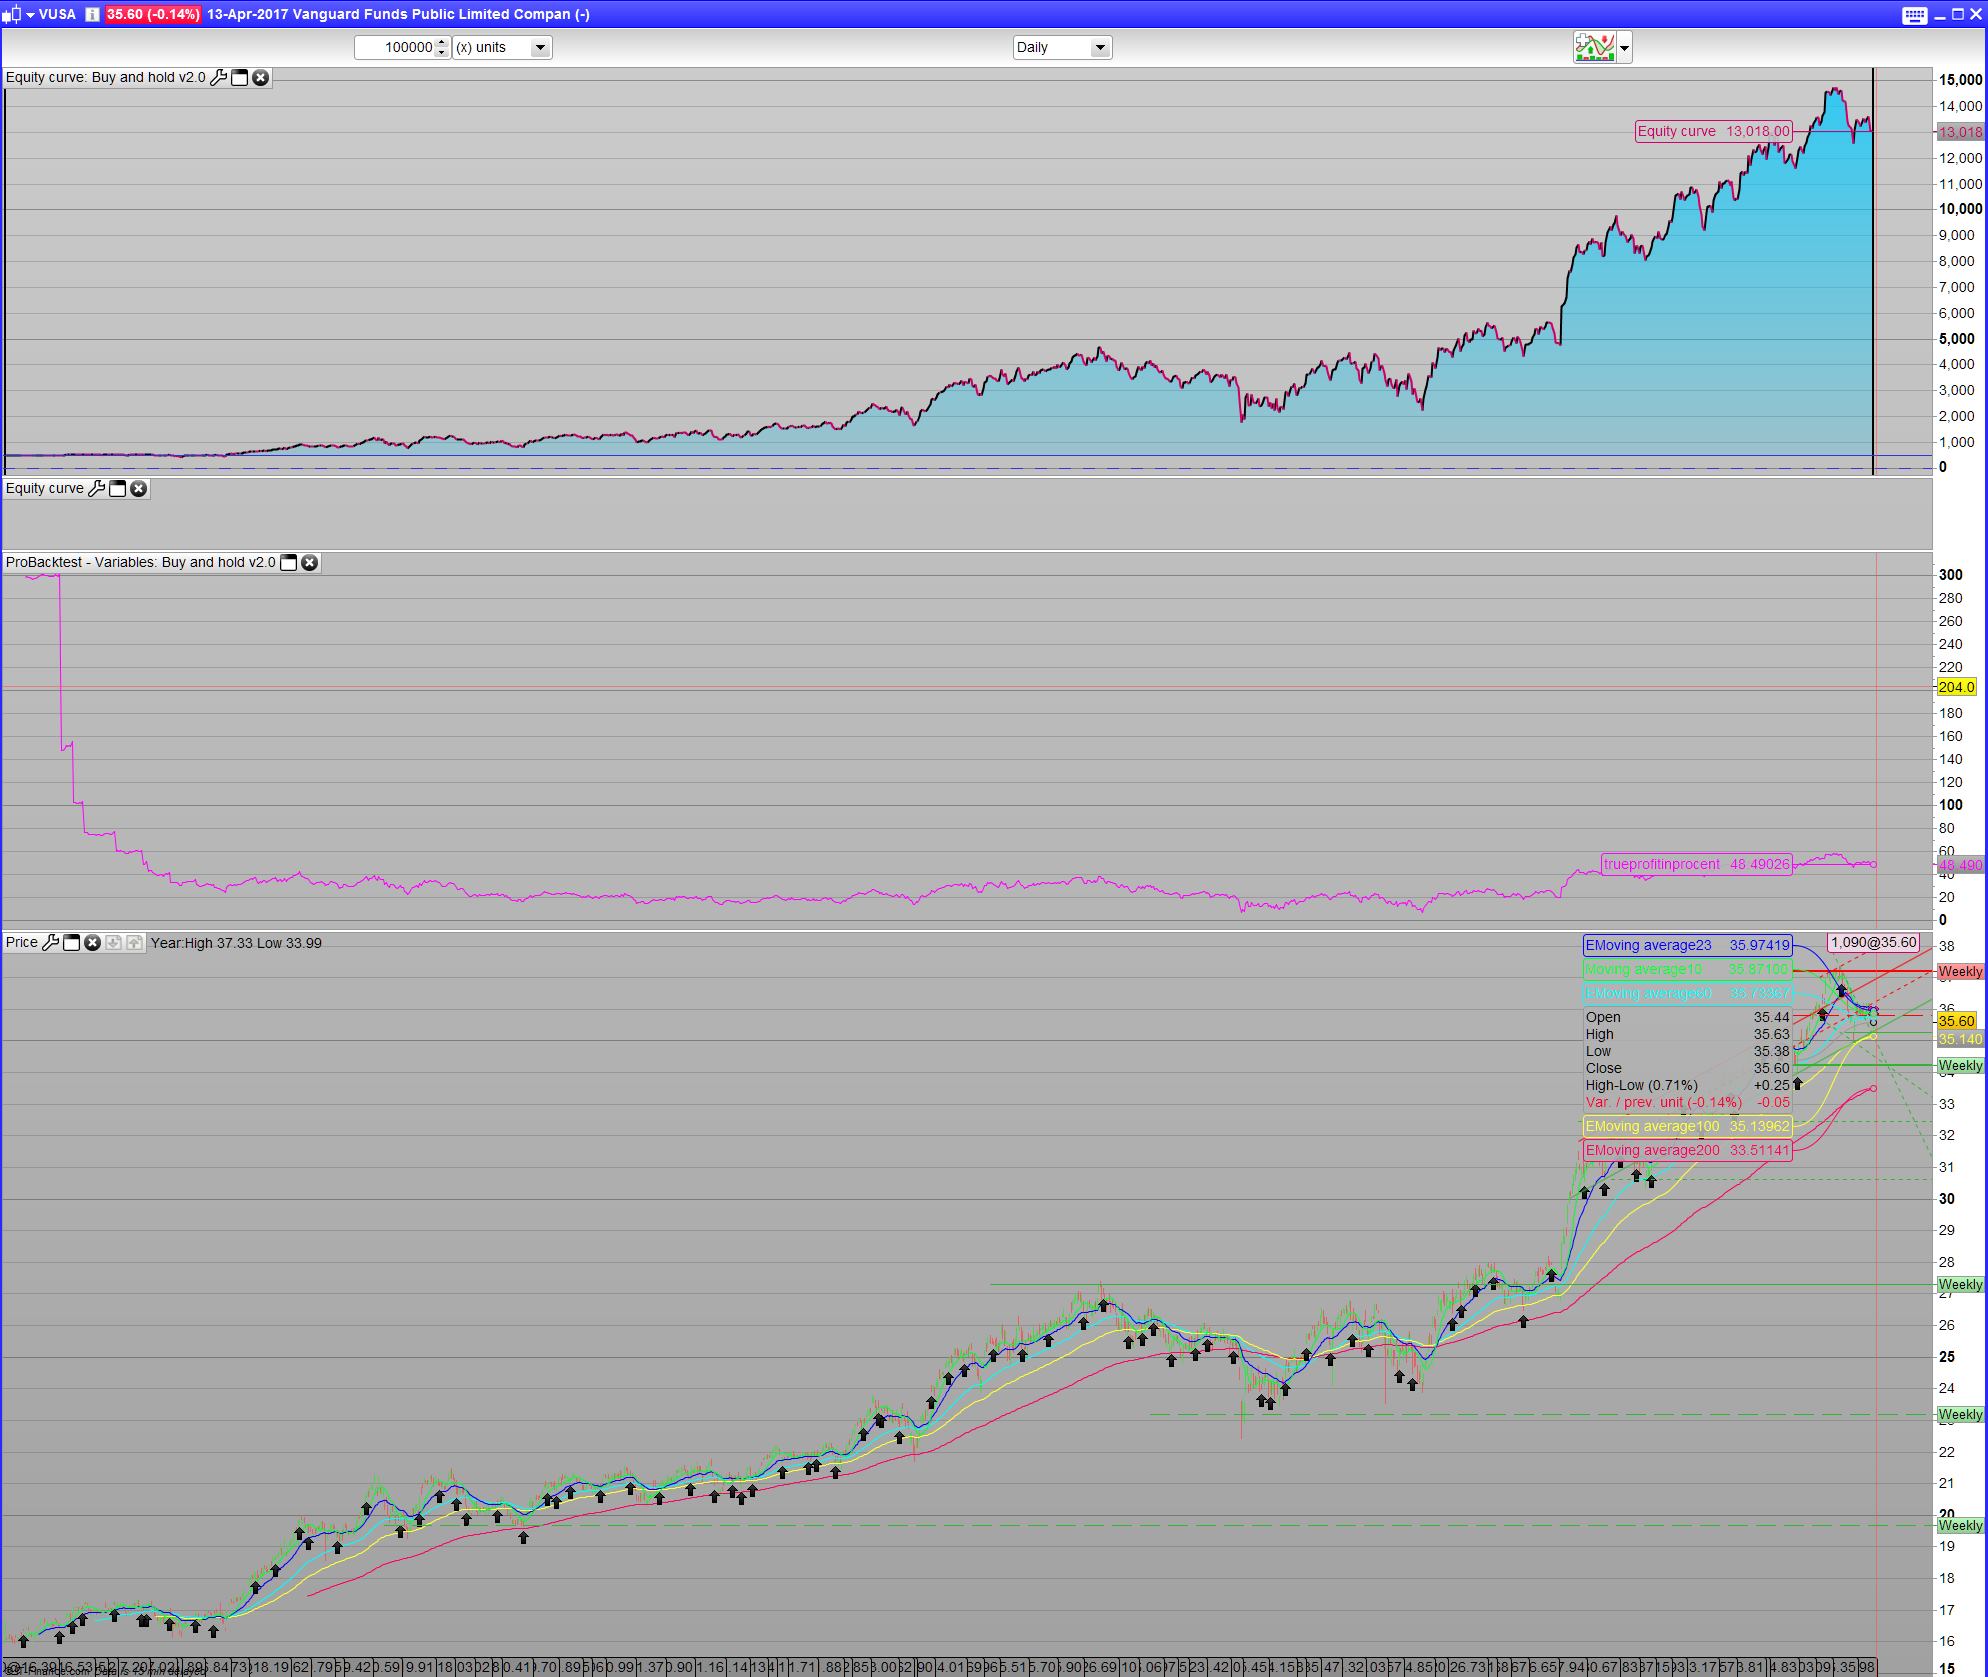
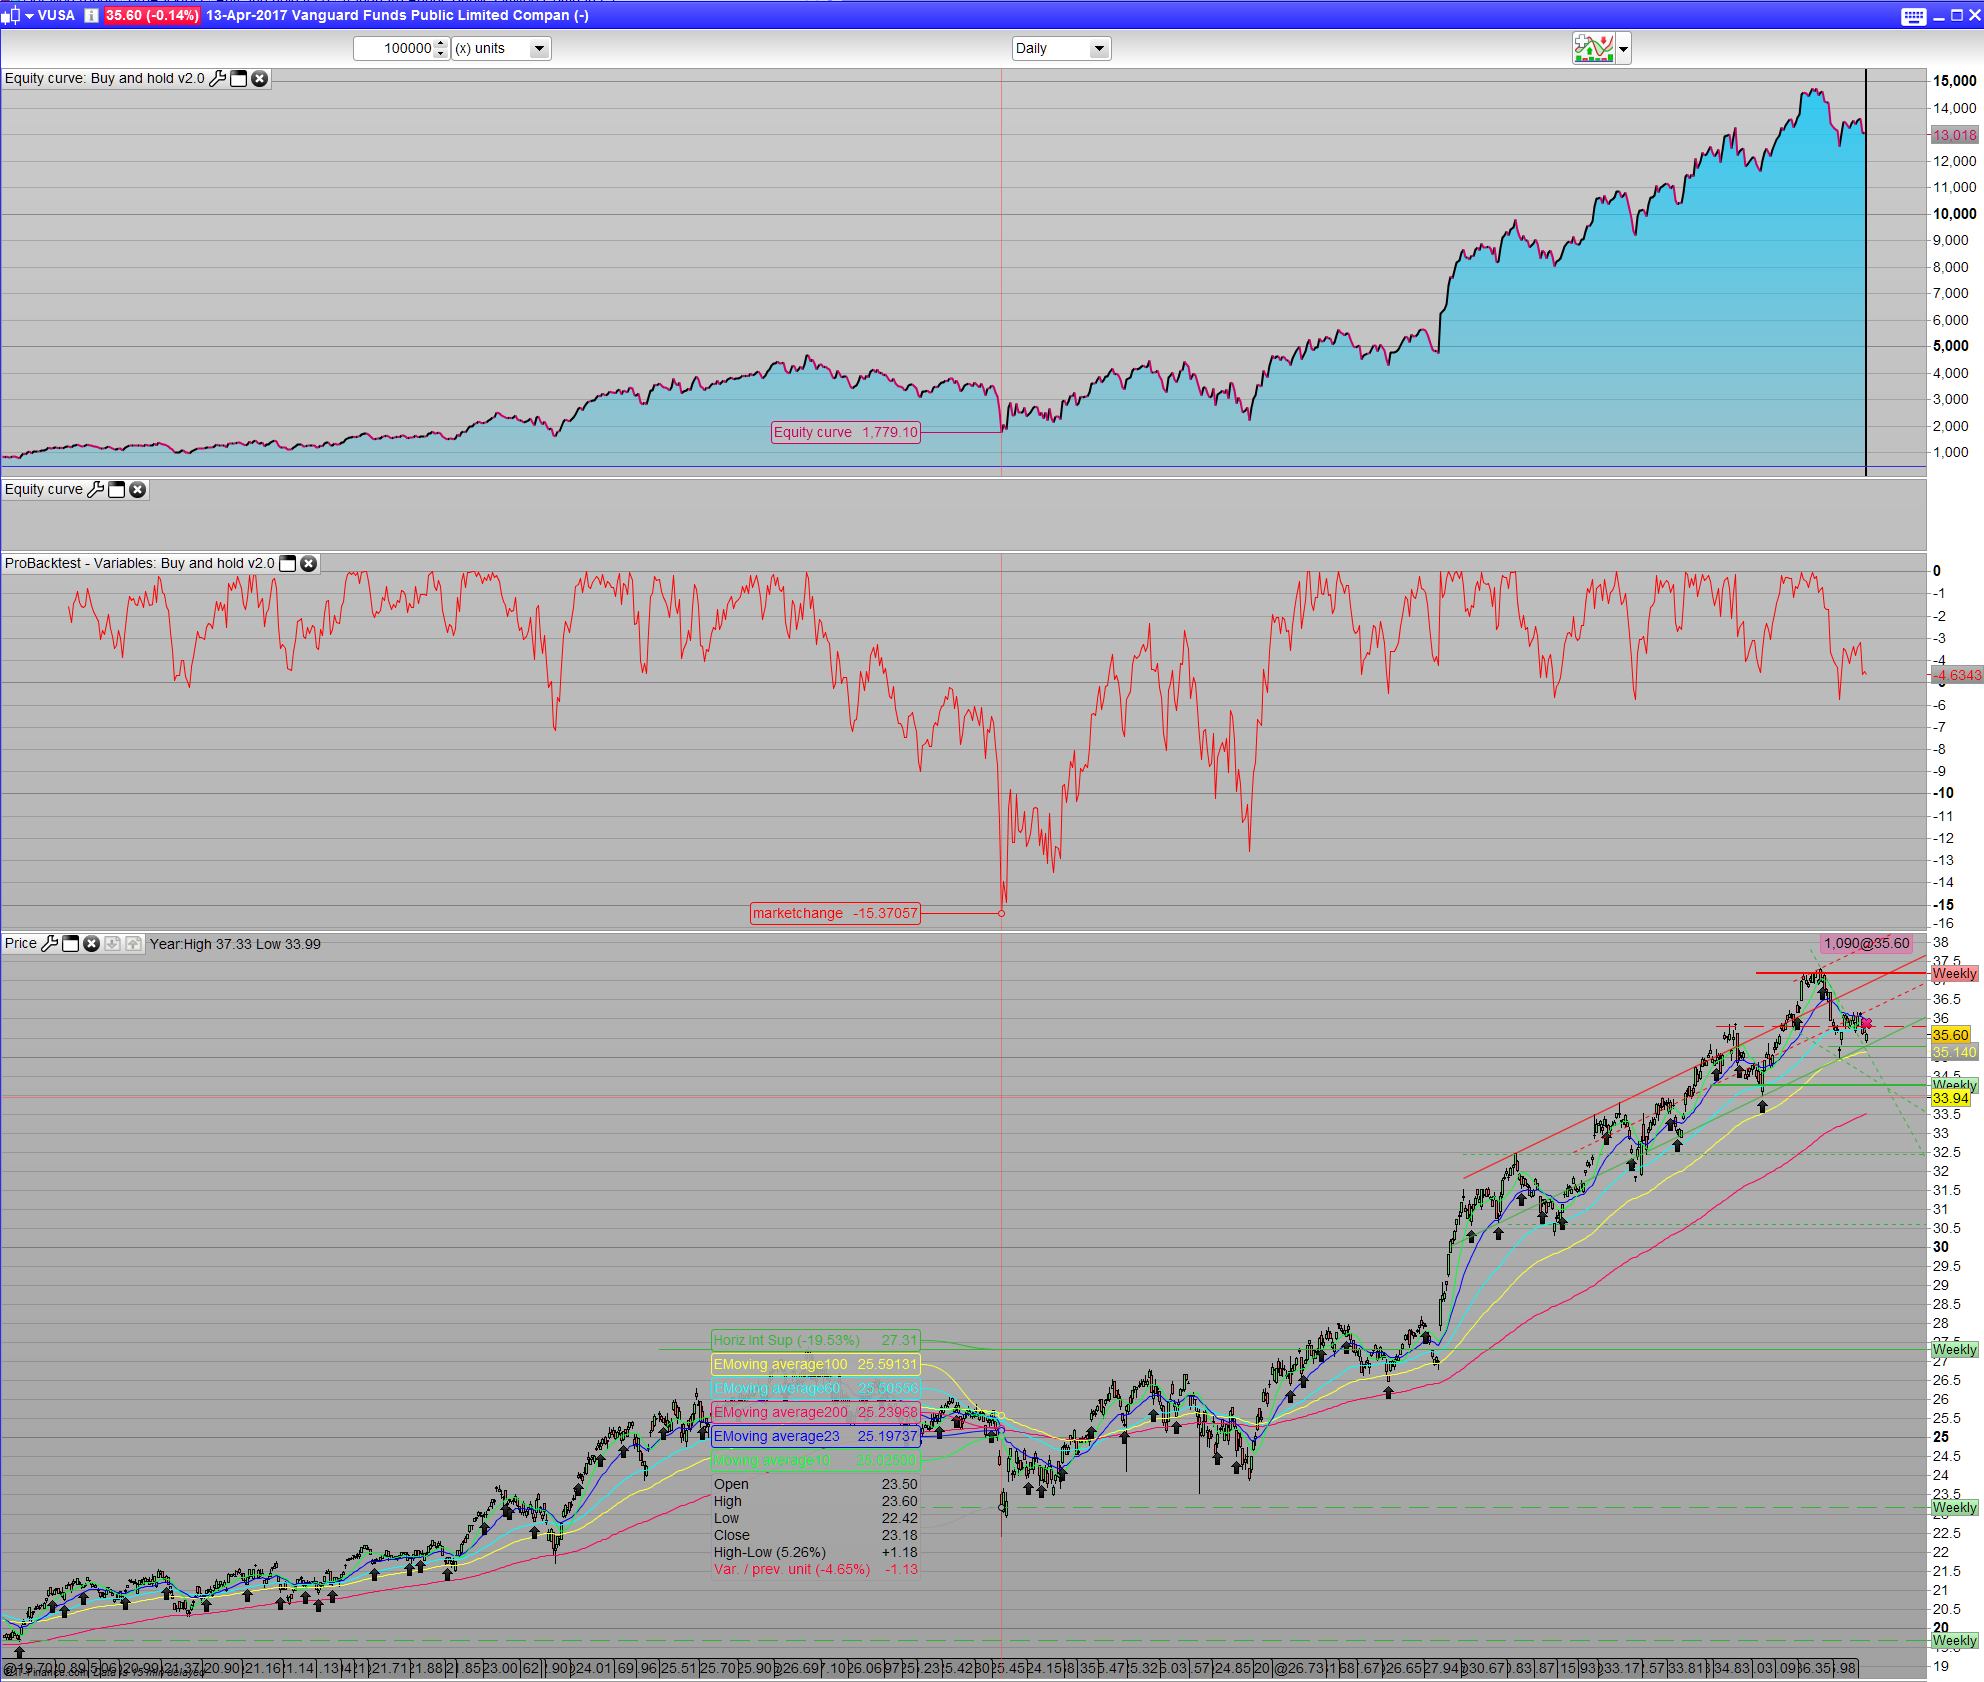
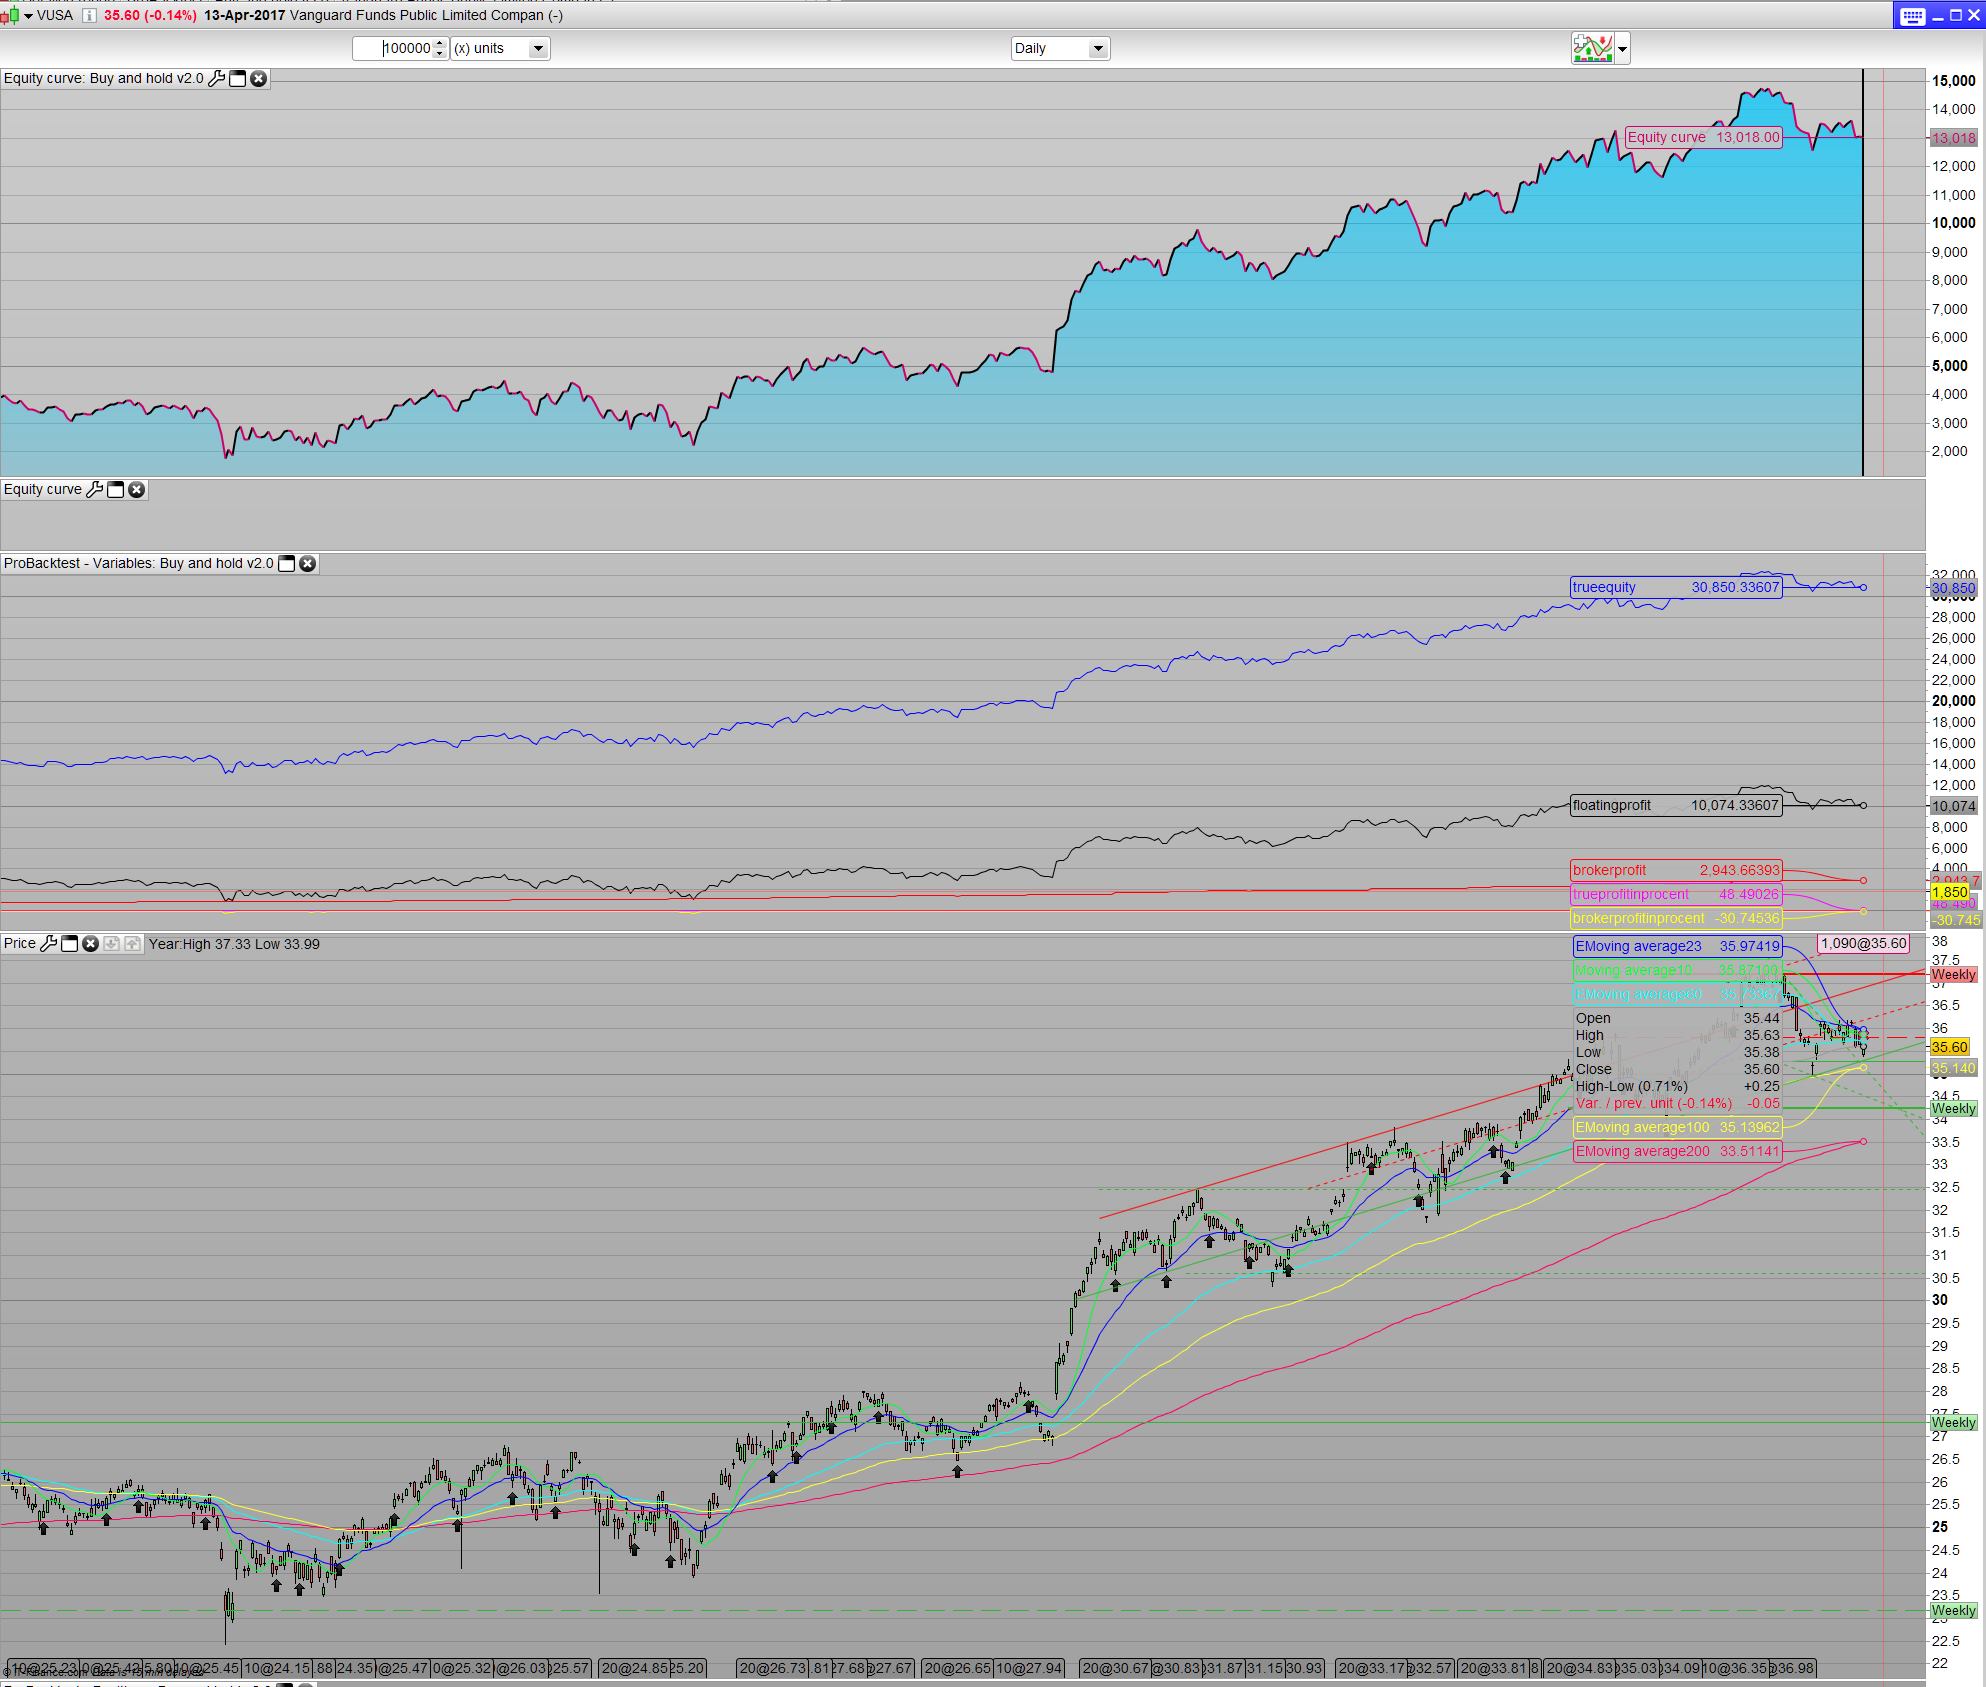
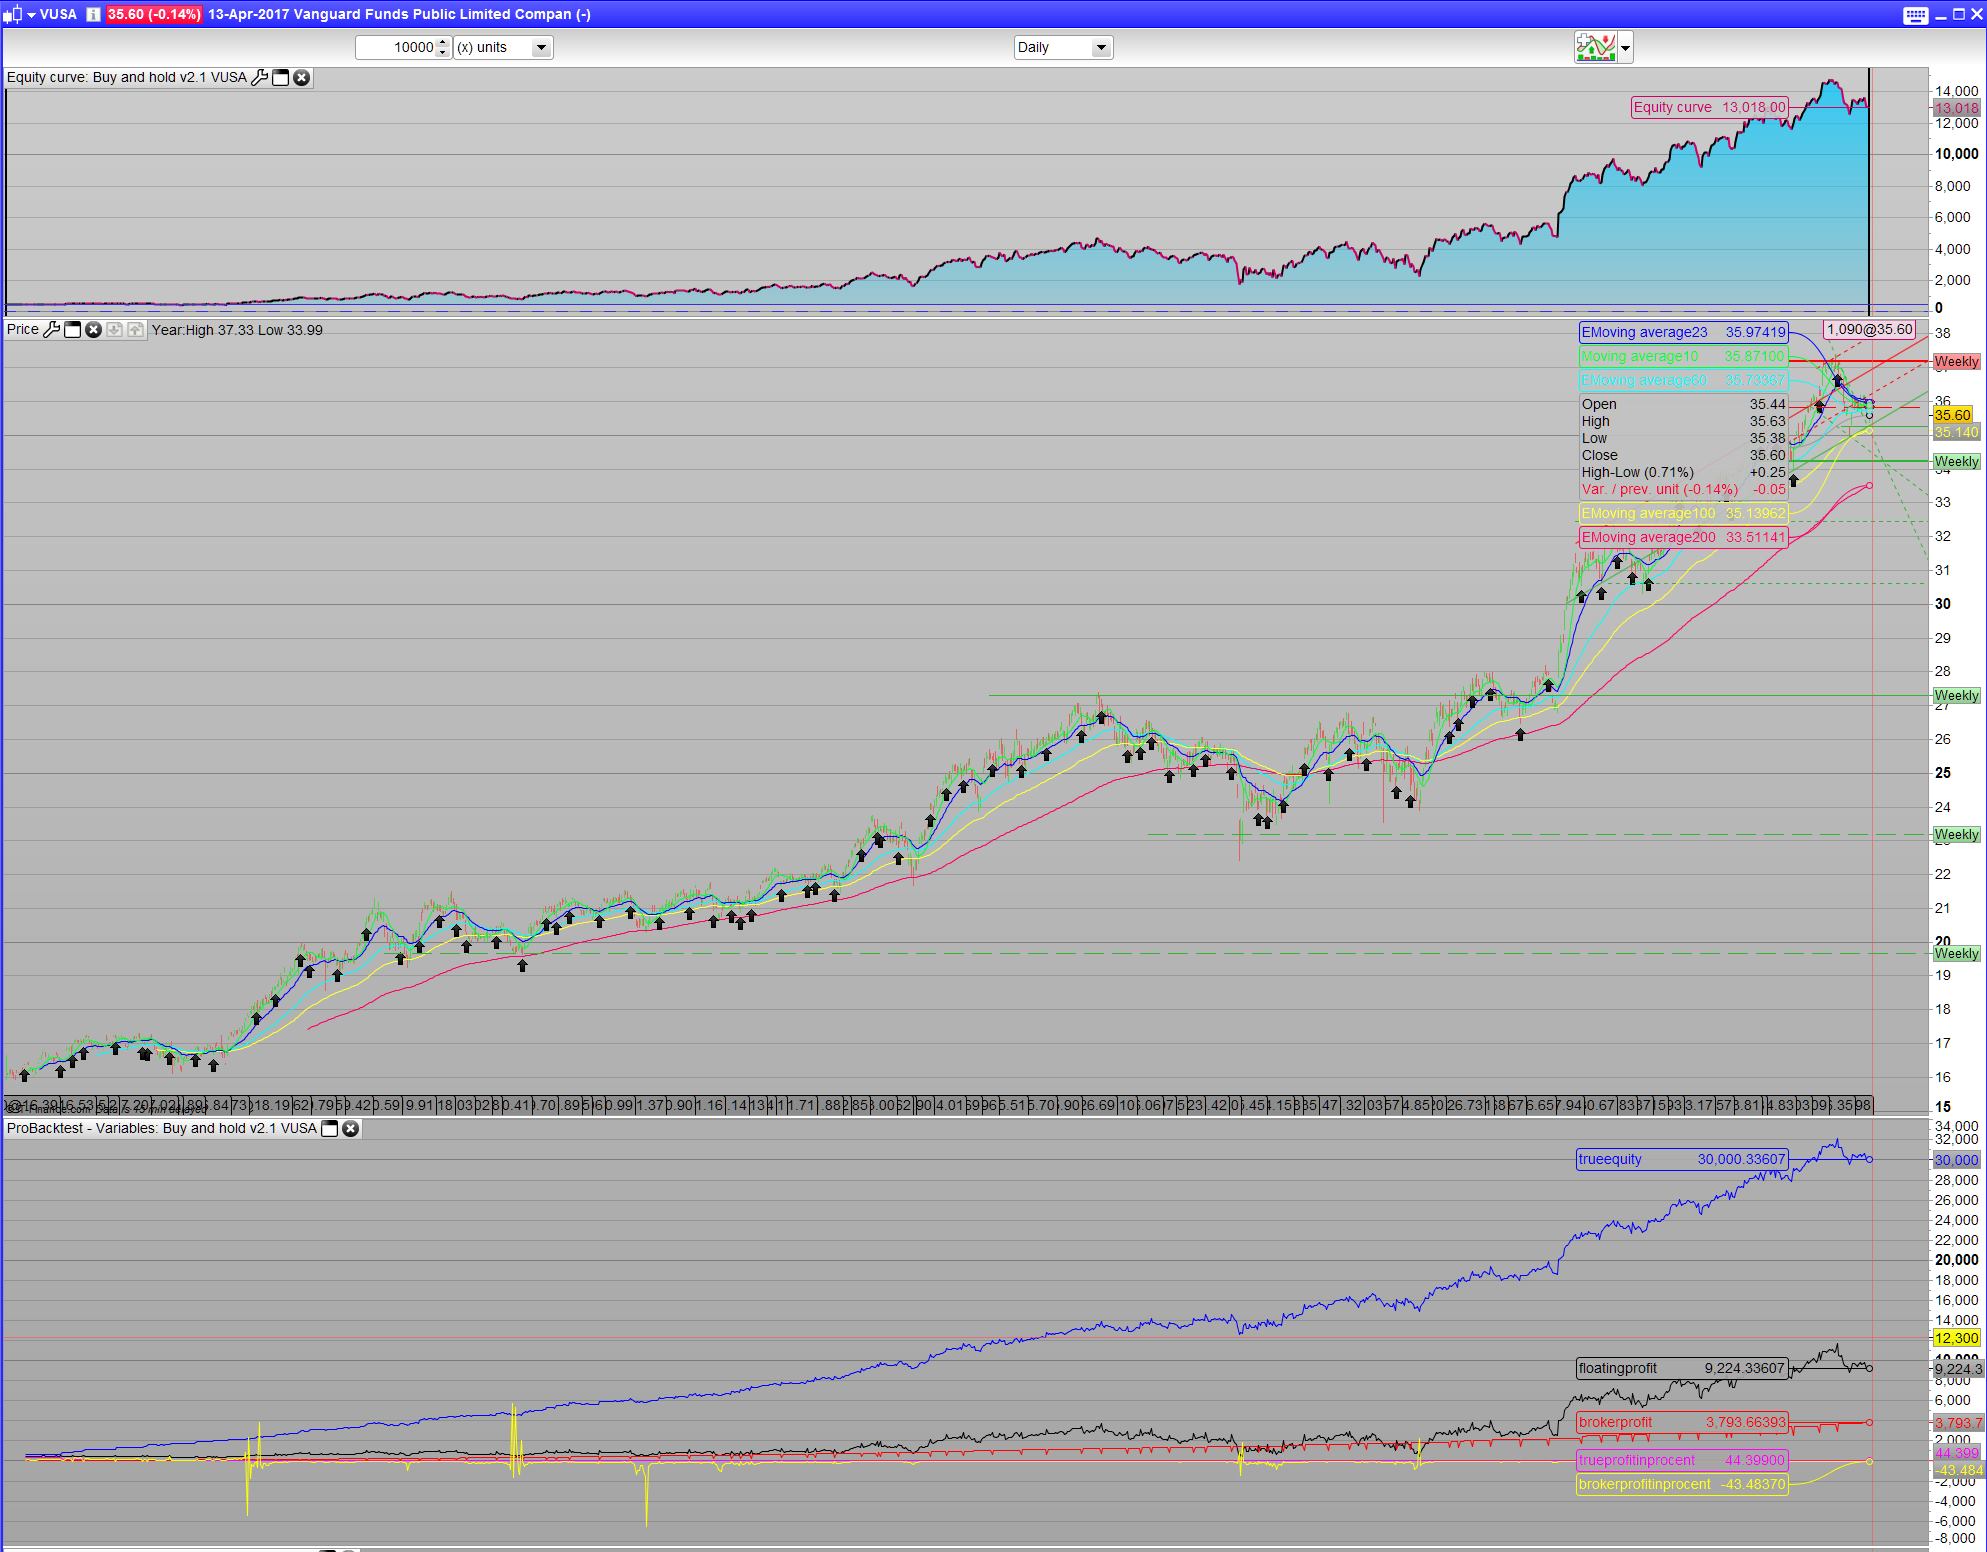
Settle down guys, Gains of +2500% is not correct. Sorry to spoil it all so soon- the explaintion will follow. But first a little intro. I wanted to make a lasting strategy. I am becomming a bit tired of trying to develop codes that enters and exits all the time- and at the same time to be profitable. I haven’t found any one yet that suites my risk profile for short term intradaytrading. A risk profile was something I heard about straight away when I began trading”you gotta have a riskprofile!!” was almost demanded when listing to various webinars and what knot. But as a noobtrader it didn’t know what to consider so how would I put one together? I didn’t really think about it for a while or did take the time to define if, before I read this: ” I am willing to risk a lot” -the explaination was, this actually only goes in the profit direction- so what people are really saying is that they are willing to profit a lot, but if you were loosing- it dosen’t really apply here. So I needed to start think of the risk, because I saw a lot of strategies on this site, not having defined any Stoploss and take profit that will result in an RR- RiskReward of at least 1.6 (including myself). Some of the most popular strateguies here will risk half of your equity in one trade, and more or less have a constant RR on 0.05- even though it backtest very well. But backtest is not live trading- regardles! Well when I read trading books, and about statistics,- these things should be well defined or you will loose your money to the broker. It is just a statistically fact- that risking more than 1-1,5% of your equity pr trade -will eventually lead to ruin and margin calls. So why? Again people are willing to make a lot of money and are blinded by these facts and don’t think it will loose because of the “out of this would” backtest gaining 500 or 800% in 2,5 year backtest. Let e put it this way. If you could be constant proffitable by a 25% a year- Goldman Sacks would call you and offer you a leading traders position- hands down! I am not saying that making more is not possible- you often read of people making a living of daytrading with a profitable og 80-150% a year the last couple of years. The documentation says, that is actually only 5% of all traders that could make a living out of it. The last book I read about trading stated that noone including the world leading hedgefund managers would beat the market 3 years in a row. You just never hear about the failing part. So why can’t they or you for that matter beat the market? Because you are the market. Anyone beating the market 3 years in a row- is just pure luck- at least that is what I read. Only one that beats the market is the Brokers, but they are not really trading- only making money of you- whether or not you loose or win a trade. The overnight fee, the comission and spreads, slipages, and minimum stoploss that are juuuust that big that your code won’t make a profit. Countless times I have made a perfect code, only to prove it non profitable because of these factors. The best trader from a brokers perspective is the one that makes 100 of trades or more a month- but not really loosing or gaining to much. If he looses he will stop trading, if he wins, he will be put in the direct market and not the b-list. Direct market is not guaranteed to fill you orders, like the b-list. B- lists bets against the brokers- hence marketmakers- and 95% are loosing. The worst traders in a brokers perspective is the buy and hold ones… So that is what we will do. Warren Buffet did not become the worlds most profitable invester by daytrading- he’s buying and holding- and he’s is saying “go ETF’s”. In good faith the referances for the recent books I read was. The little book of bulletproof investing, The little book of Behavioral Investing, The element of investing I made up this code, for a buy and hold strategy- but what I really set out to do was to get all the factors included. The comission, the overnightfee and the spread- well there is no spread in ETF’s, so forget about that. This took actually over 10 times the hours that actually spend coding the strategy. Just remember these things matters! And what I initially thought was the culprit turns out not to be- the overnight fees is the bastard, not the comission. The equity (13086 Euro) dispalyed here by PRT is without any cost. I want to calculate them manually in the following. As I got the result it yield a staggering gain of +2500% in 4,7 years. But as we will see, it’s not. My main problem was to prove these things and calculate the numbers in a Graph like manner. So now I turn to the community to try and disprove my strategy, and calculation. Has I been mistaken or made an error?- forgotten something? I read that when a sucessfull hedemanager found a company he’d like to invest in- he’d tried to destroy that company with all he got- if it was not possible, It a good investment. The case will hold even through bad times. So please comment and try and take the code and my findings apart These was my bullets.- A buy and hold strategy.
- Make a monthly payment
- Make 2 buy’s a month
- Consider overnightfees and comissions
- Calculate the True equity that also takes your monthly payment in considerration.
- Calculate the correct earnings in %
- Risk profile
- Other considerrations.
- Broker cost in total
- A buy and hold strategy.
- Make a monthly payment
- Make 2 buy’s a month
		//=====================================================================================================================================
		//=============================================================GRAPH SECTION==========================================================
		//=====================================================================================================================================
		//========================================== rem out all lines from GRAPH SECTION to live trade the code=====================================
		//once tradepricetest=1
		//ONCE BrokerProfit=0
		once countofdays=0
		//once AccumulatedTradeCost=tradeprice*mypos

		//Comission from IG- given: the commission charge is 0.10% of total tradeprice or $10, whichever is higher

		//comissiontest=0.001*tradeprice*positionsize
		//IF OnMarketBarCount[1]<OnMarketBarCount then
		//AccumulatedTradeCost=AccumulatedTradeCost
		//if tradepricetest then
		//AccumulatedTradeCost=AccumulatedTradeCost+tradeprice*mypos
		//tradepricetest=0
		//endif
		//if comissiontest<10 then
		//comission=10
		//endif
		//elsif OnMarketBarCount[1]>OnMarketBarCount then
		//tradepricetest=1
		//comission=comissiontest
		//endif


		//Capital = 500 // initial capital of account
		//
		//equity = Capital + StrategyProfit

		//overnight fee from IG- given: (5 x 35.6425 x (2.5% + 0.25%))/365. This would give a total of £.0.0134 per evening.
		//interestrate=0.025//2.5%
		//adminfee=0.0025//0.25%
		//overnightfee = (countofposition*tradeprice*(interestrate+adminfee))/365*countofdays //0.8 //broker overnight fee of a position (in money)
		// ---equity = Capital + StrategyProfit

		//DayChart=1 //can be set to bar qu
		//
		if  not onmarket then
		countofdays=0
		elsif onmarket and DayOfWeek[1]<DayOfWeek then// = DayChart then
		countofdays=countofdays+1
		else
		countofdays=countofdays
		endif

		//floatingprofit = ((((close-positionprice)*pointvalue)*countofposition)/pipsize)-(overnightfee+comission)//+(overnightfee+comission) //actual trade gains
		//Brokerprofit=((((close-positionprice)*pointvalue)*countofposition)/pipsize)-Floatingprofit
		//BrokerProfitinProcent=(((floatingprofit-Brokerprofit)/floatingprofit)-1)*100
		//TrueEquity=AccumulatedTradeCost+floatingprofit+capital
		//TrueProfitInProcent=((TrueEquity/AccumulatedTradeCost)-1)*100

		//graph conditionMonthlyHigh COLOURED(0,0,255) AS "conditionMonthlyHigh"
		//graph ConditionWeekleyHigh COLOURED(0,255,0) AS "ConditionWeekleyHigh"
		//graph TrueEquity COLOURED(0,0,255) AS "trueEquity"

		//graph BrokerProfit COLOURED(255,0,0) AS "BrokerProfit"
		//graph countofdays COLOURED(0,0,0) AS "countofdays"
		graph entertrade COLOURED(255,255,0) AS "entertrade"
		graph conditionWeeklyLow COLOURED(0,0,0) AS "conditionWeeklyLow"
		graph conditionEMA COLOURED(255,0,0) AS "conditionEMA"
		graph lastinperiod COLOURED(255,0,255) AS "lastinperiod"
		graph conditionMonthlylow COLOURED(0,255,255) AS "conditionMonthlylow"
		//graph tradetime  COLOURED(0,255,0) AS "tradetime"
		//graph overnightfee COLOURED(0,0,0) AS "overnightfee"
		//graph floatingprofit+capital COLOURED(0,0,0) AS "floatingprofit"
		//graph BrokerProfit COLOURED(0,0,0) AS "BrokerProfit"
		//graph countofdays COLOURED(255,255,255) AS "countofdays"
		//graph OnMarketBarCount COLOURED(0,255,255) AS "OnMarketBarCount"
		//graph CountOfTrades COLOURED(255,255,255) AS "CountOfTrades"
		//graph comission COLOURED(255,0,255) AS "comission"
		//graph AccumulatedTradeCost+capital COLOURED(0,255,0) AS "AccumulatedTradeCost"
		//graph tradeprice COLOURED(255,0,255) AS "tradeprice"
		//graph TrueProfitInProcent COLOURED(255,0,255) AS "TrueProfitInProcent"
		//graph BrokerProfit COLOURED(255,0,0) AS "BrokerProfit"
		//graph BrokerProfitinProcent COLOURED(255,255,0) AS "BrokerProfitinProcent"
		//graph marketchange COLOURED(255,0,0) AS "marketchange"


		//=====================================================================================================================================
		//=============================================================GRAPH SECTION END======================================================
		//=====================================================================================================================================
Wing thanked this post- Consider overnightfees and comissions
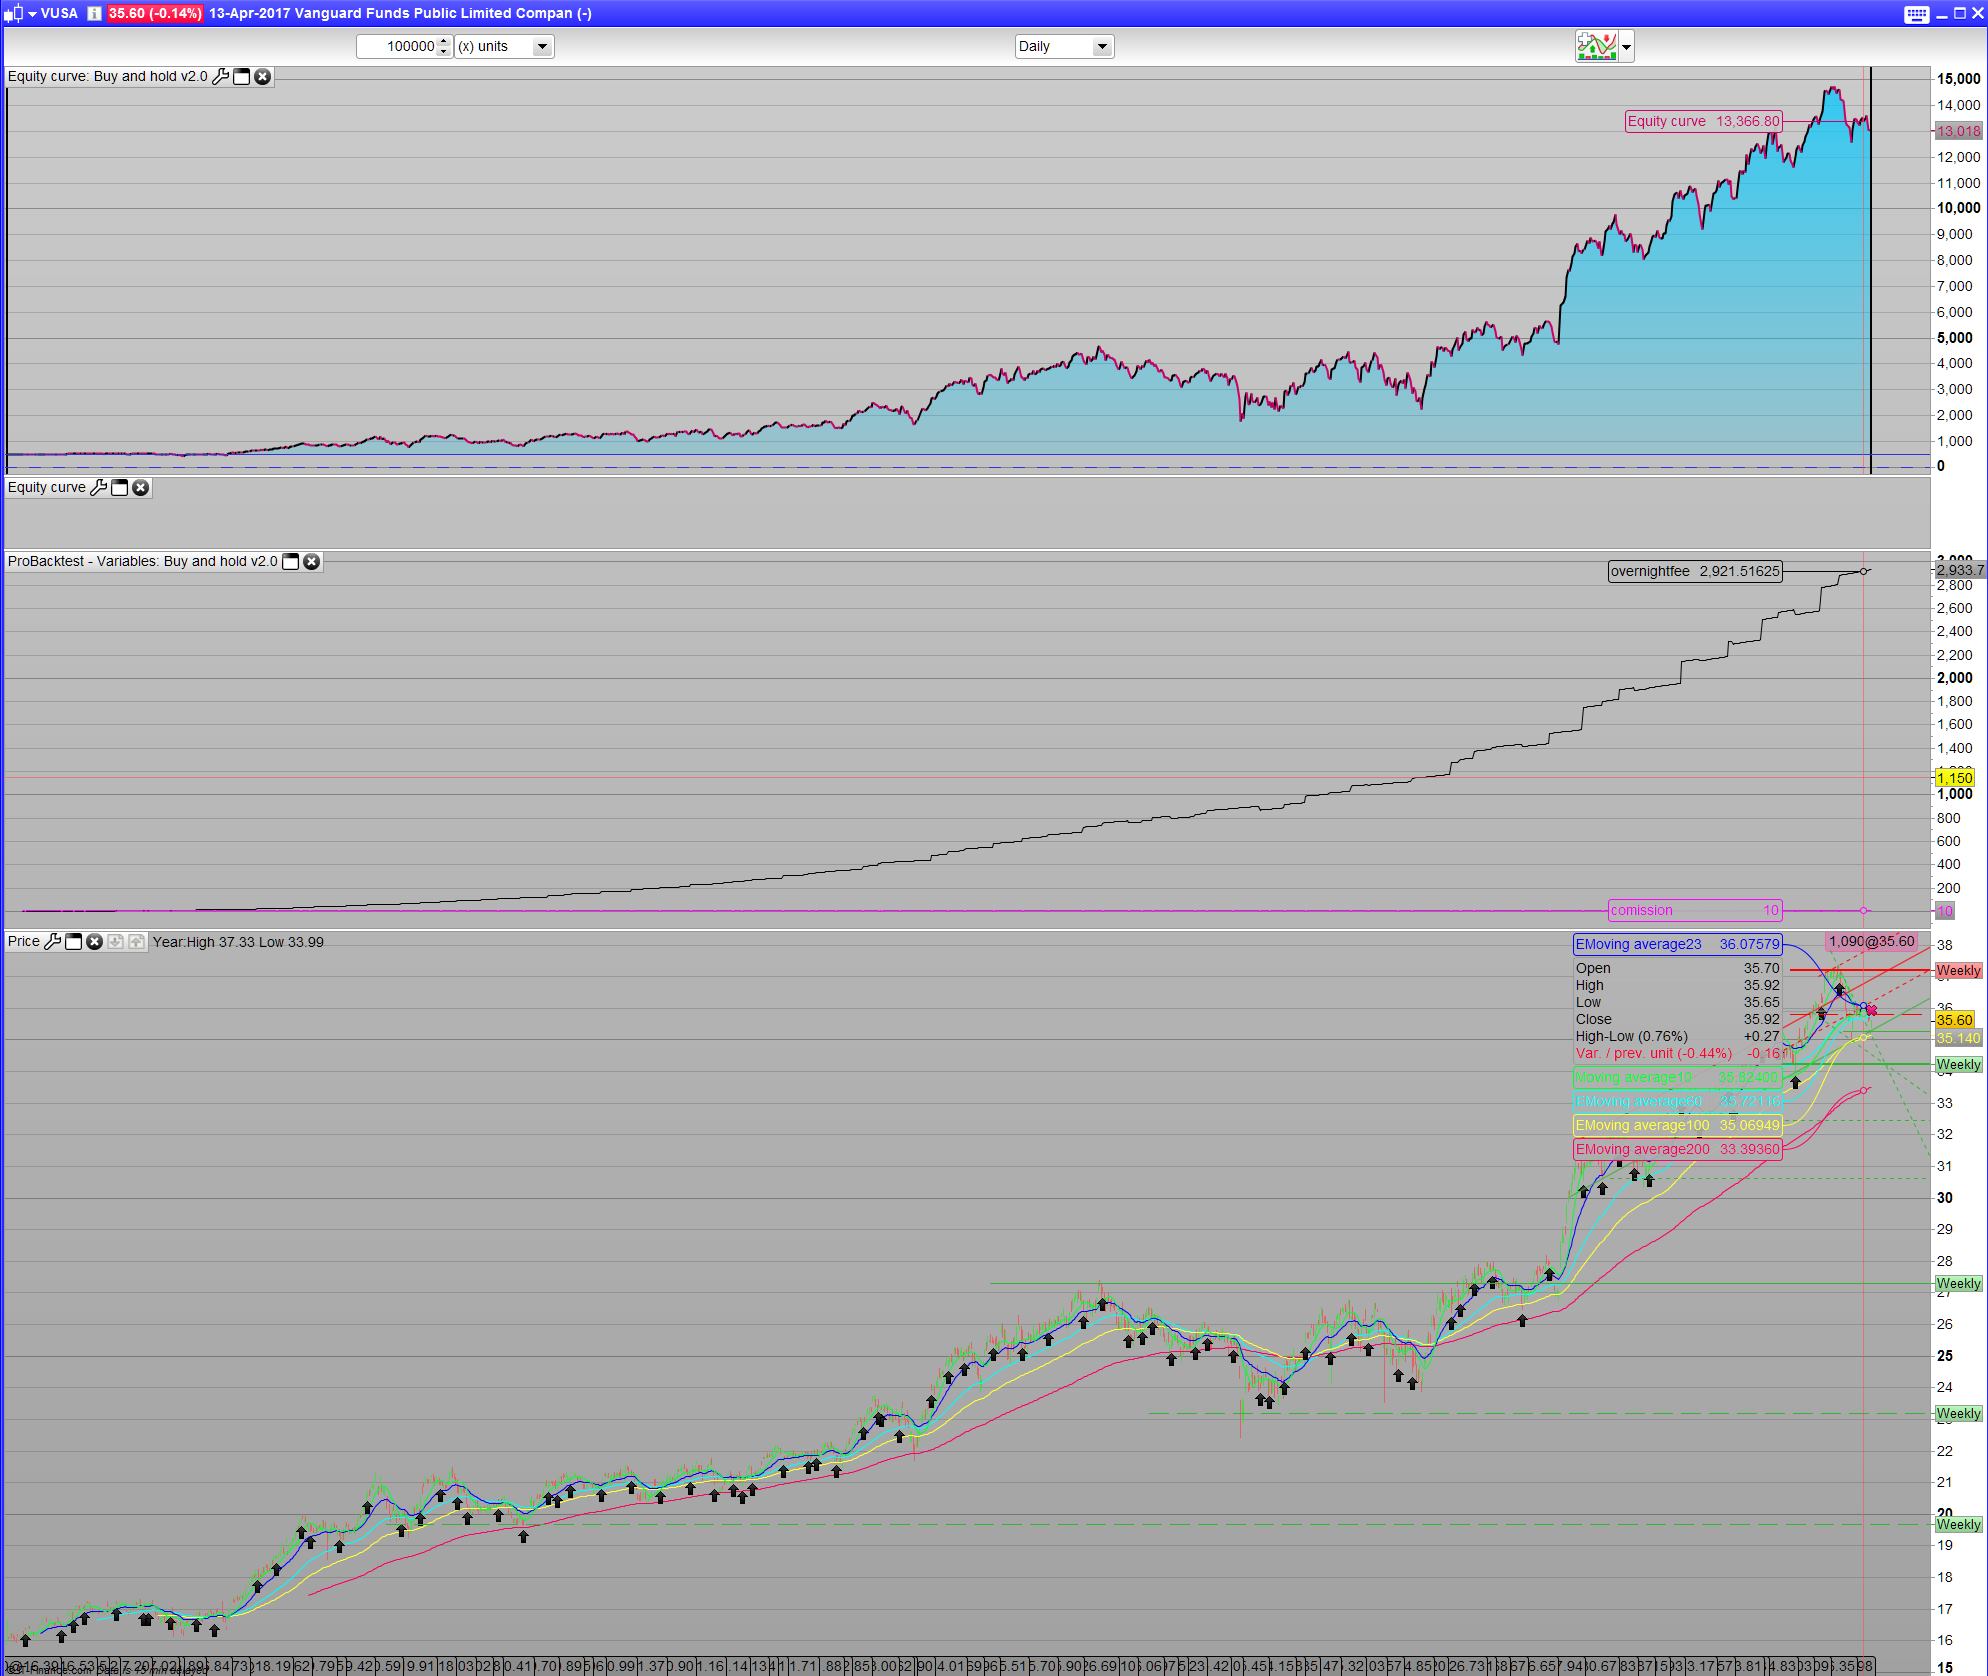
It took a couple of tries and emails from IG’s part to finally come up with the formular for my chosen Instrument- the Vanguard Funds Public Limited Companey – Vanguard S&P 500 UCITS ETF. For a positionsize of 5 it would yield (5 x 35.6425 x (2.5% + 0.25%))/365. This would give a total of £.0.0134 per evening. I rewrote the formula to overnightfee=(positionsize x tradeprice x 0.0275)/365. Comission is a ballance. The commission pr trade, charge is 0.10% of total tradeprice or $10, whichever is higher- so the code takes care of this, but around 290 positions is the ballance. It also dependant on the current price. However more or less 600 position buy a month is rather costly. We could take trades 4 time a year, so comission becomes insignicant. But for large account that can afford these trades it’s left as 2 trades a month. We will see that the comission is almost not important anyway. I make a total of 10 x 2 positions a month which is 20 euro a month in commision. In the end it’s a matter of choice of how much you spend to make money vs. How much you can afford save each month
The Graph code for checking the overnight fee, comission, is
//===================================================================================================================================== //=============================================================GRAPH SECTION========================================================== //===================================================================================================================================== //========================================== rem out all lines from GRAPH SECTION to live trade the code===================================== //once tradepricetest=1 //ONCE BrokerProfit=0 once countofdays=0 once AccumulatedTradeCost=tradeprice*mypos //Comission from IG- given: the commission charge is 0.10% of total tradeprice or $10, whichever is higher comissiontest=0.001*tradeprice*positionsize IF OnMarketBarCount[1]<OnMarketBarCount then AccumulatedTradeCost=AccumulatedTradeCost if tradepricetest then AccumulatedTradeCost=AccumulatedTradeCost+tradeprice*mypos tradepricetest=0 endif if comissiontest<10 then comission=10 endif elsif OnMarketBarCount[1]>OnMarketBarCount then tradepricetest=1 comission=comissiontest endif //Capital = 500 // initial capital of account // //equity = Capital + StrategyProfit //overnight fee from IG- given: (5 x 35.6425 x (2.5% + 0.25%))/365. This would give a total of £.0.0134 per evening. interestrate=0.025//2.5% adminfee=0.0025//0.25% overnightfee = (countofposition*tradeprice*(interestrate+adminfee))/365*countofdays //0.8 //broker overnight fee of a position (in money) // ---equity = Capital + StrategyProfit //DayChart=1 //can be set to bar qu if not onmarket then countofdays=0 elsif onmarket and DayOfWeek[1]<DayOfWeek then// = DayChart then countofdays=countofdays+1 else countofdays=countofdays endif //floatingprofit = ((((close-positionprice)*pointvalue)*countofposition)/pipsize)-(overnightfee+comission)//+(overnightfee+comission) //actual trade gains //Brokerprofit=((((close-positionprice)*pointvalue)*countofposition)/pipsize)-Floatingprofit //BrokerProfitinProcent=(((floatingprofit-Brokerprofit)/floatingprofit)-1)*100 //TrueEquity=AccumulatedTradeCost+floatingprofit+capital //TrueProfitInProcent=((TrueEquity/AccumulatedTradeCost)-1)*100 //graph conditionMonthlyHigh COLOURED(0,0,255) AS "conditionMonthlyHigh" //graph ConditionWeekleyHigh COLOURED(0,255,0) AS "ConditionWeekleyHigh" //graph TrueEquity COLOURED(0,0,255) AS "trueEquity" //graph BrokerProfit COLOURED(255,0,0) AS "BrokerProfit" //graph countofdays COLOURED(0,0,0) AS "countofdays" //graph entertrade COLOURED(255,255,0) AS "entertrade" //graph conditionWeeklyLow COLOURED(0,0,0) AS "conditionWeeklyLow" //graph conditionEMA COLOURED(255,0,0) AS "conditionEMA" //graph lastinperiod COLOURED(255,0,255) AS "lastinperiod" //graph conditionMonthlylow COLOURED(0,255,255) AS "conditionMonthlylow" //graph tradetime COLOURED(0,255,0) AS "tradetime" graph overnightfee COLOURED(0,0,0) AS "overnightfee" //graph floatingprofit+capital COLOURED(0,0,0) AS "floatingprofit" //graph BrokerProfit COLOURED(0,0,0) AS "BrokerProfit" //graph countofdays COLOURED(255,255,255) AS "countofdays" //graph OnMarketBarCount COLOURED(0,255,255) AS "OnMarketBarCount" //graph CountOfTrades COLOURED(255,255,255) AS "CountOfTrades" graph comission COLOURED(255,0,255) AS "comission" //graph AccumulatedTradeCost+capital COLOURED(0,255,0) AS "AccumulatedTradeCost" //graph tradeprice COLOURED(255,0,255) AS "tradeprice" //graph TrueProfitInProcent COLOURED(255,0,255) AS "TrueProfitInProcent" //graph BrokerProfit COLOURED(255,0,0) AS "BrokerProfit" //graph BrokerProfitinProcent COLOURED(255,255,0) AS "BrokerProfitinProcent" //graph marketchange COLOURED(255,0,0) AS "marketchange" //===================================================================================================================================== //=============================================================GRAPH SECTION END====================================================== //=====================================================================================================================================- Calculate the True equity that also takes your monthly payment in considerration.
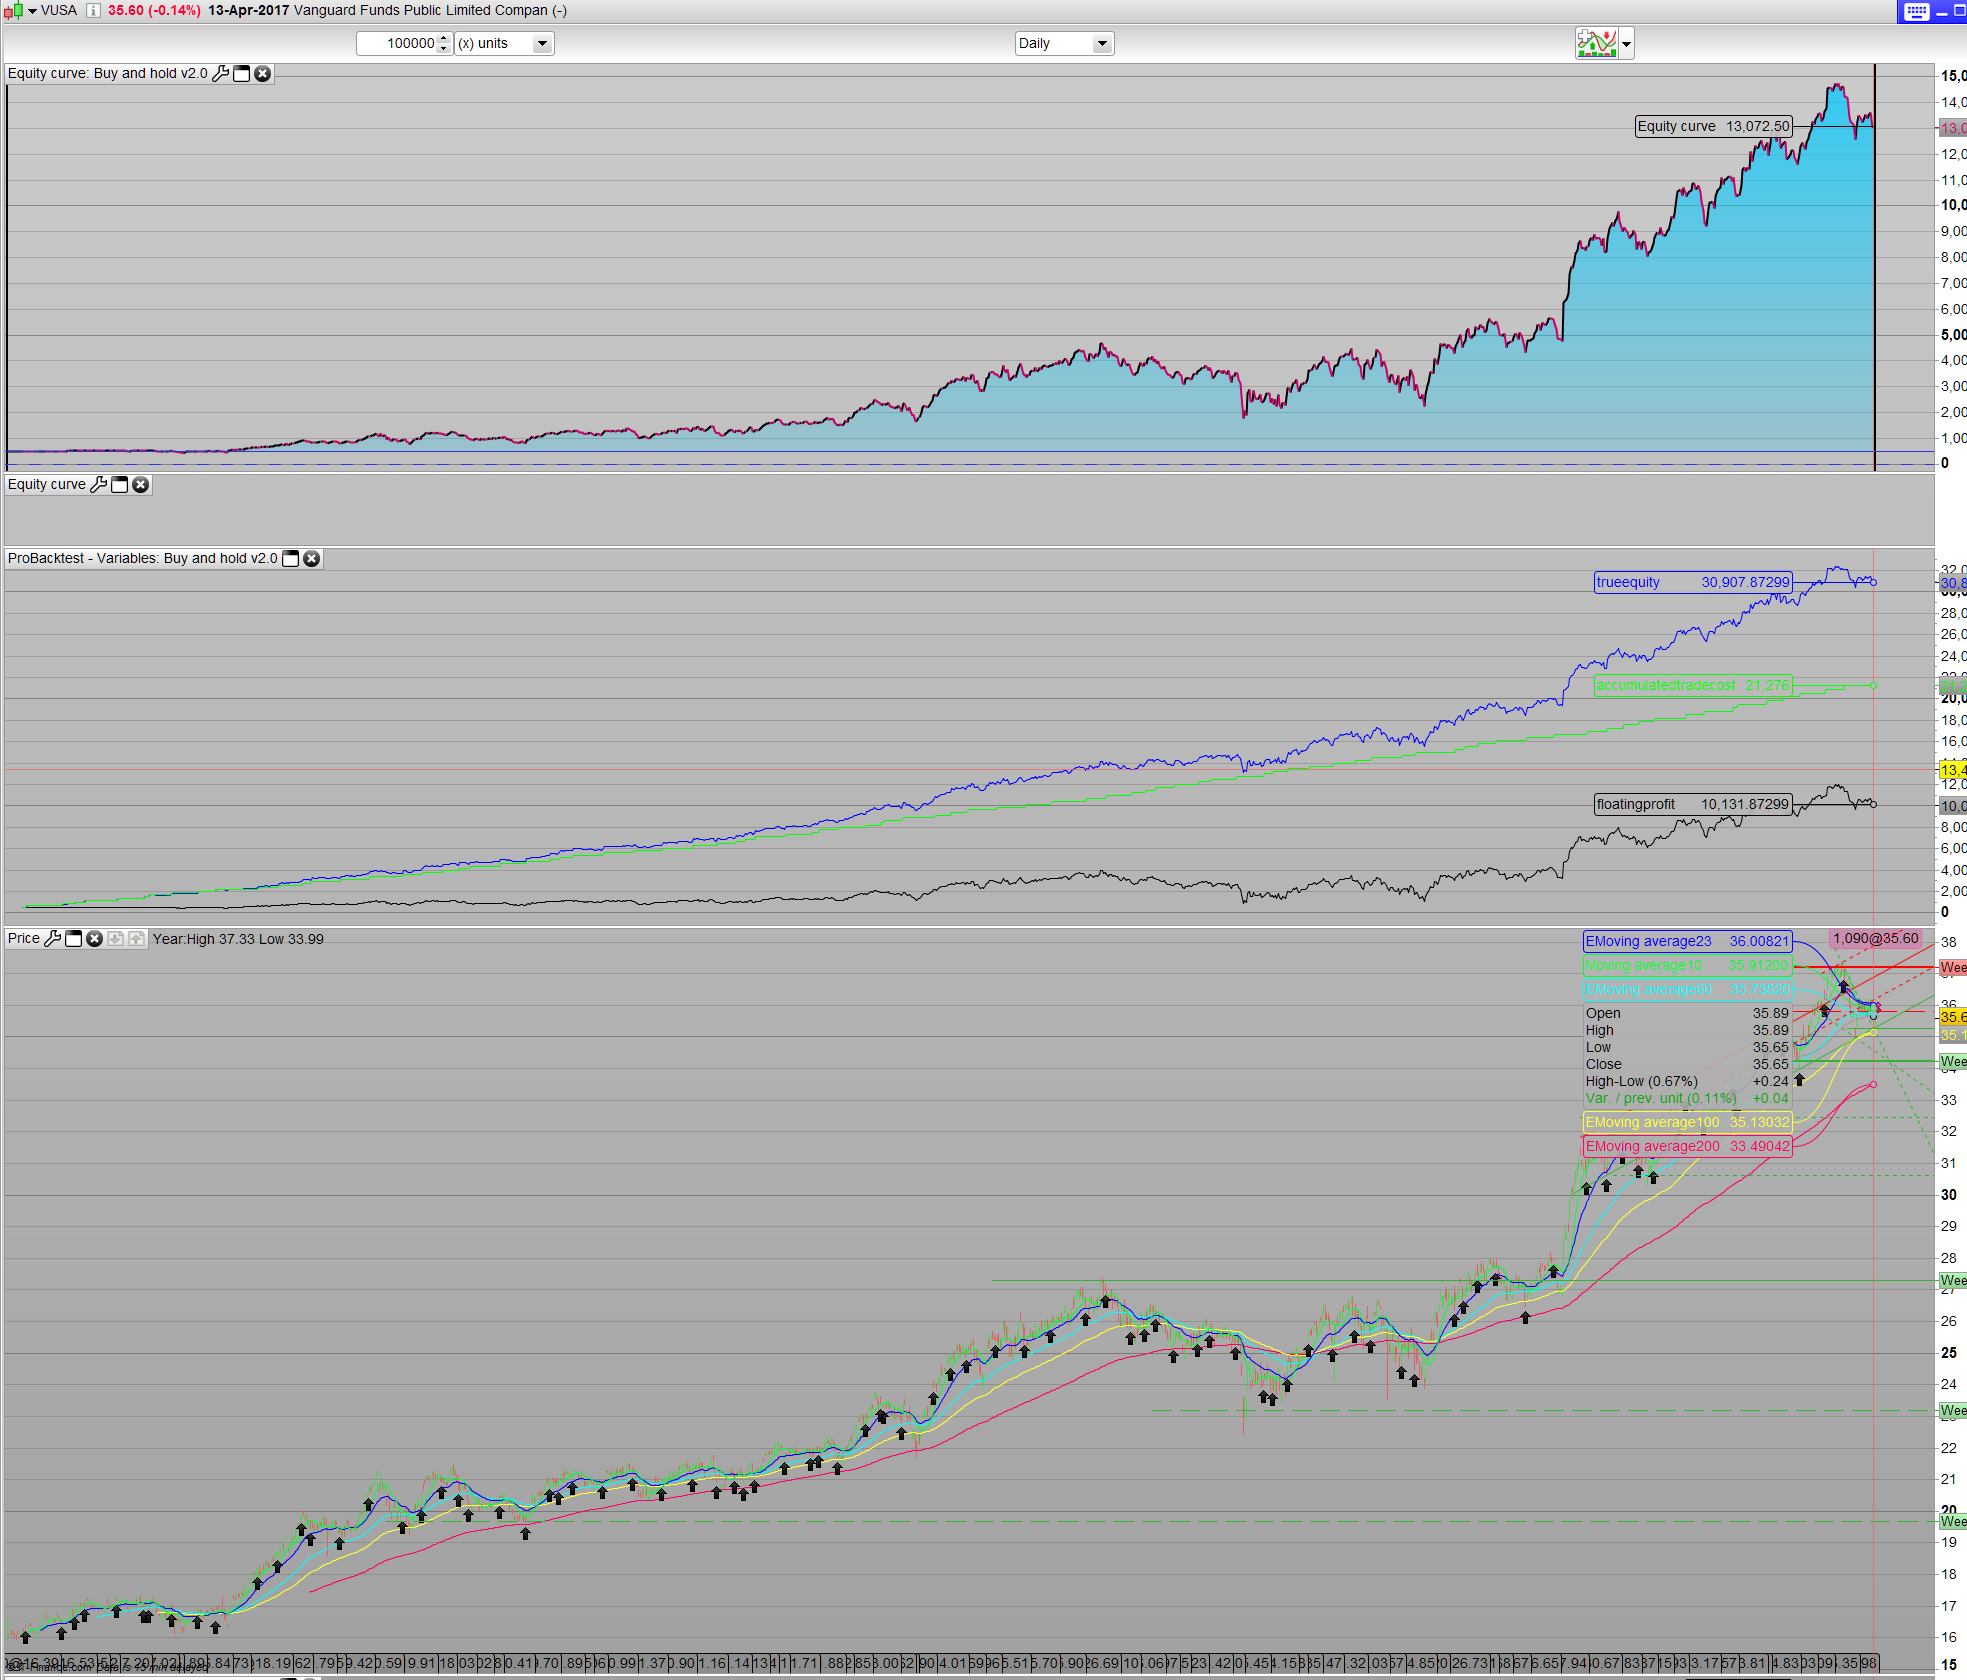
//===================================================================================================================================== //=============================================================GRAPH SECTION========================================================== //===================================================================================================================================== //========================================== rem out all lines from GRAPH SECTION to live trade the code===================================== //once tradepricetest=1 //ONCE BrokerProfit=0 once countofdays=0 once AccumulatedTradeCost=tradeprice*mypos //Comission from IG- given: the commission charge is 0.10% of total tradeprice or $10, whichever is higher comissiontest=0.001*tradeprice*positionsize IF OnMarketBarCount[1]<OnMarketBarCount then AccumulatedTradeCost=AccumulatedTradeCost if tradepricetest then AccumulatedTradeCost=AccumulatedTradeCost+tradeprice*mypos tradepricetest=0 endif if comissiontest<10 then comission=10 endif elsif OnMarketBarCount[1]>OnMarketBarCount then tradepricetest=1 comission=comissiontest endif Capital = 500 // initial capital of account // //equity = Capital + StrategyProfit //overnight fee from IG- given: (5 x 35.6425 x (2.5% + 0.25%))/365. This would give a total of £.0.0134 per evening. interestrate=0.025//2.5% adminfee=0.0025//0.25% overnightfee = (countofposition*tradeprice*(interestrate+adminfee))/365*countofdays //0.8 //broker overnight fee of a position (in money) // ---equity = Capital + StrategyProfit //DayChart=1 //can be set to bar qu // if not onmarket then countofdays=0 elsif onmarket and DayOfWeek[1]<DayOfWeek then// = DayChart then countofdays=countofdays+1 else countofdays=countofdays endif floatingprofit = ((((close-positionprice)*pointvalue)*countofposition)/pipsize)-(overnightfee+comission)//+(overnightfee+comission) //actual trade gains //Brokerprofit=((((close-positionprice)*pointvalue)*countofposition)/pipsize)-Floatingprofit //BrokerProfitinProcent=(((floatingprofit-Brokerprofit)/floatingprofit)-1)*100 TrueEquity=AccumulatedTradeCost+floatingprofit+capital //TrueProfitInProcent=((TrueEquity/AccumulatedTradeCost)-1)*100 //graph conditionMonthlyHigh COLOURED(0,0,255) AS "conditionMonthlyHigh" //graph ConditionWeekleyHigh COLOURED(0,255,0) AS "ConditionWeekleyHigh" graph TrueEquity COLOURED(0,0,255) AS "trueEquity" //graph BrokerProfit COLOURED(255,0,0) AS "BrokerProfit" //graph countofdays COLOURED(0,0,0) AS "countofdays" //graph entertrade COLOURED(255,255,0) AS "entertrade" //graph conditionWeeklyLow COLOURED(0,0,0) AS "conditionWeeklyLow" //graph conditionEMA COLOURED(255,0,0) AS "conditionEMA" //graph lastinperiod COLOURED(255,0,255) AS "lastinperiod" //graph conditionMonthlylow COLOURED(0,255,255) AS "conditionMonthlylow" //graph tradetime COLOURED(0,255,0) AS "tradetime" //graph overnightfee COLOURED(0,0,0) AS "overnightfee" graph floatingprofit+capital COLOURED(0,0,0) AS "floatingprofit" //graph BrokerProfit COLOURED(0,0,0) AS "BrokerProfit" //graph countofdays COLOURED(255,255,255) AS "countofdays" //graph OnMarketBarCount COLOURED(0,255,255) AS "OnMarketBarCount" //graph CountOfTrades COLOURED(255,255,255) AS "CountOfTrades" //graph comission COLOURED(255,0,255) AS "comission" graph AccumulatedTradeCost+capital COLOURED(0,255,0) AS "AccumulatedTradeCost" //graph tradeprice COLOURED(255,0,255) AS "tradeprice" //graph TrueProfitInProcent COLOURED(255,0,255) AS "TrueProfitInProcent" //graph BrokerProfit COLOURED(255,0,0) AS "BrokerProfit" //graph BrokerProfitinProcent COLOURED(255,255,0) AS "BrokerProfitinProcent" //graph marketchange COLOURED(255,0,0) AS "marketchange" //===================================================================================================================================== //=============================================================GRAPH SECTION END====================================================== //=====================================================================================================================================- Calculate the correct earnings in %
//===================================================================================================================================== //=============================================================GRAPH SECTION========================================================== //===================================================================================================================================== //========================================== rem out all lines from GRAPH SECTION to live trade the code===================================== //once tradepricetest=1 //ONCE BrokerProfit=0 once countofdays=0 once AccumulatedTradeCost=tradeprice*mypos //Comission from IG- given: the commission charge is 0.10% of total tradeprice or $10, whichever is higher comissiontest=0.001*tradeprice*positionsize IF OnMarketBarCount[1]<OnMarketBarCount then AccumulatedTradeCost=AccumulatedTradeCost if tradepricetest then AccumulatedTradeCost=AccumulatedTradeCost+tradeprice*mypos tradepricetest=0 endif if comissiontest<10 then comission=10 endif elsif OnMarketBarCount[1]>OnMarketBarCount then tradepricetest=1 comission=comissiontest endif Capital = 500 // initial capital of account // //equity = Capital + StrategyProfit //overnight fee from IG- given: (5 x 35.6425 x (2.5% + 0.25%))/365. This would give a total of £.0.0134 per evening. interestrate=0.025//2.5% adminfee=0.0025//0.25% overnightfee = (countofposition*tradeprice*(interestrate+adminfee))/365*countofdays //0.8 //broker overnight fee of a position (in money) // ---equity = Capital + StrategyProfit //DayChart=1 //can be set to bar qu // if not onmarket then countofdays=0 elsif onmarket and DayOfWeek[1]<DayOfWeek then// = DayChart then countofdays=countofdays+1 else countofdays=countofdays endif floatingprofit = ((((close-positionprice)*pointvalue)*countofposition)/pipsize)-(overnightfee+comission)//+(overnightfee+comission) //actual trade gains //Brokerprofit=((((close-positionprice)*pointvalue)*countofposition)/pipsize)-Floatingprofit //BrokerProfitinProcent=(((floatingprofit-Brokerprofit)/floatingprofit)-1)*100 TrueEquity=AccumulatedTradeCost+floatingprofit+capital TrueProfitInProcent=((TrueEquity/AccumulatedTradeCost)-1)*100 //graph conditionMonthlyHigh COLOURED(0,0,255) AS "conditionMonthlyHigh" //graph ConditionWeekleyHigh COLOURED(0,255,0) AS "ConditionWeekleyHigh" //graph TrueEquity COLOURED(0,0,255) AS "trueEquity" //graph BrokerProfit COLOURED(255,0,0) AS "BrokerProfit" //graph countofdays COLOURED(0,0,0) AS "countofdays" //graph entertrade COLOURED(255,255,0) AS "entertrade" //graph conditionWeeklyLow COLOURED(0,0,0) AS "conditionWeeklyLow" //graph conditionEMA COLOURED(255,0,0) AS "conditionEMA" //graph lastinperiod COLOURED(255,0,255) AS "lastinperiod" //graph conditionMonthlylow COLOURED(0,255,255) AS "conditionMonthlylow" //graph tradetime COLOURED(0,255,0) AS "tradetime" //graph overnightfee COLOURED(0,0,0) AS "overnightfee" //graph floatingprofit+capital COLOURED(0,0,0) AS "floatingprofit" //graph BrokerProfit COLOURED(0,0,0) AS "BrokerProfit" //graph countofdays COLOURED(255,255,255) AS "countofdays" //graph OnMarketBarCount COLOURED(0,255,255) AS "OnMarketBarCount" //graph CountOfTrades COLOURED(255,255,255) AS "CountOfTrades" //graph comission COLOURED(255,0,255) AS "comission" //graph AccumulatedTradeCost+capital COLOURED(0,255,0) AS "AccumulatedTradeCost" //graph tradeprice COLOURED(255,0,255) AS "tradeprice" graph TrueProfitInProcent COLOURED(255,0,255) AS "TrueProfitInProcent" //graph BrokerProfit COLOURED(255,0,0) AS "BrokerProfit" //graph BrokerProfitinProcent COLOURED(255,255,0) AS "BrokerProfitinProcent" //graph marketchange COLOURED(255,0,0) AS "marketchange" //===================================================================================================================================== //=============================================================GRAPH SECTION END====================================================== //=====================================================================================================================================- Risk profile
//===================================================================================================================================== //=============================================================GRAPH SECTION========================================================== //===================================================================================================================================== //========================================== rem out all lines from GRAPH SECTION to live trade the code===================================== //once tradepricetest=1 //ONCE BrokerProfit=0 //once countofdays=0 //once AccumulatedTradeCost=tradeprice*mypos //Comission from IG- given: the commission charge is 0.10% of total tradeprice or $10, whichever is higher //comissiontest=0.001*tradeprice*positionsize //IF OnMarketBarCount[1]<OnMarketBarCount then //AccumulatedTradeCost=AccumulatedTradeCost //if tradepricetest then //AccumulatedTradeCost=AccumulatedTradeCost+tradeprice*mypos //tradepricetest=0 //endif //if comissiontest<10 then //comission=10 //endif //elsif OnMarketBarCount[1]>OnMarketBarCount then //tradepricetest=1 //comission=comissiontest //endif //Capital = 500 // initial capital of account // //equity = Capital + StrategyProfit //overnight fee from IG- given: (5 x 35.6425 x (2.5% + 0.25%))/365. This would give a total of £.0.0134 per evening. //interestrate=0.025//2.5% //adminfee=0.0025//0.25% //overnightfee = (countofposition*tradeprice*(interestrate+adminfee))/365*countofdays //0.8 //broker overnight fee of a position (in money) // ---equity = Capital + StrategyProfit //DayChart=1 //can be set to bar qu // //if not onmarket then //countofdays=0 //elsif onmarket and DayOfWeek[1]<DayOfWeek then// = DayChart then //countofdays=countofdays+1 //else //countofdays=countofdays //endif //floatingprofit = ((((close-positionprice)*pointvalue)*countofposition)/pipsize)-(overnightfee+comission)//+(overnightfee+comission) //actual trade gains //Brokerprofit=((((close-positionprice)*pointvalue)*countofposition)/pipsize)-Floatingprofit //BrokerProfitinProcent=(((floatingprofit-Brokerprofit)/floatingprofit)-1)*100 //TrueEquity=AccumulatedTradeCost+floatingprofit+capital //TrueProfitInProcent=((TrueEquity/AccumulatedTradeCost)-1)*100 //graph conditionMonthlyHigh COLOURED(0,0,255) AS "conditionMonthlyHigh" //graph ConditionWeekleyHigh COLOURED(0,255,0) AS "ConditionWeekleyHigh" //graph TrueEquity COLOURED(0,0,255) AS "trueEquity" //graph BrokerProfit COLOURED(255,0,0) AS "BrokerProfit" //graph countofdays COLOURED(0,0,0) AS "countofdays" //graph entertrade COLOURED(255,255,0) AS "entertrade" //graph conditionWeeklyLow COLOURED(0,0,0) AS "conditionWeeklyLow" //graph conditionEMA COLOURED(255,0,0) AS "conditionEMA" //graph lastinperiod COLOURED(255,0,255) AS "lastinperiod" //graph conditionMonthlylow COLOURED(0,255,255) AS "conditionMonthlylow" //graph tradetime COLOURED(0,255,0) AS "tradetime" //graph overnightfee COLOURED(0,0,0) AS "overnightfee" //graph floatingprofit+capital COLOURED(0,0,0) AS "floatingprofit" //graph BrokerProfit COLOURED(0,0,0) AS "BrokerProfit" //graph countofdays COLOURED(255,255,255) AS "countofdays" //graph OnMarketBarCount COLOURED(0,255,255) AS "OnMarketBarCount" //graph CountOfTrades COLOURED(255,255,255) AS "CountOfTrades" //graph comission COLOURED(255,0,255) AS "comission" //graph AccumulatedTradeCost+capital COLOURED(0,255,0) AS "AccumulatedTradeCost" //graph tradeprice COLOURED(255,0,255) AS "tradeprice" //graph TrueProfitInProcent COLOURED(255,0,255) AS "TrueProfitInProcent" //graph BrokerProfit COLOURED(255,0,0) AS "BrokerProfit" //graph BrokerProfitinProcent COLOURED(255,255,0) AS "BrokerProfitinProcent" graph marketchange COLOURED(255,0,0) AS "marketchange" //===================================================================================================================================== //=============================================================GRAPH SECTION END====================================================== //=====================================================================================================================================- Other considerations
- Broker cost in total
		//=====================================================================================================================================
		//=============================================================GRAPH SECTION==========================================================
		//=====================================================================================================================================
		//========================================== rem out all lines from GRAPH SECTION to live trade the code=====================================
		//once tradepricetest=1
		ONCE BrokerProfit=0
		once countofdays=0
		once AccumulatedTradeCost=tradeprice*mypos

		//Comission from IG- given: the commission charge is 0.10% of total tradeprice or $10, whichever is higher

		comissiontest=0.001*tradeprice*positionsize
		IF OnMarketBarCount[1]<OnMarketBarCount then
		AccumulatedTradeCost=AccumulatedTradeCost
		if tradepricetest then
		AccumulatedTradeCost=AccumulatedTradeCost+tradeprice*mypos
		tradepricetest=0
		endif
		if comissiontest<10 then
		comission=10
		endif
		elsif OnMarketBarCount[1]>OnMarketBarCount then
		tradepricetest=1
		comission=comissiontest
		endif


		Capital = 500 // initial capital of account
		//
		//equity = Capital + StrategyProfit

		//overnight fee from IG- given: (5 x 35.6425 x (2.5% + 0.25%))/365. This would give a total of £.0.0134 per evening.
		interestrate=0.025//2.5%
		adminfee=0.0025//0.25%
		overnightfee = (countofposition*tradeprice*(interestrate+adminfee))/365*countofdays //0.8 //broker overnight fee of a position (in money)
		// ---equity = Capital + StrategyProfit

		//DayChart=1 //can be set to bar qu
		//
		if  not onmarket then
		countofdays=0
		elsif onmarket and DayOfWeek[1]<DayOfWeek then// = DayChart then
		countofdays=countofdays+1
		else
		countofdays=countofdays
		endif

		floatingprofit = ((((close-positionprice)*pointvalue)*countofposition)/pipsize)-(overnightfee+comission)//+(overnightfee+comission) //actual trade gains
		Brokerprofit=((((close-positionprice)*pointvalue)*countofposition)/pipsize)-Floatingprofit
		BrokerProfitinProcent=(((floatingprofit-Brokerprofit)/floatingprofit)-1)*100
		TrueEquity=AccumulatedTradeCost+floatingprofit+capital
		TrueProfitInProcent=((TrueEquity/AccumulatedTradeCost)-1)*100

		//graph conditionMonthlyHigh COLOURED(0,0,255) AS "conditionMonthlyHigh"
		//graph ConditionWeekleyHigh COLOURED(0,255,0) AS "ConditionWeekleyHigh"
		graph TrueEquity COLOURED(0,0,255) AS "trueEquity"

		//graph BrokerProfit COLOURED(255,0,0) AS "BrokerProfit"
		//graph countofdays COLOURED(0,0,0) AS "countofdays"
		//graph entertrade COLOURED(255,255,0) AS "entertrade"
		//graph conditionWeeklyLow COLOURED(0,0,0) AS "conditionWeeklyLow"
		//graph conditionEMA COLOURED(255,0,0) AS "conditionEMA"
		//graph lastinperiod COLOURED(255,0,255) AS "lastinperiod"
		//graph conditionMonthlylow COLOURED(0,255,255) AS "conditionMonthlylow"
		//graph tradetime  COLOURED(0,255,0) AS "tradetime"
		//graph overnightfee COLOURED(0,0,0) AS "overnightfee"
		graph floatingprofit+capital COLOURED(0,0,0) AS "floatingprofit"
		//graph BrokerProfit COLOURED(0,0,0) AS "BrokerProfit"
		//graph countofdays COLOURED(255,255,255) AS "countofdays"
		//graph OnMarketBarCount COLOURED(0,255,255) AS "OnMarketBarCount"
		//graph CountOfTrades COLOURED(255,255,255) AS "CountOfTrades"
		//graph comission COLOURED(255,0,255) AS "comission"
		//graph AccumulatedTradeCost+capital COLOURED(0,255,0) AS "AccumulatedTradeCost"
		//graph tradeprice COLOURED(255,0,255) AS "tradeprice"
		graph TrueProfitInProcent COLOURED(255,0,255) AS "TrueProfitInProcent"
		graph BrokerProfit COLOURED(255,0,0) AS "BrokerProfit"
		graph BrokerProfitinProcent COLOURED(255,255,0) AS "BrokerProfitinProcent"
		//graph marketchange COLOURED(255,0,0) AS "marketchange"


		//=====================================================================================================================================
		//=============================================================GRAPH SECTION END======================================================
		//=====================================================================================================================================
GraHal thanked this postKasper, thank you for your effort to add more substantial strategies to this site. Especially the fact that you invested a lot of time to calculate all the cost factors of a buy and hold strategy is very valuable to this community in my opinion. Considering your request for feedback: Can you compare the results to a single investment at the beginning of every year? The amount invested will of course be bigger. My previous calculations have shown that this is usually more profitable than the regular investment. Can you check the performance in the 2008-2009 bear market? I treat this as a test for any long term system to be bulletproof. Looking forward to your reply. Edit: removed the request for a test of the japanese bear market.Wow, many thanks Kasper! I’ve read your first few posts above … all good stuff and well written … but I need coffee now 🙂 I like good things in small bites (ooeerr! 🙂 so I’ll come back later for more. GraHalHi Derek and Grahal. thanks for you feedback. @Grahal Coffee is good 🙂 @Derek. The VUSA ETF has not been around for that long, how ever I think it follows the S&P 500 index more or less. If we take a look at the 2008/2009 it took a dive of 50% within a year. after 25% the code would have stopped, and listing to the news you would have known about the rescission period. I remember specifically making my absolute worse investment ever on a Thursday. Monday it was all over the news that we were now facing a global financial crises. Knowing what I know today I think I would have sold on that Monday- but no.. I made the very common mistake of being hopeful. it went down from a price at 145- I sold on 25 years later. I actually already found an error in my calculations. let see if you can spot it 🙂 also there could be more, so it would be a good joint venture to do it like this. So to understand you correct. you want to make one trade a year, and not 2 times a month, and compare the results? Cheers KasperYes, as you already expected in one of your posts, fewer investments with larger amounts may turn out to be more profitable. So, instead of recoding the whole time of investment part of the code, this page may come in handy: https://ycharts.com/indicators/sandp_500_total_return_annual Maybe this can be done faster with Excel than recoding the trade-timing function.Impressive work, and a dose of realism for us all.Elsborgtrading thanked this post@Derek thanks for the info. It’s usefull when trying to pick a market to invest in. The point I was tryimg to make here though, was the cost for a trade. And how it would impact your equity. The error I discoverd was that I didn’t accumulate the comission in the code. I only decuct one comisson. It dosn’t make things better only worse. So both the overnight fee and comission plays a significant role on your gain. Later I will try and document this. Cheers Kasper@Casper: Exactly. I suggest the following solution to the commission and interest rate problem.- Since your goal is to follow a major index it is easy to simply follow the market directly via a CFD.
- By definition there are no interest payments for futures and forward CFDs are instruments based on the real underlying futures contracts.
- Forward CFDs do not charge extra commissions
- For indexes like the S&P 500 the current farthest contract is the June contract. The contract was first offered in January, so there are about 6 months without interest payments. The spread is acceptably low with 1 point. The drawback is that the rollover into the december contract has to be done manually when the june contract is ending.
- The counterparty risk is rising since we are now trusting the CFD broker for the long term to pay back the investment several years into the future. So, it is advisable to keep the account size below the threshold that is protected in case of default.
@Derek Well my goal was to make a long term investment, and at the same time when reading about it, I became aware of how much the broker cost was an issue. They also suggested the ETF S&P 500 so naturally I’d started there. I will look into the Future S&P 500 because if I understand you correctly there is no overnight fee- only 1 point spread. Never the less I’d still like to show my findings here- I think it proves a point. for all the GRAPH’s section I posted line 20 and 24 need to be added the variable “countoftrades” It will look like this. At the same time we can now see that the commission is accumulating. also the Broker profit raised to 43.5% and your own profit fell to 44.8%. So basically the broker profit takes around half your profit… Just saying!//===================================================================================================================================== //=============================================================GRAPH SECTION========================================================== //===================================================================================================================================== //========================================== rem out all lines from GRAPH SECTION to live trade the code===================================== //once tradepricetest=1 ONCE BrokerProfit=0 once countofdays=0 once AccumulatedTradeCost=tradeprice*mypos //Comission from IG- given: the commission charge is 0.10% of total tradeprice or $10, whichever is higher comissiontest=0.001*tradeprice*positionsize IF OnMarketBarCount[1]<OnMarketBarCount then AccumulatedTradeCost=AccumulatedTradeCost if tradepricetest then AccumulatedTradeCost=AccumulatedTradeCost+tradeprice*mypos tradepricetest=0 endif if comissiontest<10 then comission=10*countoftrades endif elsif OnMarketBarCount[1]>OnMarketBarCount then tradepricetest=1 comission=comissiontest*countoftrades endif Capital = 500 // initial capital of account // //equity = Capital + StrategyProfit //overnight fee from IG- given: (5 x 35.6425 x (2.5% + 0.25%))/365. This would give a total of £.0.0134 per evening. interestrate=0.025//2.5% adminfee=0.0025//0.25% overnightfee = (countofposition*tradeprice*(interestrate+adminfee))/365*countofdays //0.8 //broker overnight fee of a position (in money) // ---equity = Capital + StrategyProfit //DayChart=1 //can be set to bar qu // if not onmarket then countofdays=0 elsif onmarket and DayOfWeek[1]<DayOfWeek then// = DayChart then countofdays=countofdays+1 else countofdays=countofdays endif floatingprofit = ((((close-positionprice)*pointvalue)*countofposition)/pipsize)-(overnightfee+comission)//+(overnightfee+comission) //actual trade gains Brokerprofit=((((close-positionprice)*pointvalue)*countofposition)/pipsize)-Floatingprofit BrokerProfitinProcent=(((floatingprofit-Brokerprofit)/floatingprofit)-1)*100 TrueEquity=AccumulatedTradeCost+floatingprofit+capital TrueProfitInProcent=((TrueEquity/AccumulatedTradeCost)-1)*100 //graph conditionMonthlyHigh COLOURED(0,0,255) AS "conditionMonthlyHigh" //graph ConditionWeekleyHigh COLOURED(0,255,0) AS "ConditionWeekleyHigh" graph TrueEquity COLOURED(0,0,255) AS "trueEquity" //graph BrokerProfit COLOURED(255,0,0) AS "BrokerProfit" //graph countofdays COLOURED(0,0,0) AS "countofdays" //graph entertrade COLOURED(255,255,0) AS "entertrade" //graph conditionWeeklyLow COLOURED(0,0,0) AS "conditionWeeklyLow" //graph conditionEMA COLOURED(255,0,0) AS "conditionEMA" //graph lastinperiod COLOURED(255,0,255) AS "lastinperiod" //graph conditionMonthlylow COLOURED(0,255,255) AS "conditionMonthlylow" //graph tradetime COLOURED(0,255,0) AS "tradetime" //graph overnightfee COLOURED(0,0,0) AS "overnightfee" graph floatingprofit+capital COLOURED(0,0,0) AS "floatingprofit" //graph BrokerProfit COLOURED(0,0,0) AS "BrokerProfit" //graph countofdays COLOURED(255,255,255) AS "countofdays" //graph OnMarketBarCount COLOURED(0,255,255) AS "OnMarketBarCount" //graph CountOfTrades COLOURED(255,255,255) AS "CountOfTrades" //graph comission COLOURED(255,0,255) AS "comission" //graph AccumulatedTradeCost+capital COLOURED(0,255,0) AS "AccumulatedTradeCost" //graph tradeprice COLOURED(255,0,255) AS "tradeprice" graph TrueProfitInProcent COLOURED(255,0,255) AS "TrueProfitInProcent" graph BrokerProfit COLOURED(255,0,0) AS "BrokerProfit" graph BrokerProfitinProcent COLOURED(255,255,0) AS "BrokerProfitinProcent" //graph marketchange COLOURED(255,0,0) AS "marketchange" //===================================================================================================================================== //=============================================================GRAPH SECTION END====================================================== -
AuthorPosts
- You must be logged in to reply to this topic.
VUSA daily Buy and hold v2.0
ProOrder: Automated Strategies & Backtesting
Author
Summary
This topic contains 19 replies,
has 6 voices, and was last updated by ![]() Elsborgtrading
Elsborgtrading
8 years, 10 months ago.
Topic Details
| Forum: | ProOrder: Automated Strategies & Backtesting |
| Language: | English |
| Started: | 04/14/2017 |
| Status: | Active |
| Attachments: | 9 files |
About personal data collected
The information collected on this form is stored in a computer file by ProRealCode to create and access your ProRealCode profile. This data is kept in a secure database for the duration of the member's membership. They will be kept as long as you use our services and will be automatically deleted after 3 years of inactivity. Your personal data is used to create your private profile on ProRealCode. This data is maintained by SAS ProRealCode, 407 rue Freycinet, 59151 Arleux, France. If you subscribe to our newsletters, your email address is provided to our service provider "MailChimp" located in the United States, with whom we have signed a confidentiality agreement. This company is also compliant with the EU/Swiss Privacy Shield, and the GDPR. For any request for correction or deletion concerning your data, you can directly contact the ProRealCode team by email at privacy@prorealcode.com If you would like to lodge a complaint regarding the use of your personal data, you can contact your data protection supervisory authority.