This guy, who fakes being a ‘veteran’, can only be a veteran of circus arts…
A complete clown who dares to treat all his readers like idiots!
Hey, clown, are you using the exact same analysis period and the same timeframe?!
Take a look here, clown, and see if your eyes can quickly spot any evidence corroborated by all the platforms! Cut the crap… This isn’t a scientific community at all! It looks like a legion of fanatics blindly defending the mantra they’ve had implanted in their minds…
It’s not even worth wasting another second on a community of blind people…
Show me where ProRealTime gives you what you see here?! I had to spell it out for them…!!!
Bloody hell…!
 JS
JSParticipant
Veteran
It is now completely clear, what a huge difference…
This is all a veteran is able to tell us…
What a jerk knowledge on mind…!
God…
Do you want me to put the spoon in your mouth as well too? Do you want me to put the Cerelac in your mouth for you too?I
Make your homework, lazy mind…
Those screenshots simply demonstrate, with clear evidence, one of the glaring discrepancies. But if that isn’t enough to spark your interest in looking into the most serious details yourselves – those that actually and radically alter all the indicators in a significant way – then nothing (and don’t expect anyone else to do it for you…!) will ever get that information across to you!!! Don’t you call yourselves experts on the subject?! Look into it. That’s what I did because it’s my field…!I doubt any of you are capable of carrying out such an audit with methodological rigour… judging by your replies. It’s frightening to realise that people of such low intellectual calibre are entering the markets to trade…
Couldn’t resist, sorry! 😉
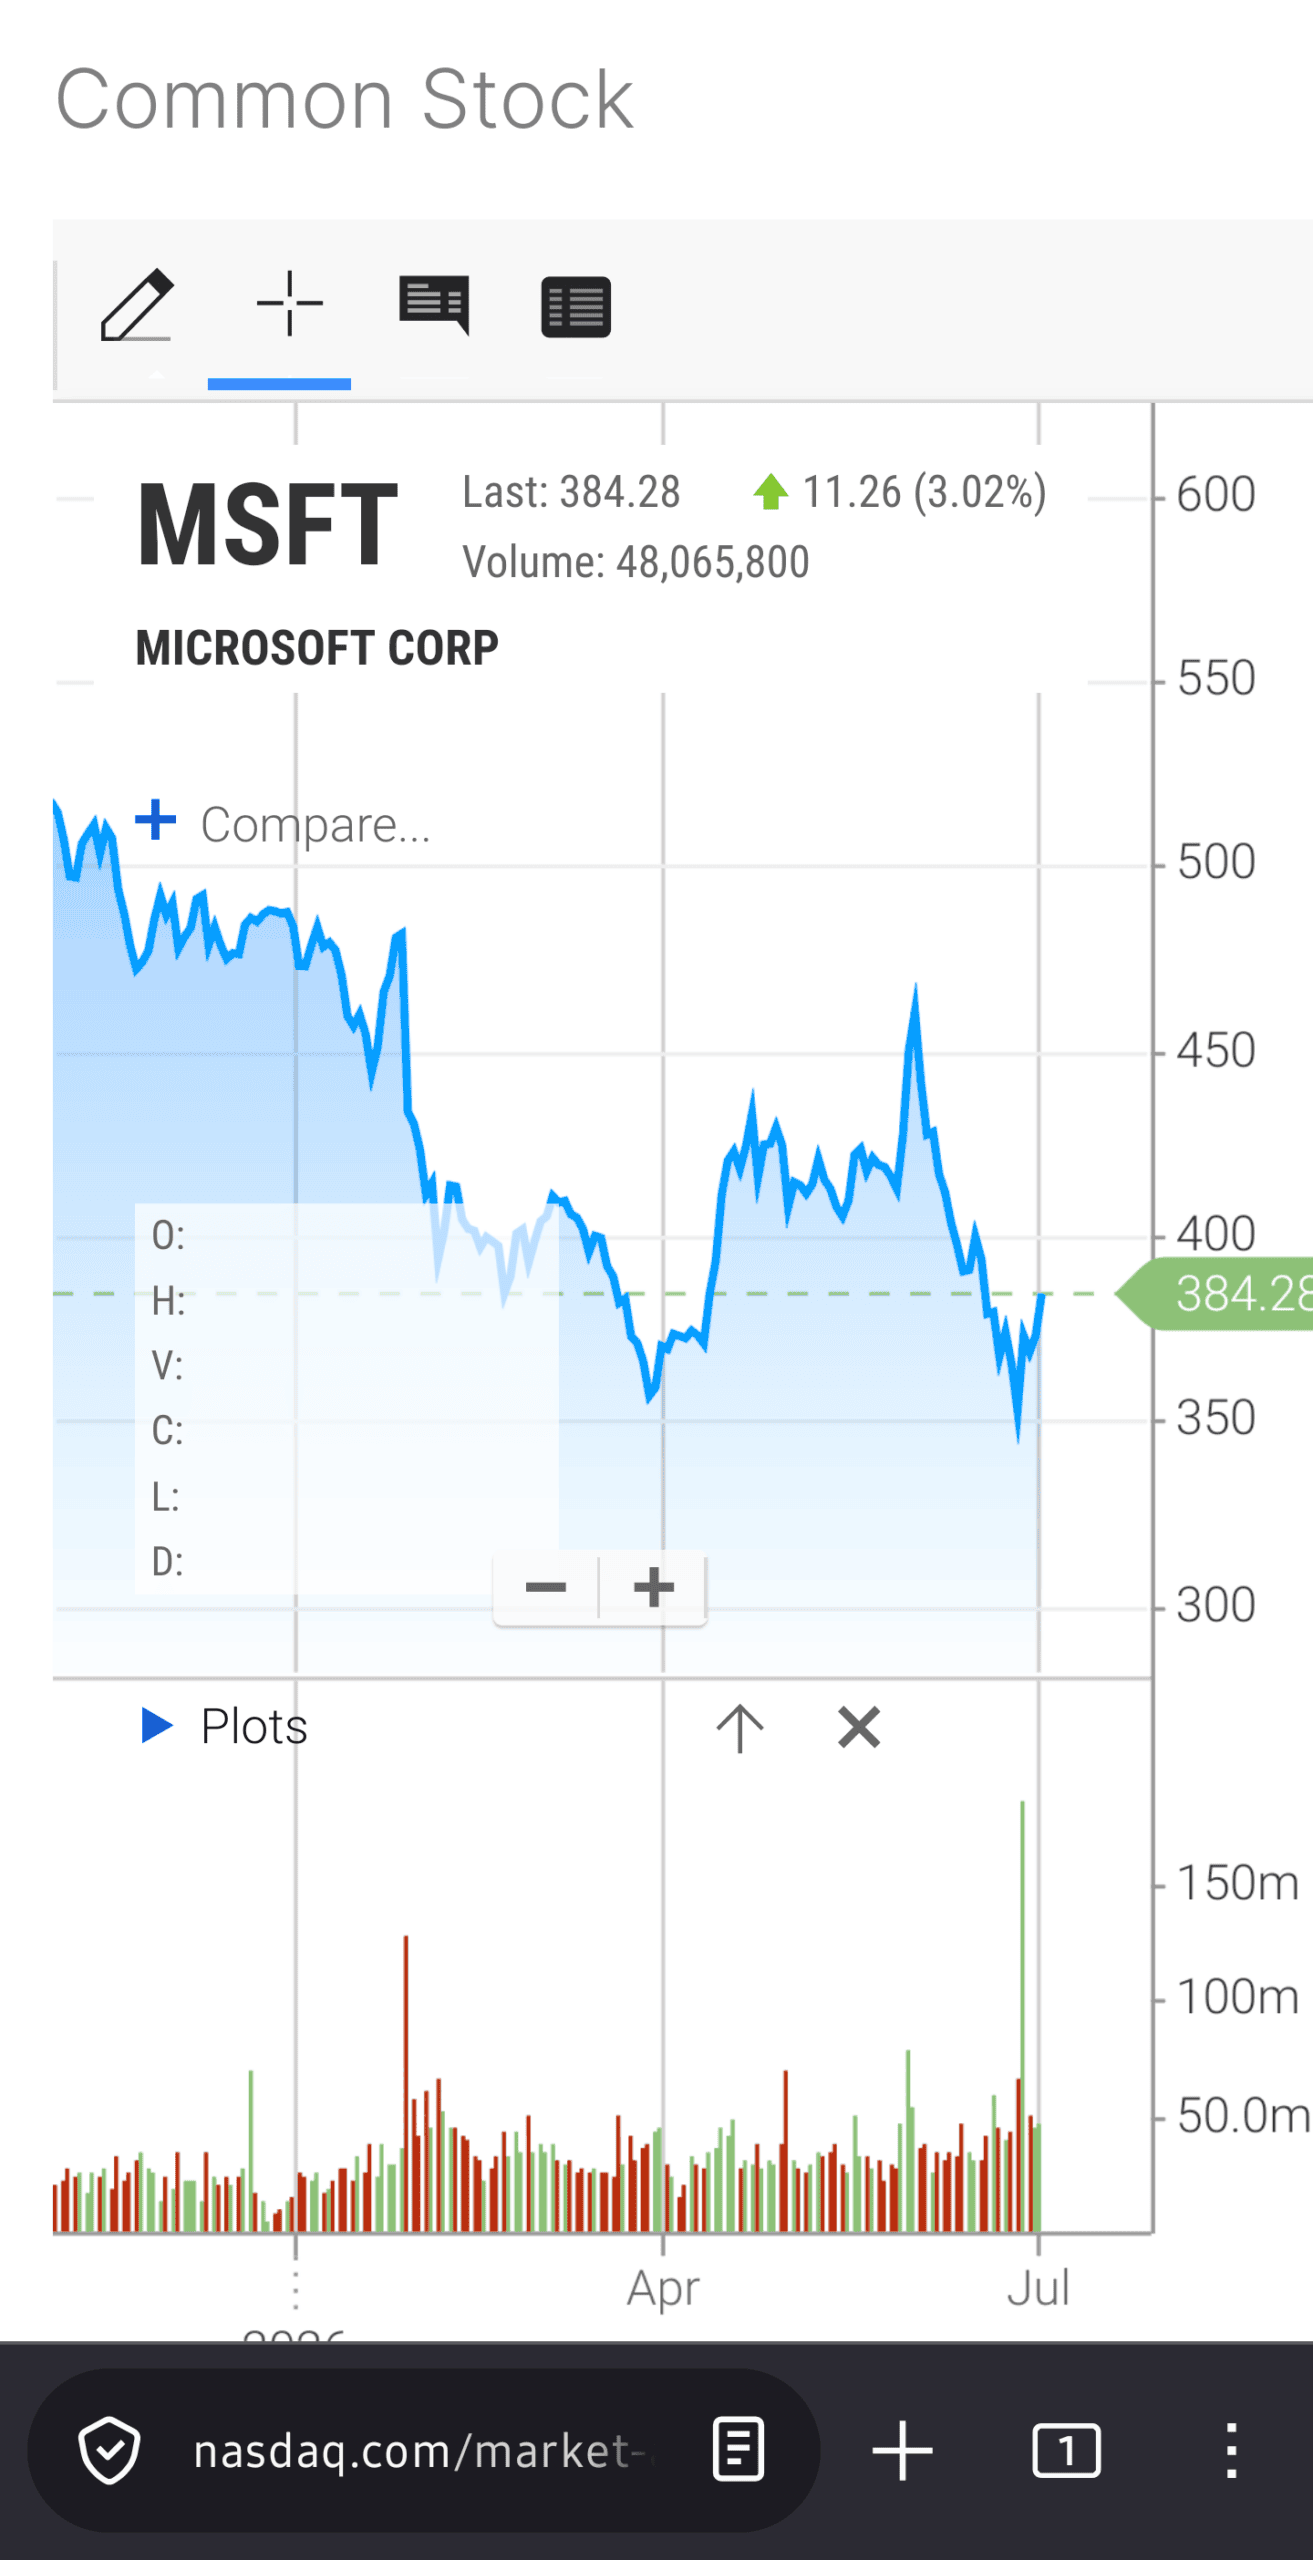
While all four screenshots display historical chart data for Microsoft Corp. (MSFT) ending at a closing price of 384.28, there is one massive, critical discrepancy in the OHLC (Open, High, Low, Close) data shown in the fourth image compared to the others.
Here is the breakdown of the major data error, followed by visual and platform differences.
1. The Major Data Discrepancy (OHLC Error)
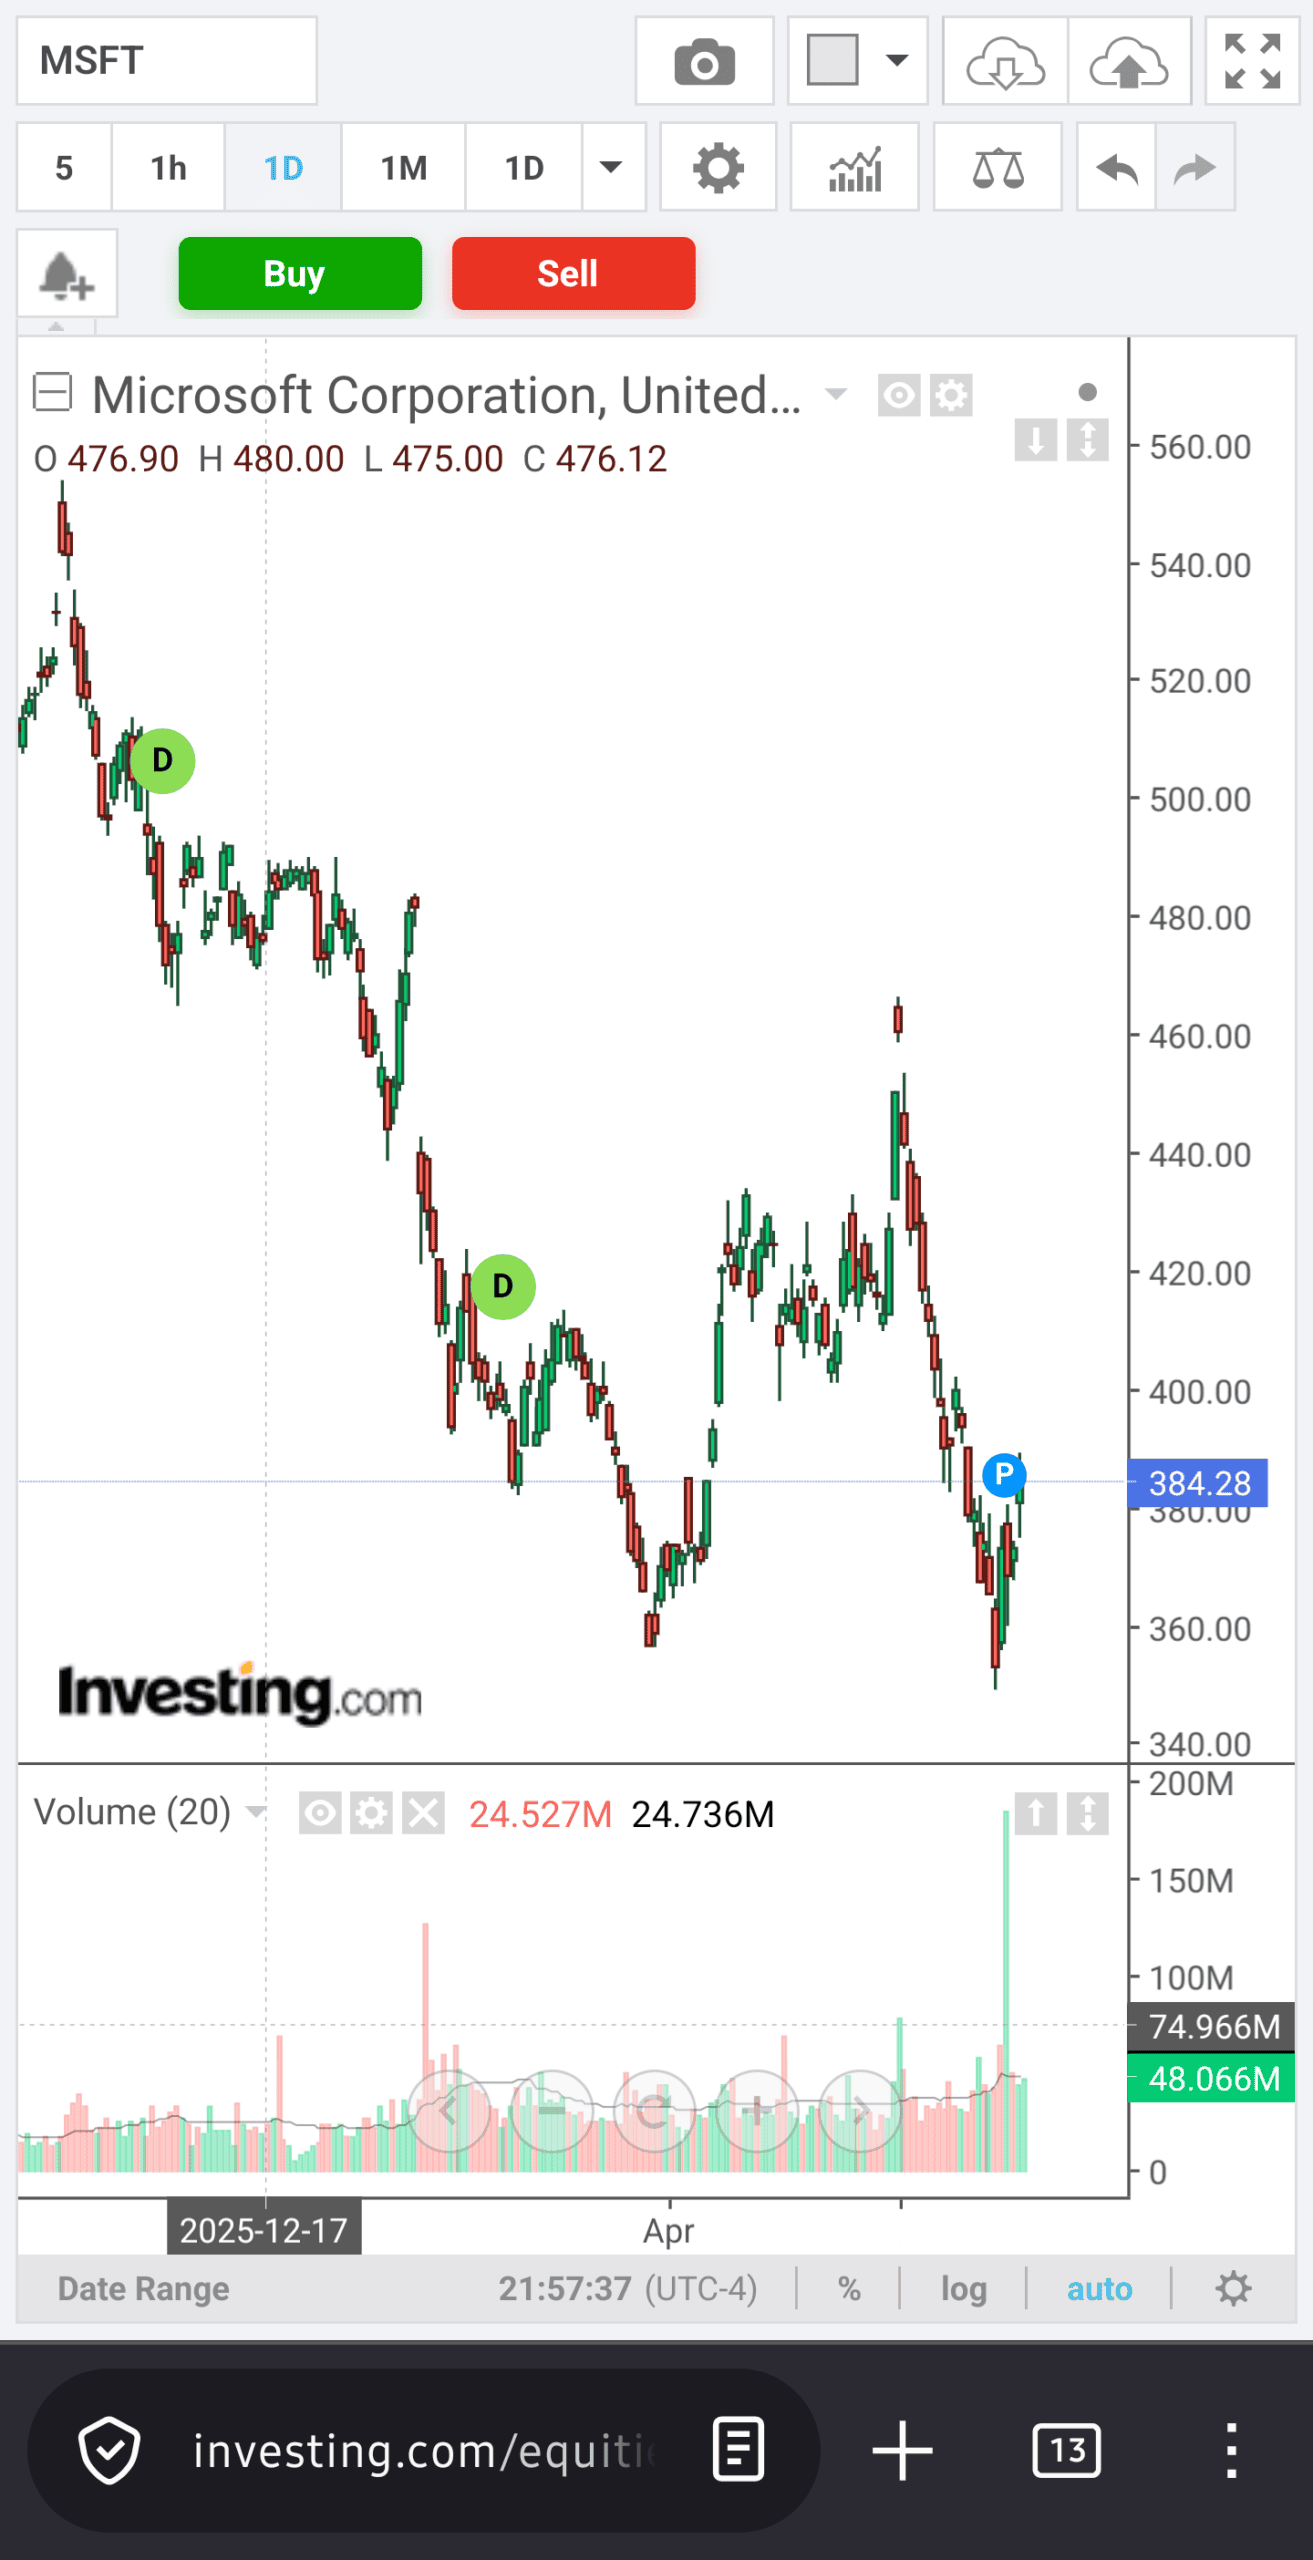
- image_6cc403.jpg (Investing.com): Look closely at the data text overlay at the top left of the chart. It reads:
O: 476.90 H: 480.00 L: 475.00 C: 476.12- This data is completely incorrect for the final day’s candle or the visible price action, as the actual price line is resting at 384.28 (indicated by the blue label on the right axis). The chart has a major mismatch between its text data readings and the visual plot.
- The other charts:
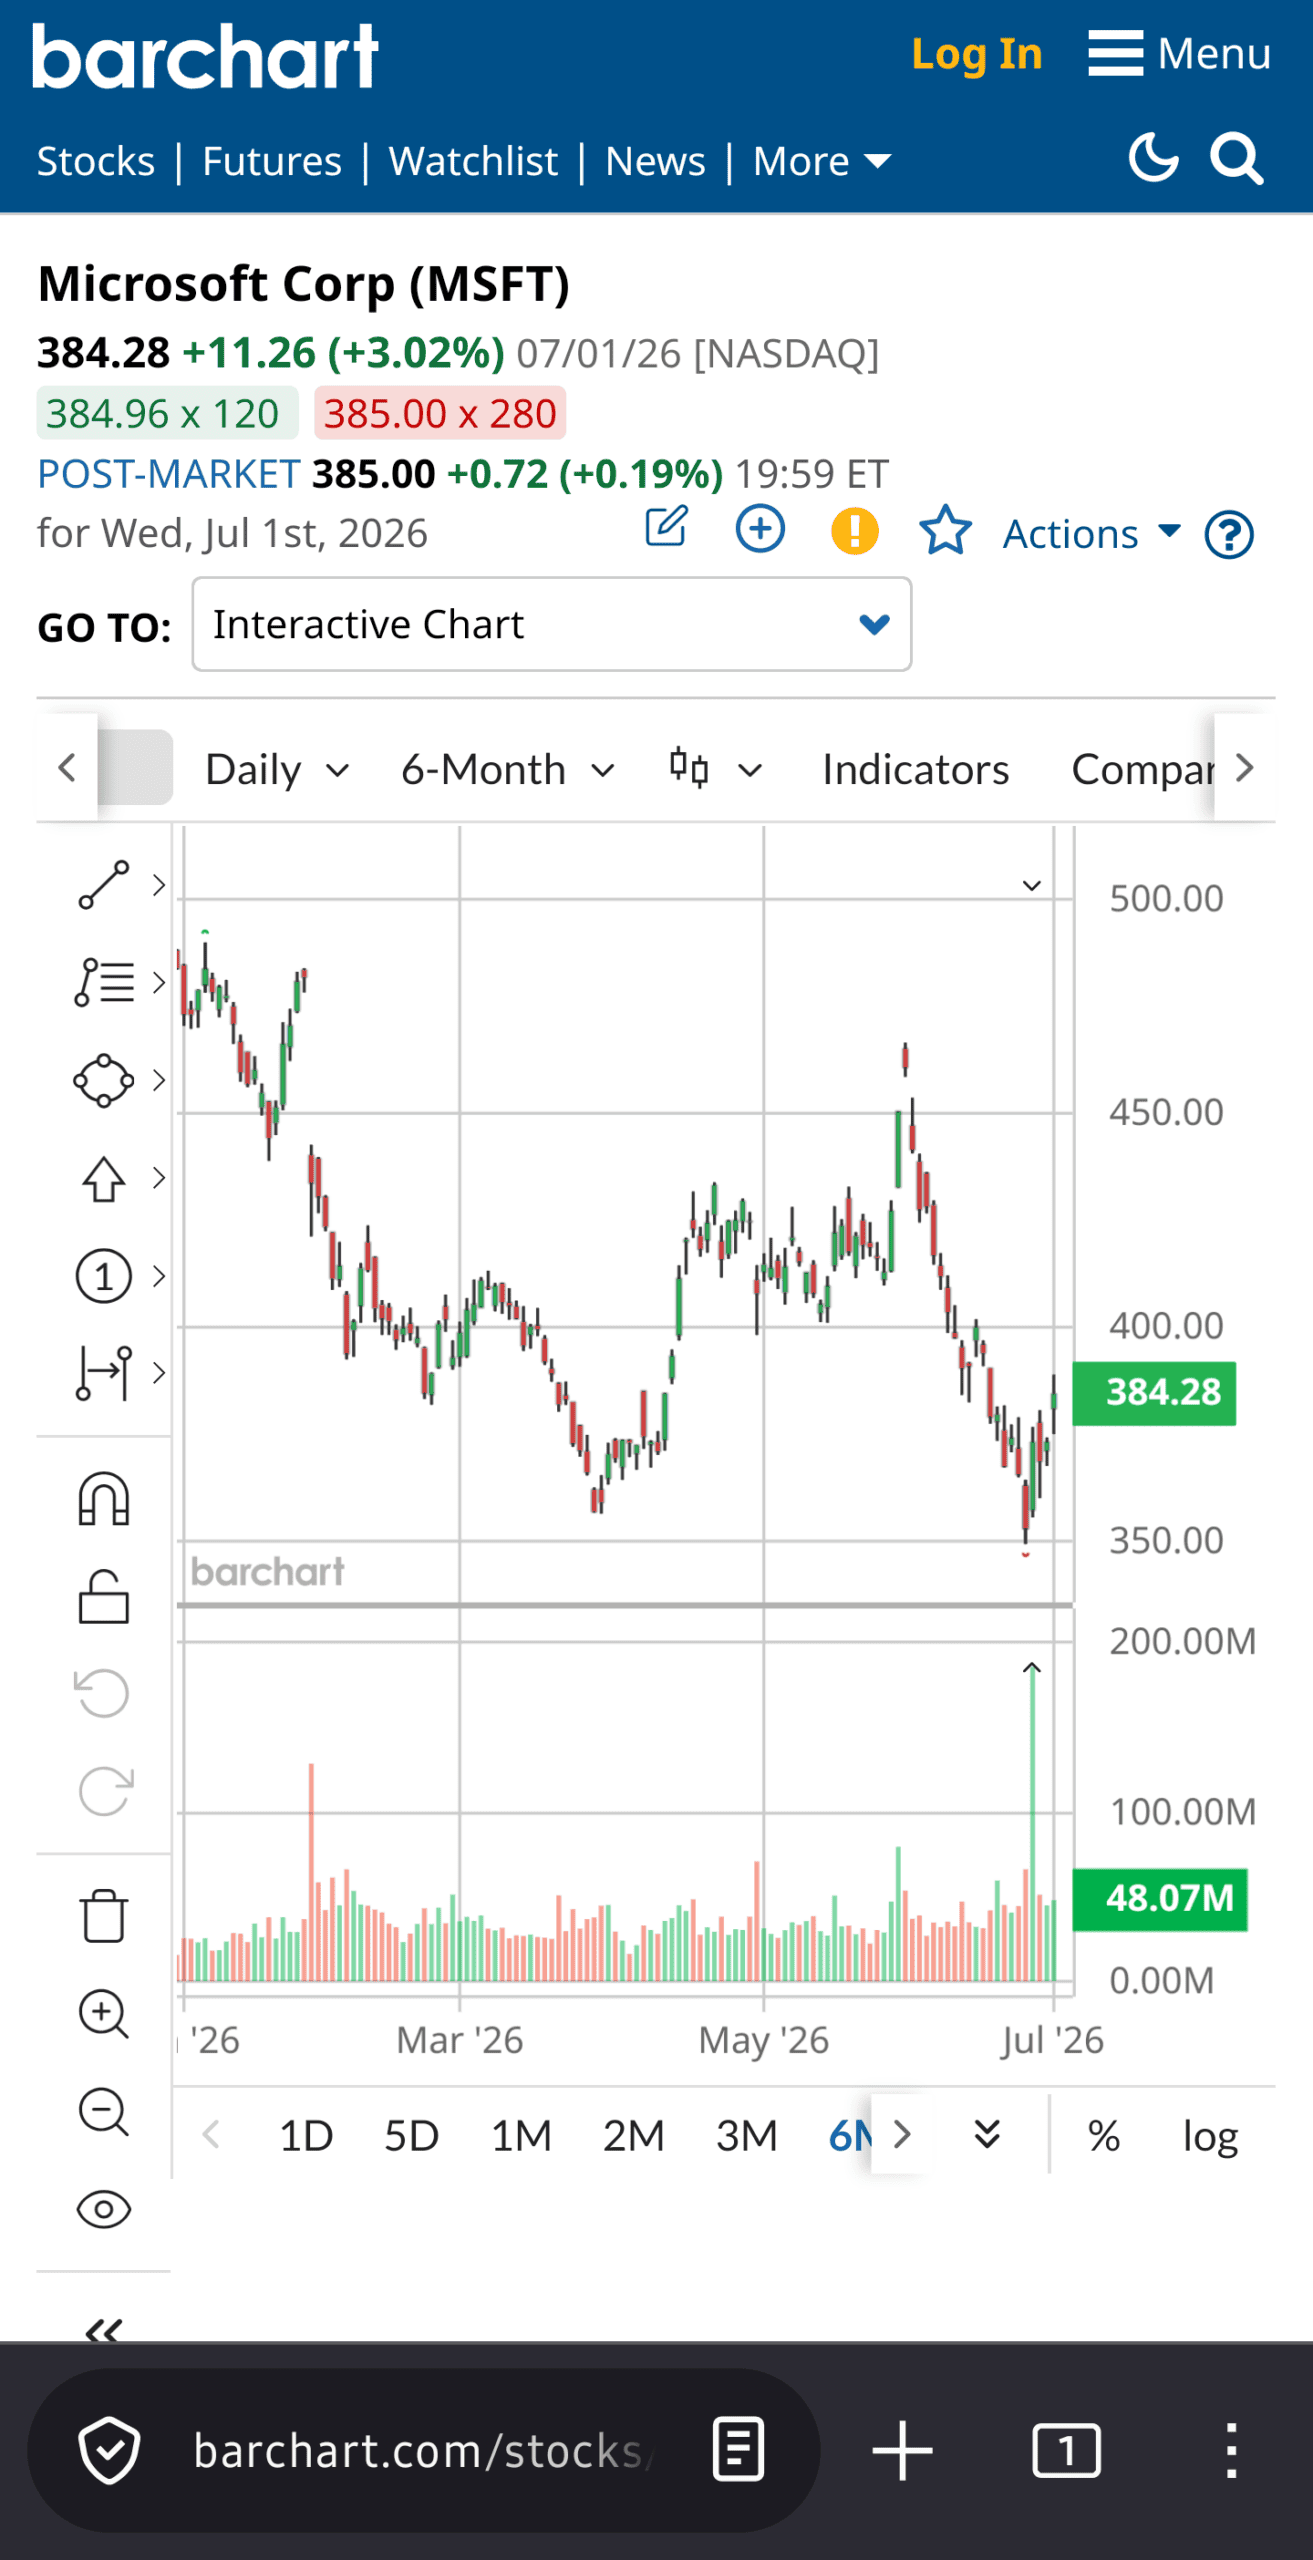
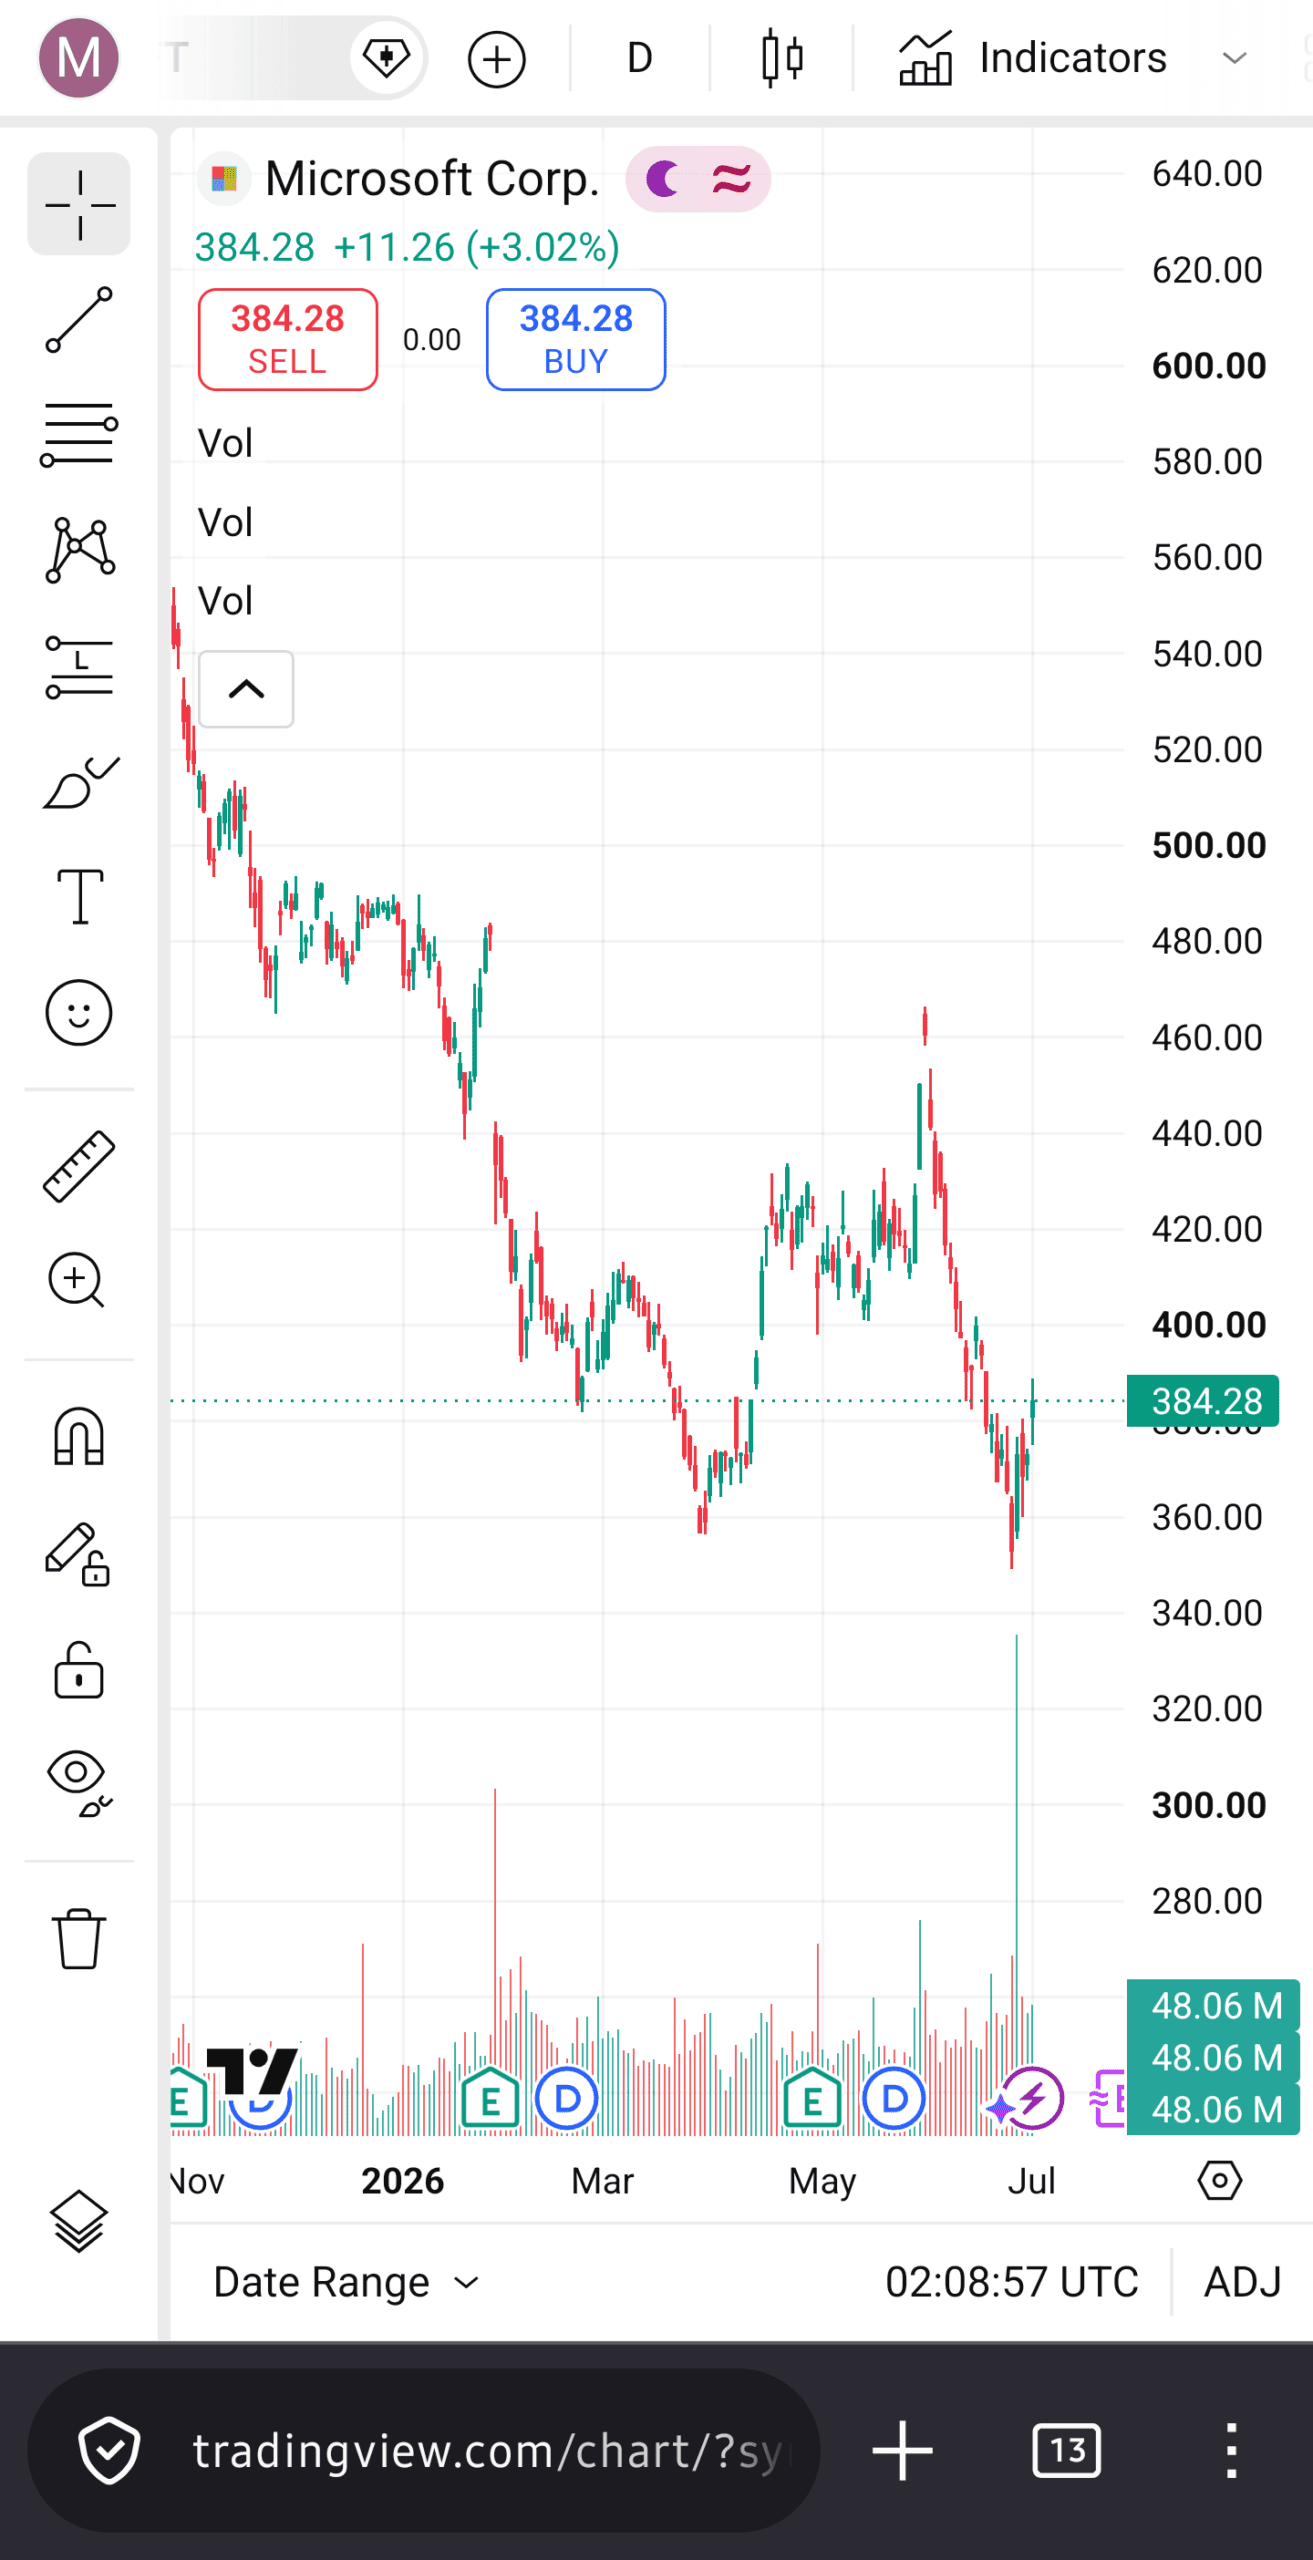
image_6cc39d.jpg, image_6cc3bc.jpg, and image_6cc3e3.jpg all correctly anchor their final price tracking, metrics, or axis labels to the 384.28 level.
2. Volume Reporting Differences
At the final timestamp, each platform reports slightly different volume figures for the session:
- image_6cc39d.jpg (Nasdaq): Reports a total volume of 48,065,800.
- image_6cc3bc.jpg (Barchart): Rounds this to 48.07M.
- image_6cc3e3.jpg (TradingView): Shows 48.06M (with duplicate volume labels in its indicator panel).
- image_6cc403.jpg (Investing.com): Shows 48.066M in the green axis label, but its volume indicator text reads two separate values:
24.527M and 24.736M.
3. Visual & Technical Chart Formats
- Chart Type:
image_6cc39d.jpg uses a smoothed Line chart with a blue gradient fill. The other three (image_6cc3bc.jpg, image_6cc3e3.jpg, image_6cc403.jpg) use standard OHLC Candlesticks. - Time Scale & Range:
image_6cc3bc.jpg spans exactly a 6-Month view (Jan ’26 to Jul ’26).image_6cc3e3.jpg and image_6cc403.jpg show a slightly wider window, capturing data leading back into November/December 2025.- Corporate Events:
image_6cc3e3.jpg and image_6cc403.jpg display icons on the bottom/chart body marking Earnings (E) and Dividends (D / P), which are absent on the Nasdaq and Barchart screenshots. - Timezones:
image_6cc3e3.jpg is tracking at UTC, while image_6cc403.jpg is set to UTC-4 (Eastern Time).
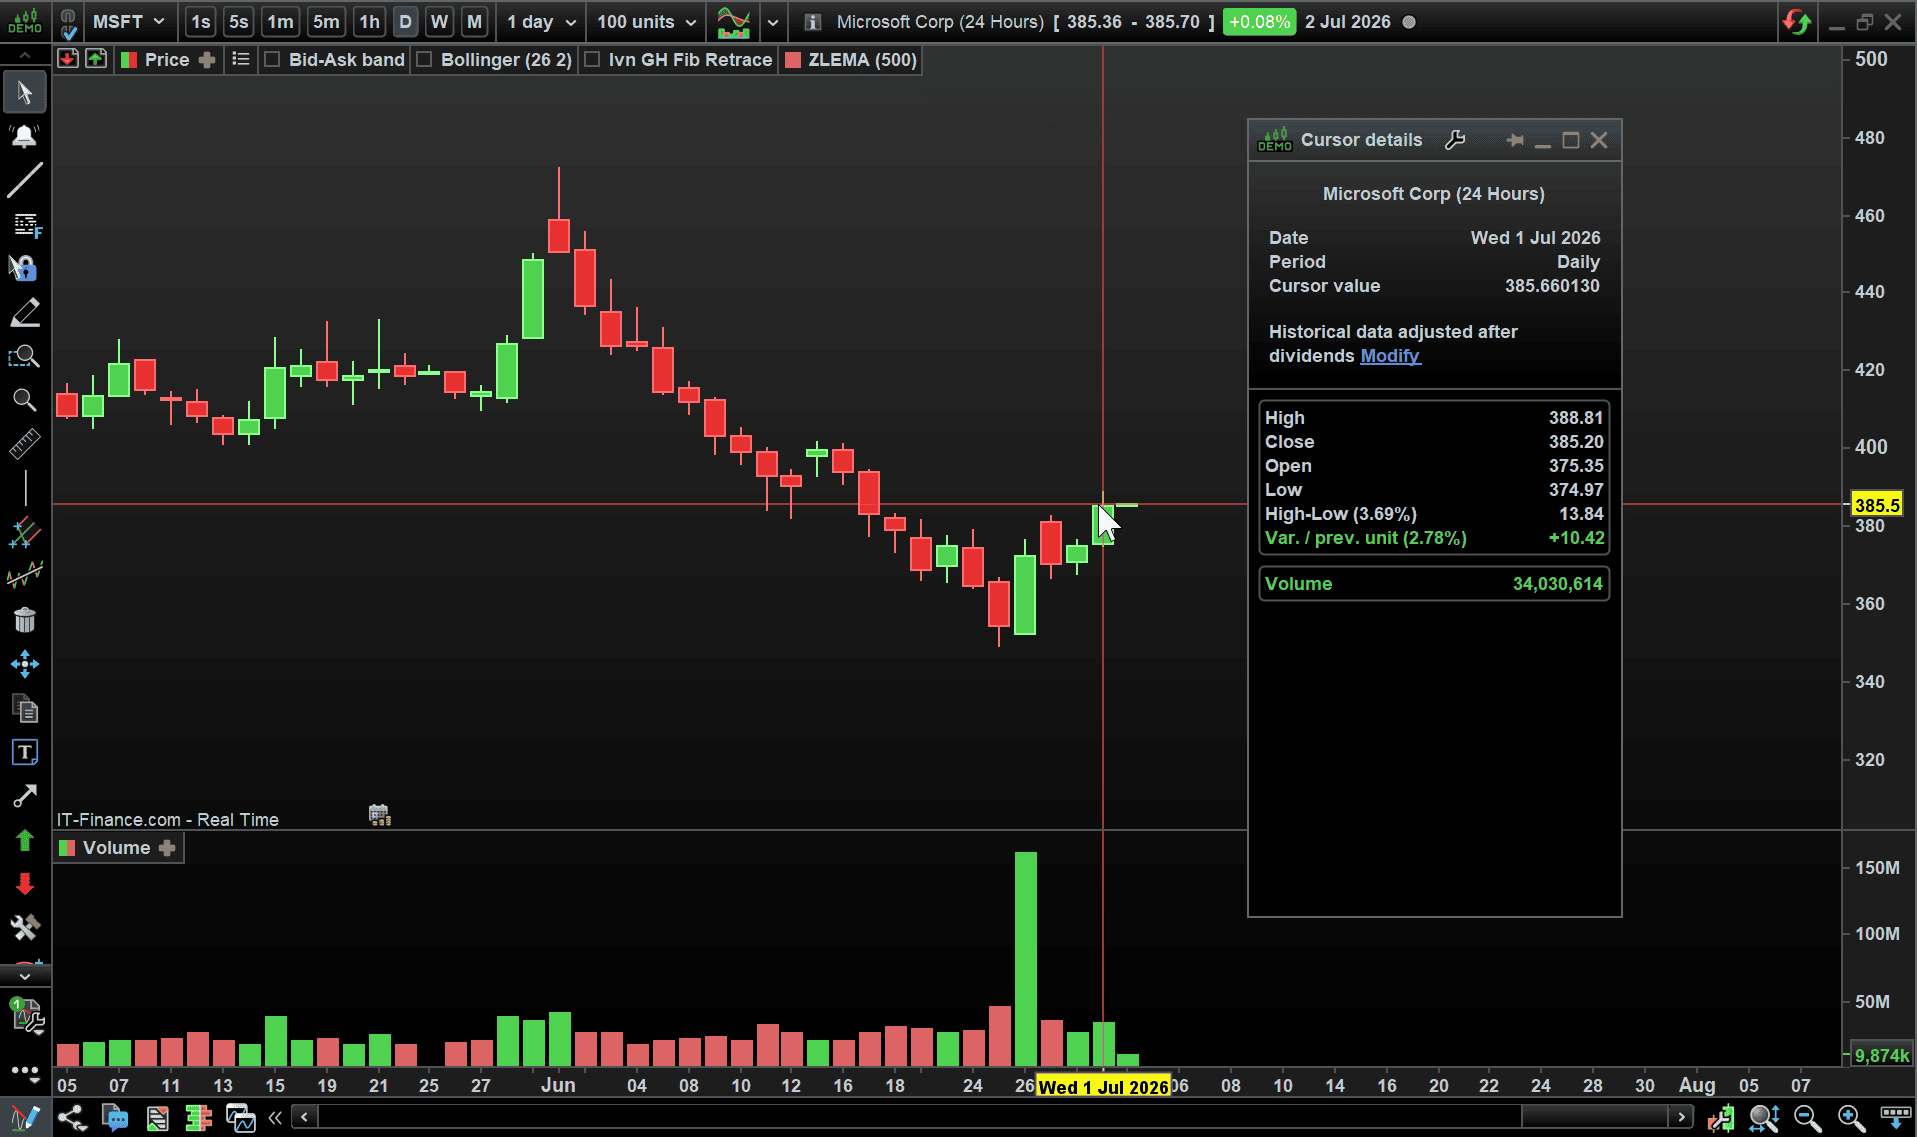
Attached is what I see on PRT. Volume is for IG clients only so is understandibly lower.
What do you see on your PRT for 1 Jul 26 MigVi?
MigVi wrote: Those screenshots simply demonstrate, with clear evidence, one of the glaring discrepancies
I am confused, none of the 4 charts you posted are from PRT.
The chart (4th image) showing the biggest discrepancies (re OHLC values) is from investing.com.
JSParticipant
Veteran
@GraHal, don’t try to find any logic in the work of professor sourpuss, it’s a waste of time…
God!!!!Did you really waste all that time analysing the differences between the platforms that provide information on Nasdaq stocks, particularly the ones I listed here SO THAT YOU COULD COMPARE THEM WITH PROREALTIME?!?!?!Do you have any brain cells?!
Another smart alec…!
Have a good look at the timeline extensions I’ve shown you in the four screenshots and see if that first massive divergence – just the first one, mind you, but the least significant of them all – really stands out to you… Do you actually have any brain cells, or are you just trying to pretend and hide what you see, you little smart alec!?
People here for sure must all be ProRealTime workers…
MigVi wrote: COMPARE THEM WITH PROREALTIME?!?!?!Do you have any brain cells?!
In all your verbiage, you have forgotten the purpose of this Topic (that YOU created)?
Here is the title again as a reminder:
VERY SERIOUS ERRORS IN PROREALTIME’S ESSENTIAL DATA
For some reason – known only to yourself – you have now shifted to drawing our attention to differences between charts from TradingView and Investing.com.
JS was right, you are wasting our time. We were happy to try and find any truth behind the title of this Topic, but you seem intent on belittling our good efforts.
Without an apology, followed by a change of your attitude, I am done!
GraHal wrote: For some reason – known only to yourself
No. An idiot like this does not know what he is doing in the first place. He won’t know anything either.
A troll, in general, is a total lunatic who trolls because he/she likes trolling ( https://en.wikipedia.org/wiki/Trolling ).
In this special case the reason is unknown which is different from a new forum contender who starts out like this right away. Ever back this bloke, who clearly cannot help himself, seemed to be “normal” (FWTW).
I started to use the word deficit (which word he promptly started to use in each sentence) because that’s what it is. Cognitive deficits or impairments. Disorders if you want (that is not exactly the same, but it applies better to what we see here).
Ever back I managed to get in private contact with a troll who appeared to be a normal person but still was not. He could explain to me why he was doing what he did without inhibitions but clearly had collected a couple of disorders.
In the link I gave above we see the famous “don’t feed the trolls” to get rid of them, but as long as Nicolas permits it (I have no clue why he does) we may have fun with it. The only waste would be trying to help “something” which does not need help at all.