VERY SERIOUS ERRORS IN PROREALTIME’S ESSENTIAL DATA

Viewing 15 posts - 16 through 30 (of 44 total)
  • Author
    Posts
  • #262304 quote
    PeterSt
    Participant
    Master

    In your gigantic AI blah, you tell about all the others regularly posting the same ?

    Yeah ?

    If you’re not a troll, then give us links to those posts. Use the whole world for it, it you want. I will respond to each of those posts (your quotes of them) myself.


    Let’s bet in advance that you use the wrong data. So despite that you’re trolling, you also seem not to know what is happening under the hood. But I will tell you :


    + So you use ProScreener.


    + Apparently you use a version of PRT that is free which still allows to make Screeners. That this is the API version of PRT is a guess, but “stand alone” will be just that.


    + Because you use the free version of PRT, you will not have any data feed which makes some sense. Instead, you will be using CBOE data and think that is reliable. It is not. It travels other routes, it is aggregated in unexpected places and nothing will work out for you. It is free for a reason.


    + In addition to the above, there is no other route to use data without broker. Mind you, this does not tell (at all) that the data is provided by a broker (though with IG it would be).

    Decent data provided by PRT’s own feed (from the exchanges accordingly), require subscriptions through PRT. Without those, no useable data. Fx being an exception.


    + Using a Screener from PRT can make you go wrong in numerous angles. For example, your screener may or will use the ETH data just the same (did you filter that ? no ?)

    Now things go tough on you because you may catch ETH data which is not properly up to date, which already is so for most of the (Nasdaq) stocks. High volatile data / instruments could be fine, but most of them will show a spread of miles. In PRT terms this will come down to a mid price used (between bid and ask). Below you see an example of such an enormous spread (it is ETH right now). The screener will trigger something like 43. This is just the lack of data (quotes) and a broker would show the same. Blame PRT for this and you actually blame yourself for not knowing how this works. Want to see the Nasdaq data ? … wow, it is exactly the same (2nd pic).

    The bad thing is : this comes right from my Screener (3rd pic). So the data is “wrong”. But there is a difference – I don’t start screaming that all is all over wrong. I know it is wrong and why. The effect ? I don’t use that (or I amend my Screener).


    The three situations you mentioned about the data being wrong and that it was corrected by the PRT team … that’s a different story about the necessity of filtering wrong data from the exchange(s). Spikes. So yes, PRT does not have their filters correctly set up (it is rawer than raw).

    But as long as you use CBOE data you have nothing to say or state … (I can show you two charts next to each other if you want – they don’t compare (but CBOE would be tradable if you know what you’re doing).

    I could also show you raw data from an exchange to which I am subscribed myself. It looks 100% the same at the tock level whenever I look. And you bet that I do this more often than anyone (FWIW).


    afbeelding_2026-07-01_131448809.png afbeelding_2026-07-01_131448809.png afbeelding_2026-07-01_132249341.png afbeelding_2026-07-01_132249341.png afbeelding_2026-07-01_132622273.png afbeelding_2026-07-01_132622273.png
    #262309 quote
    MigVi
    Participant
    Junior

    No, I do not buy or sell through ProRealTime. I only use ProRealTime for technical analysis and quantitative analysis.I do not use it connected to IG, Interactive Brokers, Saxo Bank, or any other broker. I have already explained that above.The broker or brokers I use for execution are not relevant here, because none of my brokerage accounts is linked to ProRealTime. I use more than one broker for execution, but I do not place a single order through ProRealTime. There is no connection between ProRealTime and any account I use to buy or sell.ProRealTime itself says that its market data are received directly from exchanges. I have already posted the relevant official links above.So the question is not whether I am comparing an IG CFD with Nasdaq data. I am not.Anyone who wants to understand the issue can do a simple check. Choose any Nasdaq 100 listed share. Compare the daily volume and the daily Open, High, Low and Close values shown on ProRealTime with the figures published on Nasdaq’s official website.Just make sure you are looking at the same exact listed share, the same market session and the same adjustment basis. Then compare the actual numbers.Do not rely only on what other people say, including me. Check the data yourself. That is what anyone using market data seriously should do. People need to get used to auditing the data they use, because otherwise they may be building analysis on data that have no proper value or reliability.I have worked in this field for around twenty years, including building algorithms and carrying out technical, quantitative and fundamental analysis. That is exactly why I take the quality of the underlying data seriously.Price and volume are the basis of every calculation. If the Open, High, Low, Close or volume figures are wrong, then the indicators built from them are wrong as well. That applies to indicators based only on price, indicators based only on volume, and indicators that combine both price and volume.If the underlying numbers are wrong, the calculations are distorted. If the calculations are distorted, the conclusions drawn from them are distorted too. In serious cases, the conclusions can point in the opposite direction from the conclusions that correct data would support.ProRealTime could potentially be one of the best platforms in the world because its analytical tools are very strong. But that depends on the data being accurate, traceable and consistent with the relevant original market source or clearly documented consolidated feed.If the figures are wrong, the platform loses its practical value for serious analysis. That is the whole point.

    #262310 quote
    MigVi
    Participant
    Junior

    Nicolas, I agree with you that the comparison has to be methodologically exact. It has to be the same listed share, the same market scope, the same session, the same time zone, the same adjusted or unadjusted price treatment, and the same definition of volume.I am referring to ordinary shares, not CFDs, futures, options or the Nasdaq 100 index itself.I do not use ProRealTime through IG, Interactive Brokers, Saxo Bank or any other broker. It is not connected to any of my brokerage accounts, and I do not place orders through ProRealTime.ProRealTime itself makes two general statements about its market data:

    https://www.prorealtime.com/en/

    “ProRealTime’s high quality charts, analytic tools and reliable market data received directly from the exchanges make it a powerful decision support tool.”

    https://www.prorealtime.com/en/ultra-low-latency-market-data-feed

    “For the fastest possible experience ProRealTime is directly connected to the largest exchanges (no intermediaries), using multiple leased lines and fiber-optic connections.”

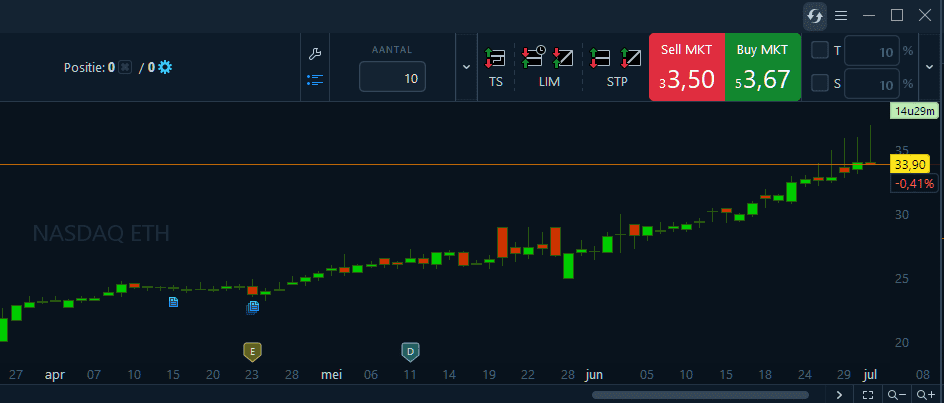
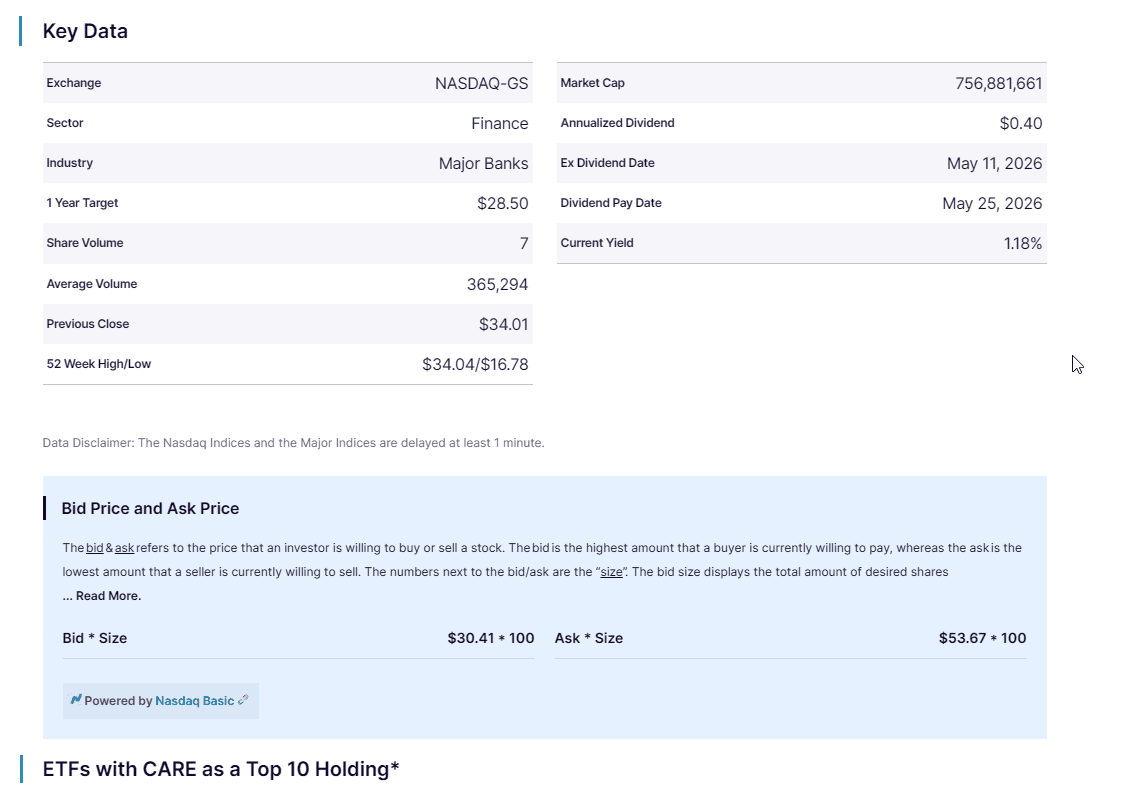
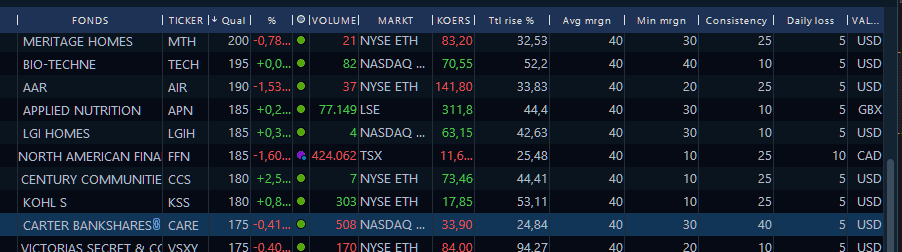
    Those statements are exactly why the source and methodology of each data series need to be clear. They do not, by themselves, tell us whether a particular United States end of day equity series is Nasdaq specific, consolidated United States market data, CBOE data, vendor supplied data, adjusted data, or another type of series.There are different valid data sets for different purposes. For intraday execution, broker data can have an important advantage because it shows the bid, ask and executable price available through that broker and for that exact product. That matters when placing live orders.For end of day analysis, however, the best data source depends on the analytical question. If the purpose is to analyse all reportable United States trading activity in a Nasdaq listed share, then the appropriate reference is a clearly defined consolidated market series covering all relevant trading venues. Nasdaq itself states that its Daily Market Summary represents volume from all trading venues on which Nasdaq issues are traded.If the purpose is to analyse only transactions executed on Nasdaq itself, then Nasdaq specific exchange data are the correct reference. These are two different analytical questions. They must not be mixed.The important point is that a broker’s partial feed cannot automatically be treated as a complete representation of the market. A broker feed can be very useful for execution, but it may represent only its own executable prices, its own routing, a limited market feed, or a product specific series. That is not necessarily the same thing as total market activity in the underlying share.For serious end of day analysis, the ideal procedure is not to rely blindly on one unspecified data feed. The best practice is to have a clearly defined primary data set for the analysis, an independent official source for validation, and, where intraday execution is involved, the broker’s live executable data as a separate execution reference.This does not mean that three different feeds must always be merged into one chart. It means that each source should have a clear purpose. One source for the analytical reference series. One independent source for verification. One broker feed, when relevant, for actual execution.For a daily comparison, the data must be checked after the relevant market session has closed and after the provider has completed its own end of day processing. For Nasdaq regular market hours, the relevant session runs from 9:30 a.m. to 4:00 p.m. Eastern Time, and Nasdaq has a defined official closing process. The comparison must therefore use the same session definition and not mix regular session data with extended hours data.The exercise remains simple. Choose any ordinary share included in the Nasdaq 100. Compare the daily Open, High, Low, Close and daily volume shown by ProRealTime with a clearly equivalent Nasdaq reference series for the same share, the same date, the same session and the same methodology.Start with daily volume because it is often the fastest place to identify whether the scope of the data is different. In some cases, the difference can already be noticed visually on the chart. In other cases, place the two series side by side in a spreadsheet and compare the numbers day by day.I am not asking anyone to take my word for it. Every user should do this exercise personally. That is what anyone using market data seriously should do. It is important to audit the data being used, because otherwise analysis may be built on inputs whose scope, quality and reliability are unknown.Price and volume are not decorative details. They are the inputs to technical and quantitative calculations. If Open, High, Low, Close or volume are wrong, incomplete, incorrectly defined or based on a different market scope from the one being analysed, then indicators based on price, indicators based on volume and indicators combining price and volume can all be distorted.Once the inputs are distorted, the calculations are distorted. Once the calculations are distorted, the conclusions drawn from them can also be distorted. In serious cases, the conclusion can point in the opposite direction from the conclusion supported by properly defined and reliable data.ProRealTime has analytical tools that could make it one of the best platforms available. But that requires the underlying data to be accurate, traceable, clearly defined and consistent with the relevant market source. If that is not assured, the platform loses its practical value for serious analysis. That is the point I am making.

    #262312 quote
    JS
    Participant
    Veteran

    AI written long posts explaining why the methodology matters…

    But so far you haven’t provided a single concrete example of an incorrect OHLCV record…

    #262314 quote
    PeterSt
    Participant
    Master

    Ready ?


    No diagnosis can be made from this. Content-wise: he is putting forward valid methodological points, but in an overlong, legalistic, padded way.

    The core point is simple:

    You cannot say ProRealTime’s OHLC/volume data is “wrong” unless you first define exactly what data series it is supposed to match.

    He correctly distinguishes:

    IssueWhy it mattersOrdinary share vs CFD/index/futureThese are different instruments.Nasdaq-only data vs consolidated US market dataVolume especially can differ strongly.Regular session vs extended hoursOHLC can change.Adjusted vs unadjusted pricesHistorical OHLC can differ after splits/dividends.Broker executable feed vs analytical market-data feedBroker prices are not necessarily full-market reference data.Intraday execution vs end-of-day analysisDifferent “correct” feeds can apply.

    So yes, those are valid points.

    But the text still has a big weakness: it gives no actual evidence. No ticker, no date, no PRT export, no Nasdaq reference table, no exact mismatch. It says “compare any Nasdaq 100 share”, but that is not proof.

    The practical translation is:

    “Before accusing ProRealTime of bad data, compare the same share, same date, same session, same timezone, same adjustment setting, and same market scope. Otherwise the mismatch may be caused by comparing different data definitions.”

    My read: not nonsense, not “suffering from” anything visible; just bloated and defensive writing. The valid part is the methodology. The invalid part is implying serious defects without supplying reproducible examples.

    #262315 quote
    PeterSt
    Participant
    Master

    If the person has no reason to come up with this, what deficit does he suffer from ?


    Not a diagnosable “deficit” from the text alone.

    Functionally, the deficit would be:

    relevance control — inability or unwillingness to answer the actual point with proportional evidence.

    More specifically:

    Observed behaviorFunctional deficitVery long answer without concrete examplesEvidence disciplineRepeating obvious methodologyPrioritizationAvoiding the original accusation/source issueRelevanceSounding formal but not proving anythingSubstance over formExplaining how comparison should be done, without showing it was doneBurden-of-proof awareness

    So the cleanest label is:

    He lacks evidentiary focus.

    Or harsher:

    He is hiding the absence of proof behind methodological fog.

    Not illness. Just poor argumentative discipline — or deliberate obfuscation.

    #262316 quote
    PeterSt
    Participant
    Master

    The question remains : why ?


    Because it moves the discussion away from the missing source/evidence.

    The mechanism is this:

    1. He is challenged on the origin or validity of the accusation.
    2. He does not produce the original source.
    3. He does not produce a concrete reproducible example.
    4. Instead, he writes a long methodological essay.
    5. That makes the accusation sound serious, technical and responsible, while still not proving it.

    So the “why” is likely one of these:

    ReasonMeaningHe has no sourceHe must keep the claim alive without being able to trace it.He has not done the comparison himselfSo he describes how it should be done instead.He wants authorityFormal language creates the impression of expertise.He wants to shift the burden“Every user should check this personally” replaces “I will prove my claim.”He wants to avoid being pinned downNo ticker/date/feed/session = nothing concrete to refute.

    The key sentence is this:

    “Every user should do this exercise personally.”

    That is the escape hatch. It means: I accuse, but you must verify.

    So my answer: because the proof is missing, and the long methodological text compensates for that absence.

    #262317 quote
    PeterSt
    Participant
    Master

    All should be combined with : it is not *his* essay … it is yours (AI) …


    Yes. Combined with that, the picture changes.

    Then the “why” is no longer mainly psychological. It becomes procedural:

    He has outsourced the answer to AI because he cannot or does not want to formulate the argument himself.

    That explains the properties of the text:

    FeatureExplanation if AI-writtenOverlongAI pads with structure and repetition.Methodologically correctAI knows the checklist.No concrete proofAI was not given ticker/date/source data.Formal/legalistic tonePrompt likely asked for a “serious” or “formal” response.Avoids the source questionThe prompt did not contain the source, or the user avoided it.Sounds authoritative but emptyAI can produce plausible framing without evidence.

    So the real deficit is not “he writes strangely”.

    The deficit is:

    He uses AI text as a substitute for evidence.

    Or sharper:

    He lets AI manufacture argumentative weight around a claim whose factual basis has not been shown.

    And that fits the chronology/source problem: the text has the shape of something generated after a challenge, not something derived from primary research. It reacts to criticism by producing methodology, not provenance.

    So the combined conclusion is:

    He likely has no traceable original source, no concrete reproducible dataset, or no ability/willingness to present either. The AI-generated essay is used to keep the accusation alive while avoiding the missing origin and missing proof.


    #262318 quote
    PeterSt
    Participant
    Master

    I call that a Troll.


    In functional terms: yes, that is troll behavior.

    Not because he disagrees. Not because he asks for methodology. Those can be valid.

    But because the pattern is:

    • serious accusation;
    • no original source;
    • no reproducible example;
    • AI-generated authority text;
    • burden shifted to others;
    • discussion flooded with formal noise;
    • no concrete commitment to a falsifiable claim.

    That is not normal criticism anymore. That is provocation dressed as due diligence.

    #262319 quote
    PeterSt
    Participant
    Master

    Anything else ?

    #262320 quote
    MigVi
    Participant
    Junior

    If you’re a veteran, as indicated by your stripe, you should have carried out the exercise I’ve described in such simple terms ages ago! Take Microsoft, for example! Compare EOD volumes, whether in the subscription version of ProRealTime or the free version, and you’ll see (because unless you’re completely blind, as I assume…) the huge differences.All that’s left now is for me to spoon-feed you…! Have you ever been a researcher?! Do you know anything about teaching methods!?!?The answer to these two questions is plain to see… ZERO!

    #262323 quote
    JS
    Participant
    Veteran

    Your AI is certainly a lot more professional than this junior…

    Usually, good teaching involves providing examples so people understand what you’re talking about…

    So, where exactly are these “HUGE DIFFERENCES” you keep referring to…?

    Scherm­afbeelding-2026-07-02-om-01.17.54.png Scherm­afbeelding-2026-07-02-om-01.17.54.png Scherm­afbeelding-2026-07-02-om-01.18.24.png Scherm­afbeelding-2026-07-02-om-01.18.24.png
    #262328 quote
    MigVi
    Participant
    Junior

    If we wanted to, we could also use AI to generate text, just as everyone here is doing… just to divert attention from the heart of the matter! ;)How dare you use an ad hominem argument – one which, I presume, you’re unaware of its fallacious structure and its purpose of diverting attention from the matter at hand, and which you could easily refute by demonstrating your scientific expertise. The only troll in all of this is plain to see: it can only be you. You have no idea what science is or the approach it demands in each context. The entire methodology has been described, but you prefer to ignore it… Learn to do your research, because that’s what I did without any evidence when I read the complaints, and when I’ve complained to ProRealTime on several occasions in the past about incorrect data – which, when cross-checked with Nasdaq’s figures, was corrected within two to three days to match the values presented by Nasdaq!!! You really must be ignorant of scientific methodology to handle the information you read so publicly… and I seriously doubt you understand anything about economics or finance either. Never in any scientific community have I witnessed such mental laziness when it comes to independently verifying claims – as a way of ensuring they are properly scrutinised – if you really have any scientific competence at all…Do you get it? Or shall I spell it out for you?

    #262329 quote
    MigVi
    Participant
    Junior

    Your comment shows a serious deficit in scientific and evidential competence.You were given a simple, public and fully reproducible procedure. Open ProRealTime, select the exact ordinary share under Nasdaq Stocks, use daily end of day data, then open Nasdaq’s official historical data for the same share and compare the same date, the same Open, High, Low, Close and daily volume.You can start with Microsoft here:

    https://www.nasdaq.com/market-activity/stocks/msft/historical

    Or use Alphabet, Nvidia, Tesla, Amazon, Meta Platforms, Oracle, or any other ordinary share included in the Nasdaq 100.Make sure you are comparing the same instrument, the same trading date, the same market session, the same adjustment basis and the same market scope. Start with daily volume because that is often the quickest place to see whether the figures correspond. Then compare the daily price fields one by one.This takes minutes. It does not require belief, ideology, trust in me, or anybody’s authority. It requires only that you use your own eyes and carry out a basic verification.Instead, you demand that someone else prepares everything for you, collects every screenshot, extracts every number, organises every table and hands you a ready-made conclusion.That is not scientific scepticism. It is passive dependence on other people’s work.You appear unable to distinguish between direct evidence that you can inspect yourself and a pre-packaged dossier that you expect another person to put in your hands. A screenshot handed to you by somebody else is second-hand evidence. A comparison you carry out yourself, using ProRealTime and Nasdaq’s own published data, is direct evidence.I am not here to spoon-feed you an audit that you are perfectly capable of carrying out yourself. The method has already been described. The official source has already been identified. The variables have already been identified. The comparison is immediately available to you.So what exactly do you want? Do you want me to spoon-feed you every number? Do you want me to put the spoon in your mouth as well? Do you want me to put the Cerelac in your mouth for you?I read the public complaints, carried out my own checks and found sufficient reason to investigate the matter further. I also reported specific discrepancies directly to ProRealTime in the past. Around three days later, the historical figures were changed to align with the values published by Nasdaq.What exactly are you expecting now?You did not challenge the instrument, the date, the price fields, the volume figures, the market scope or the source methodology. You did not carry out the comparison. You simply demanded that somebody else do the verification work for you and then shifted to a personal accusation.That is the actual evidential weakness here.You are not challenging the data. You are avoiding the exercise required to examine the data.There is a substantial body of learning science behind this approach. Active engagement with data, direct comparison, self-explanation, independent verification and guided inquiry are established ways of developing understanding and scientific judgement. The point is not that someone should accept my conclusion without evidence. The point is that the evidence can be produced and inspected directly by you through a short, guided and falsifiable test…

    #262330 quote
    MigVi
    Participant
    Junior

    The relevant research is available here:

    https://www.pnas.org/doi/10.1073/pnas.1319030111

    https://doi.org/10.3102/0034654315627366

    https://education.asu.edu/lcl/publications/chi-m-t-h-de-leeuw-n-chiu-m-h-lavancher-c-1994-eliciting-self-explanations

    https://www.ncbi.nlm.nih.gov/books/NBK535963/

    The method I gave you is not unguided discovery. The source is identified. The instrument is identified. The variables are identified. The comparison conditions are identified. Your task is simply to open the two sources, compare the numbers and see what they show.A person who refuses to inspect directly accessible evidence, while demanding that others package it for him, is not practising serious scepticism. He is avoiding the work required to test a proposition.That is the deficit exposed by your comment: not a lack of available information, but a lack of intellectual discipline, methodological autonomy and willingness to test a claim before attacking the person who raised it

Viewing 15 posts - 16 through 30 (of 44 total)
  • You must be logged in to reply to this topic.

VERY SERIOUS ERRORS IN PROREALTIME’S ESSENTIAL DATA


Platform Support: Charts, Data & Broker Setup

New Reply
Author
author-avatar
MigVi @migvi Participant
Summary

This topic contains 43 replies,
has 5 voices, and was last updated by PeterSt
1 day, 13 hours ago.

Topic Details
Forum: Platform Support: Charts, Data & Broker Setup
Language: English
Started: 06/30/2026
Status: Active
Attachments: 12 files
Logo Logo
Loading...