Hello everyone 🙂
Glad to read you!
@Paul, I just tried and the equity curve is way worse on my side… And what is your option for those trades? I tried but it alos cuts too soon some of them which could make way more profit…!
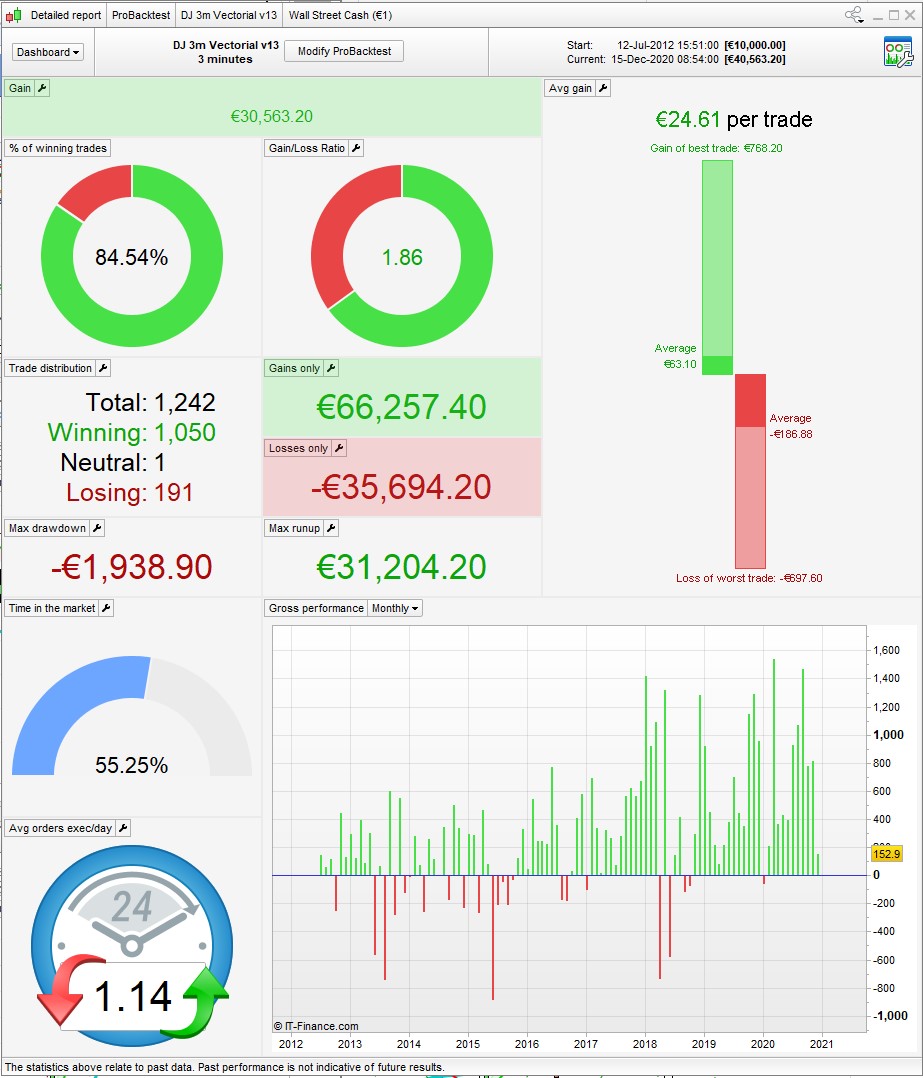
Hi Tanou, thanks very much for your work on this, it looks promising. Not so sure about your decision to optimize only from June 2016 though, as you have effectively curve fit to that data set. A walk backwards is just as indicative as a walk forwards and unfortunately when your algo is run over the full 1m data the performance drops – basically flat for the period 2012-16.
You say that you think the past 4 years are indicative of present market conditions, but no one knows what the market is going to do next year; it may well go back to patterns seen in 2014 – in which case this won’t work. My approach would be to do a 70/30 or 80/20 over the full 8 years. As we now have all that data, might as well make use of it.
Do you by chance have an optimization itf with all the variables set up?
 Paul
PaulParticipant
Master
here’s the file
one thing, I saw you’re testing on $2.
If pipsize is not handled correctly everywhere it also would have different results, so I’ve tested on 1€
run over the full 1m data
So you guys are seeing 1 million bars are you?
I’m seeing same as @vonasi here …
I added a bar counting indicator that also returned the date of the first candle on the chart and I get the following on the SPTRD (SP500):
confess that i didn’t actually count to see if there were truly 1m bars … but when using the historical 1m setting on a 3min chart I get over 8 years of back test (IG Premium).
1m bars by TF:
5min = 10 years (limit of tbt data)
3min = 106 months
2min = 71 months
1min = 34 months
30 sec = 17 months
Thanks Tanou for sharing
CB2 = (pente crosses over trigger) AND (pente < 0.4)
CB2 = (pente crosses over trigger) AND (pente < 0.4)
winratio goes over 90%(100k) but total results go down a bit, equitycurve looks sweet 500k bars.
Yes the results seem to be worst when we change it, especially for the OOS period 2012-2015, which is globally positive with Tanou version. Its weird…
PaulParticipant
Master
I havent really looked into this, but it’s interesting to see performance after optimisation if long & short is handled the same way, either with both <> or both crossover/under.
The equity realised by Tanou will be hard to match.
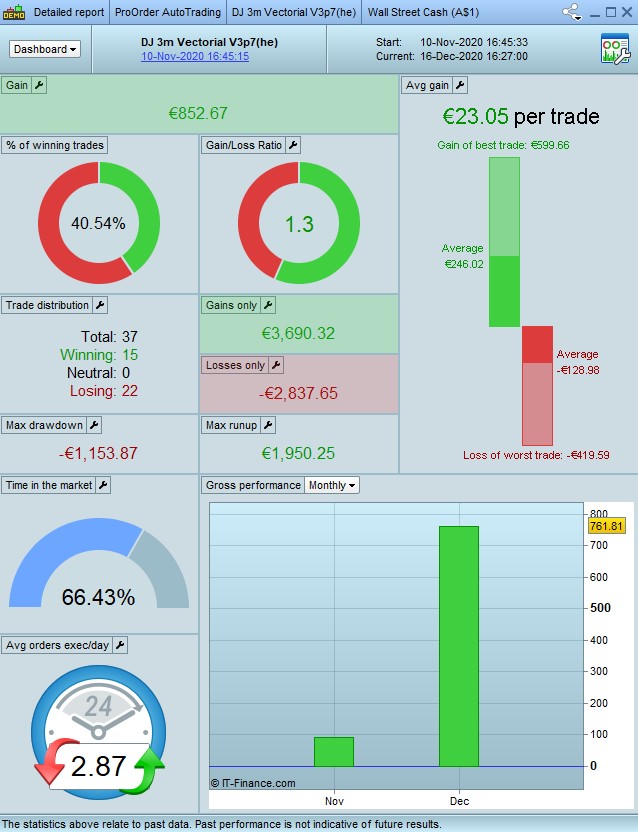
It made me curious how my old version with the heuristics engine is performing. I haven’t running in demo. Bad performance 2 weeks before US election, after the 3rd it’s reasonable.
Hello everyone 🙂
@Paul, what do you mean by “The equity realised by Tanou will be hard to match.”? That you don’t think that the robot could do that or that the strategy is quite good?
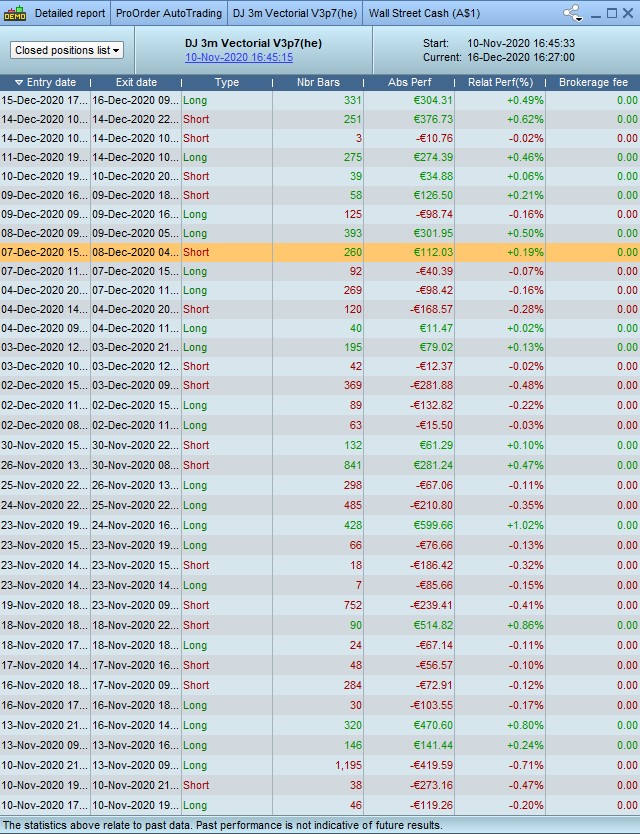
Good afternoon, I have activated it in demos since November 10, I started with 2 cfds in AUD which amounts to € 1.60 per point.
Good afternoon, I have activated it in demos since November 10, I started with 2 cfds in AUD which amounts to € 1.60 per point.
Yuu´re Lucky. The Vector had a bad time in the middle of October with big loss.
Yes, it did, but has since recovered. I took not an insignificant loss in October, but was pleased to see it have recovered by end of Nov. Talk about taking the rough with the smooth! 🙂
PaulParticipant
Master
@Tanou your optimisation is based on tradinghours, therefore the payout is less, but the equitycurve is quite steady from the beginning. It looks good.
On the HE version, I started to look at it again. Replacing breakeven & trailingstops with robertogozzi’s, and the angle changed for short to 35, (tested all values within a small range) improved payout with about 2000.
However I want to have it different, so removed all curvefitting, like market resistance indicator, other exits.
Changed the trailing-stop to include different values for long & short and results are now close to the same as with the extra code. In progress!
@Paul, you did a great job then! 😃
is it possible to get this one to see if I can have a look and maybe helping you improving it? 😃
PaulParticipant
Master
sure here it is. Hope you can find improvements!