Paul
PaulParticipant
Master
I’ve a code for closing on market change.
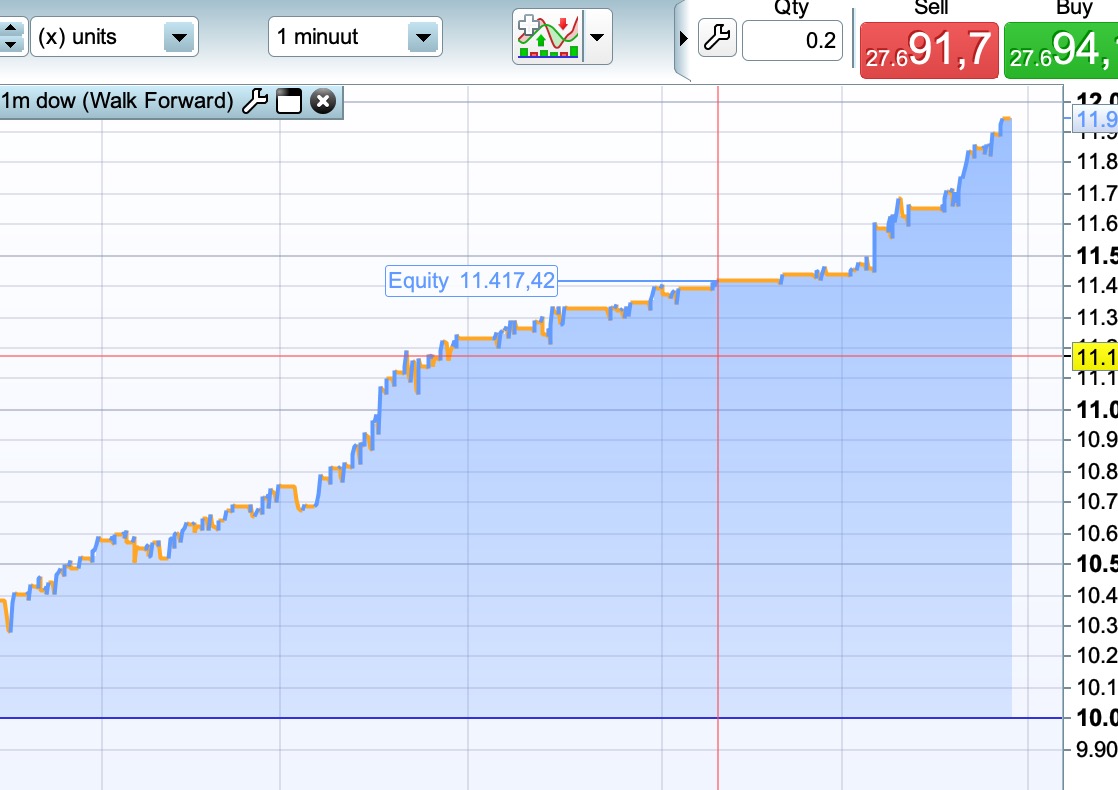
But if you have a equitycurve which is nice, it’s always not so nice if you zoom in closely because it will always go trough up & downs.
Don’t run a code instantly live, but in demo. Or if live very small for testing.
The main difference what i’am testing is wf on a 10k bars. It would’ve prevented some losses. But i’am not convinced atm.
// reversal exit
once longexit =0
once shortexit=1
if longexit then
if longonmarket then
minrangedistL=3
cl1=close<open and close[1]<open[1] and close[2]<open[2]
cl2=(close=low or close[1]=low[1] or close[2]=low[2])
cl3=(range>(close/1000)*minrangedistL or range[1]>(close[1]/1000)*minrangedistL or range[1]>(close[1]/1000)*minrangedistL)
if  cl1 and cl2 and cl3 then
sell at market
endif
endif
endif

if shortexit then
if shortonmarket then
minrangedistS=1.5
cs1=close>open and close[1]>open[1] and close[2]>open[2]
cs2=(close=high or close[1]=high[1] or close[2]=high[2])
cs3=(range>(close/1000)*minrangedistS or range[1]>(close[1]/1000)*minrangedistS or range[1]>(close[1]/1000)*minrangedistS)
if  cs1 and cs2 and cs3 then
exitshort at market
endif
endif
endif
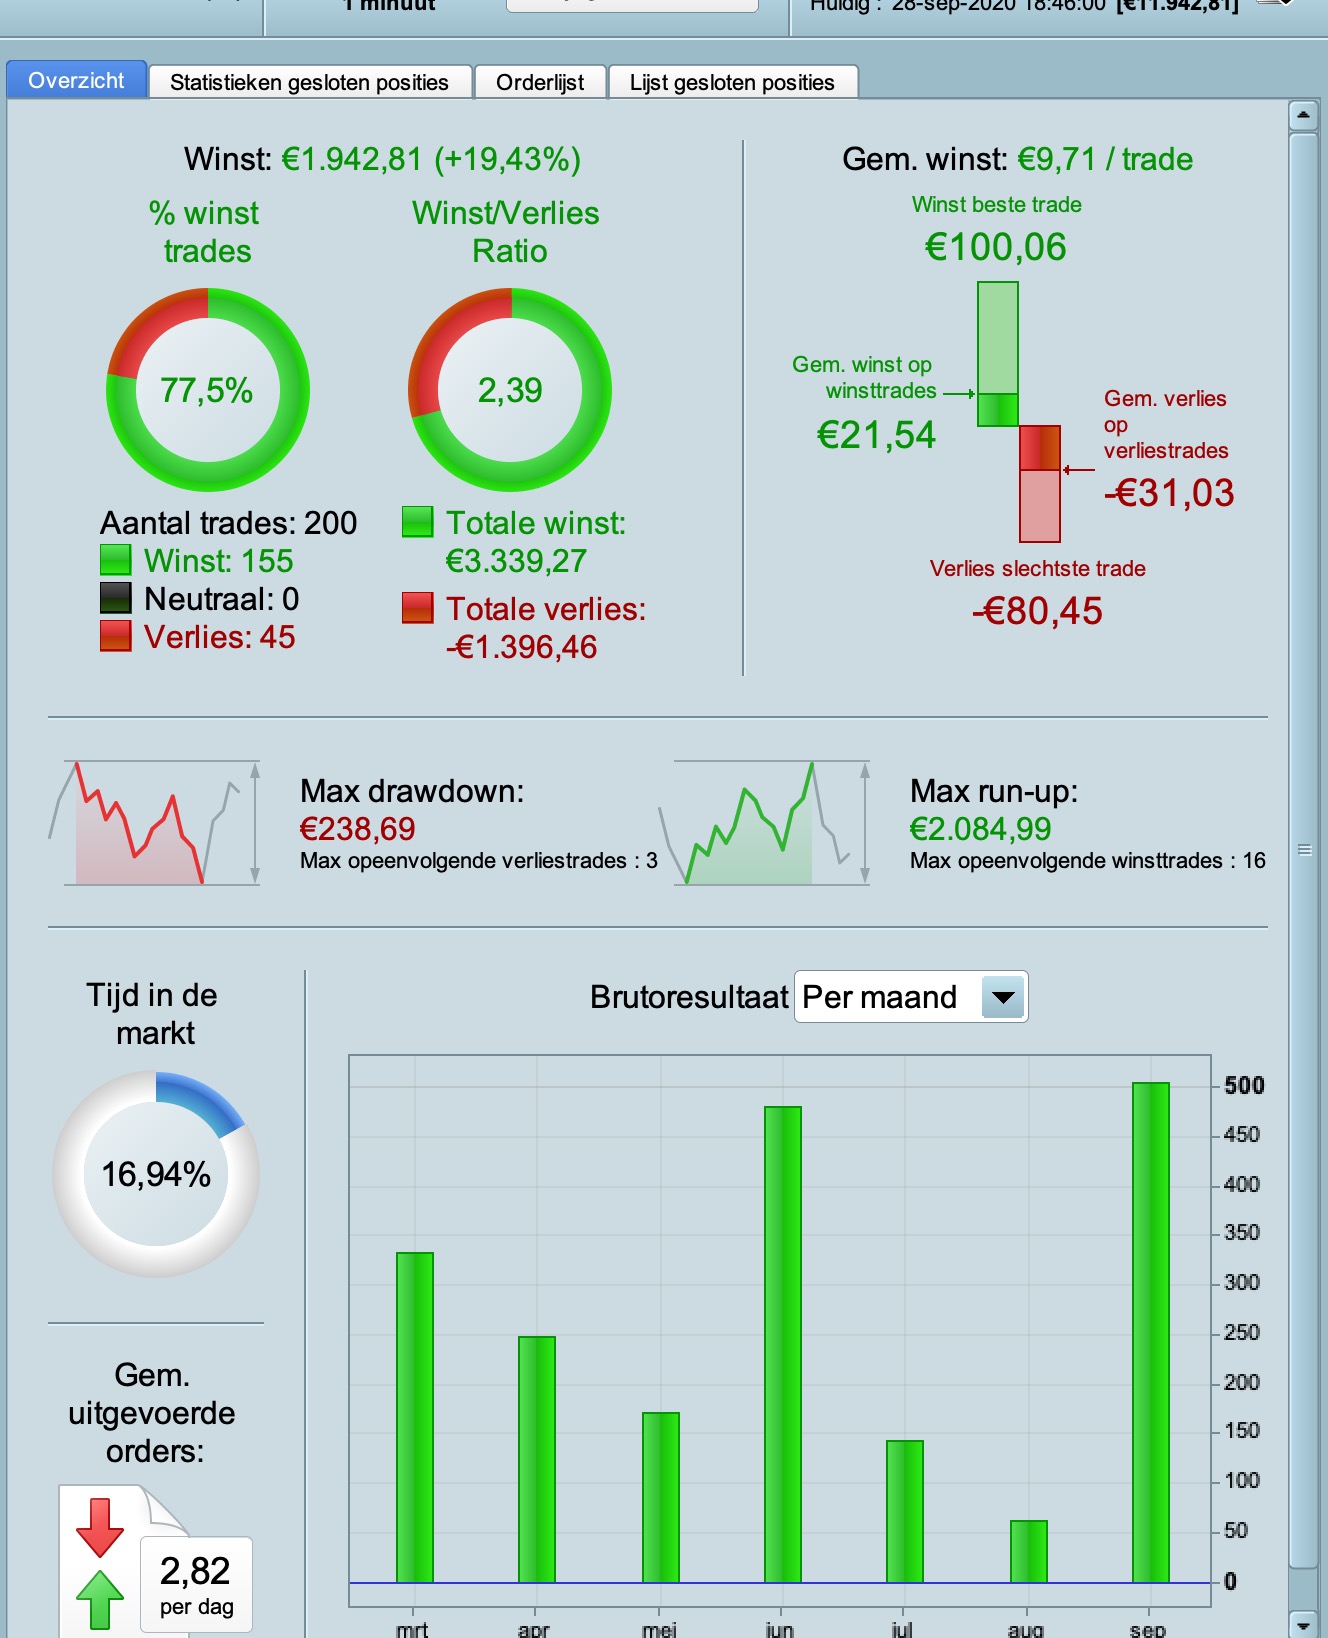
I gave a test, very similar equity curve with 100k, but less lost in this last period…why you are not convinced of atm?
PaulParticipant
Master
Because of the results of previous post. It’s not a run & win code, even the equitycurve looks like it. However it’s picking up.
Also for those interested. Have a look at 1 minute, this while not using rsi stochastics.
I have not this results with 1 minute timeframe, which version did you use?
PaulParticipant
Master
there are always changes, but the settings I used on 1 m
//
once periodea      = 60  //60
once nbchandeliera = 30 //30
once periodeb      = 60 //60
once nbchandelierb = 75 //75

once test1=3
//long
if test1=1 then
value1a=close
value2a=close

elsif test1=2 then
value1a=high
value2a=low

elsif test1=3 then
value1a=low
value2a=high

elsif test1=4 then
value1a=totalprice
value2a=totalprice
elsif test1=5 then
value1a=typicalprice
value2a=typicalprice
endif

mma = exponentialaverage[periodea](value1a)
adjasuroppo = (mma-mma[nbchandeliera]*pipsize) / nbchandeliera
angle = (atan(adjasuroppo))

mmb = exponentialaverage[periodeb](value2a)
pente = (mmb-mmb[nbchandelierb]*pipsize) / nbchandelierb
trigger = exponentialaverage[periodeb](pente)

cb1 = angle >= 40
cs1 = angle <= -40

cb2 = (pente crosses over  trigger) and (pente >-2 and pente < 4)
cs2 = (pente crosses under trigger) and (pente >-4 and pente < 2)
Hi Paul, I tried the code but I have a little bit different results, is it possible to have the complete code or .itf for testing?
Thank you very much.
PaulParticipant
Master
Hi, I’ve no more updates or releases planned on this strategy.
Ok, Just the modified version for 1 minute timeframe if possible, thanks.
Hello everyone!
First I’d like to thank you for sharing this code that I would like to implement/inspire!
My code “DJ 3m Vectorial V3” was running perfectly and stopped trading on the 16th of september but still online. I copy and paste it in a new proorder and it runs perfect again… The first code is still online but does not trade and the copied one is taking some position, as it should.
As someone any ideas of what it could come from?
Thanks 😀
Hi, below the strategy with new function by Paul. Many Thanks
strategy with new function by Paul
Please do you know if the above .itf is set up for UTC +2 (as Paul is UTC+2?)
Massive Thank You to Paul, Nonetheless and Balmora74 for the evolution of this excellent strategy!
Yes I would say UTC+2 since it can close trades fridays at 2200 and that is the same time zone as mine.
A big thanks to all of You for sharing codes. It’s really inspiring as a beginner
Cheers
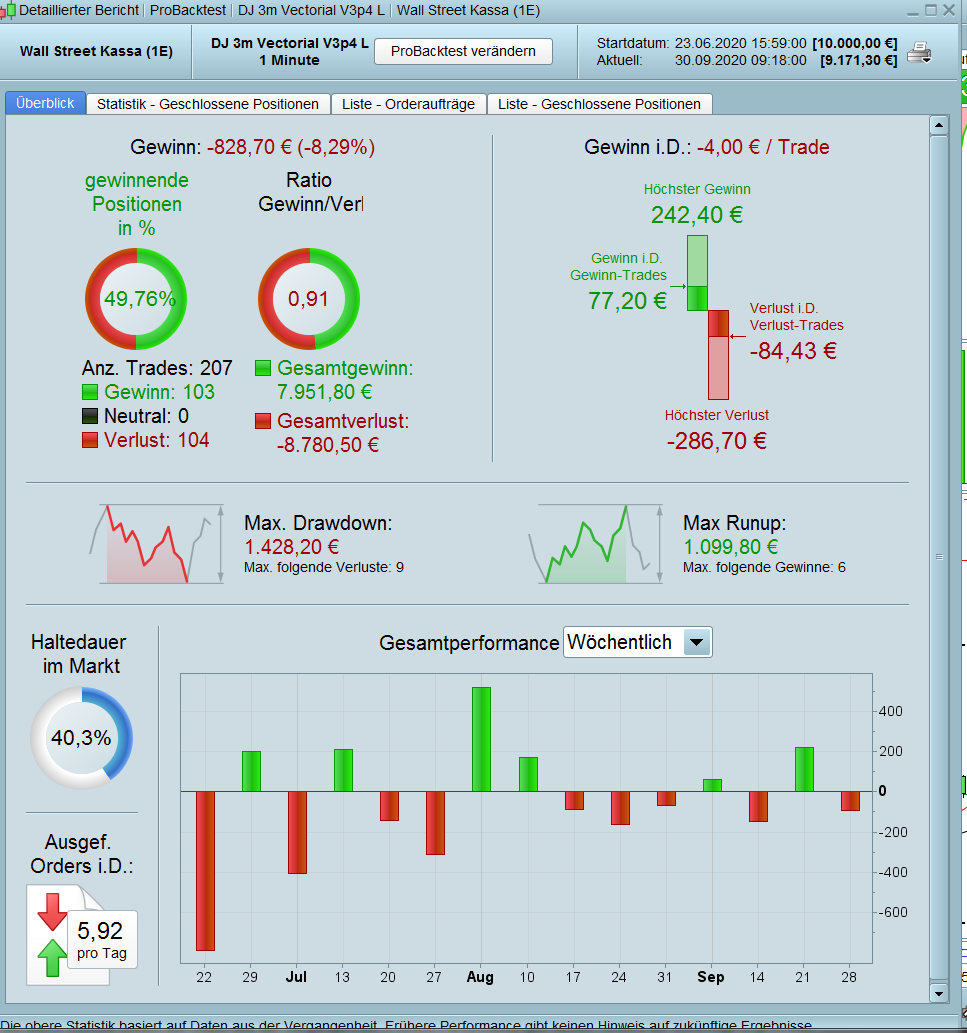
Well, my results with the 1m-strategy are completly different.
@VinzentVega you show an Algo title containing 3m / 3 Min, but you backtested at 1 min TF.