V12 for PRT-IG now live on Live

Viewing 15 posts - 1 through 15 (of 98 total)
  • Author
    Posts
  • #224647 quote
    PeterSt
    Participant
    Master

    At least for me, that is.

    This topic could be for working out anomalies or maybe small warnings.

    Of this latter I have a first :
    When we start V12 for the first time, for PRT-IB it was so that you were warned that your settings could be transferred once only. Thus, save things in the V12 environment and then go back to V11 because there’s something you don’t like, is a no-go; it would lead to further losing your changed settings (new charts etc.) which you’d subsequently make in V11. Remedy :
    Don’t save anything in V12 if you think of reverting to V11. In V11 you can then do again what you want.

    but

    It is slightly more complicated, because the transfer of settings still happens only once. Thus, they occur when going to V12 for the first time (like I just did), but they won’t happen a next time.
    At least this has been so for the IB environment, and since I just this morning asked to arrange for this one time again for IB (I had to revert more than once), please take notice that this will be a hassle (already because I’d say you need PRT for this, while most have a contract with IG. Well, the story is known – it is hard to get PRT support for those people).

    The above summarized : the warning signs in capitals for this lack.

    manel thanked this post
    #224651 quote
    PeterSt
    Participant
    Master

    Before deciding to stay in V12, people must be very cautious to observe the memory usage; For V12 in the IB environment this has been a serious issue since the start, only last week solved. But solved because I think so (have been working on this throughout with PRT), so, FWIW.

    and

    The first chart with a small-ish indicator already took over 5 minutes to load, which normally takes a few seconds only. So, this does not look good.

    On a side note : only this morning I told PRT that the memory issue could theoretically have been be solved, and that my “large” account could be retried for V12. That did not happen yet.

    All ‘n all I wonder whether this whole situation of being able to start V12 isn’t an accident, possibly caused by the HTTP 500 error.

    manel thanked this post
    #224653 quote
    manel
    Participant
    Veteran

    Thanks for the heads up. I just logged into the IG  platform today and it put me through to the PRTv12 but quite a few problems.
    1) Although the workspace has been saved, the desktop monitor layout has not. All my windows placements etc are all over the place. Completely jumbled.

    2) The fonts, chart sizes etc etc are all incorrect and much larger. I can’t get them back to my original sizes by doing a platform font decrease.

    This going to take me ages to resize, re-layout my desktop….. Does anyone have a solution to this ?

    Hard to believe that PRT would roll out an upgrade without adequately doing some basic testing (I hope !) so I’m thinking there must be an easier way to get my previous layout and settings back on PRT v12

    Cheers.

    PS – when I logged into PRT today I got no warning about settings changes being only saved once etc

    #224654 quote
    PeterSt
    Participant
    Master

    All ‘n all I wonder whether this whole situation of being able to start V12 isn’t an accident, possibly caused by the HTTP 500 error.

    No it is not (I now asked). It is all on purpose and V12 is officially there for PRT-IG.
    On the question “what should people do when they run into problems because they can’t call you” the answer is “yea, you are correct, but for you this does not count because you have a contract with us (PRT/IB).

    Well, have fun ?
    Heads up, I’d say. For V12 and PRT-IG I now see there’s at least one important issue solved, which you see below; the Z-order of hovered labels now overlays correctly. And all ‘n all I really like V12 for the better. And hopefully the memory(-leak) issues are solved indeed.

    image_2023-11-30_152037416.png image_2023-11-30_152037416.png
    #224656 quote
    PeterSt
    Participant
    Master

    So, did anyone ever test this ?!?

    The orders (positions) already in prior to starting V12 disappeared (exited) as should. But new orders don’t appear !
    In the 1st attachment you see that according to the mouse hover 1 Short position should be there, and according to the 2nd attachment you can see that 2 are there in reality. So this is two bugs in one go.

    image_2023-11-30_155339389.png image_2023-11-30_155339389.png image_2023-11-30_155553186.png image_2023-11-30_155553186.png
    #224659 quote
    PeterSt
    Participant
    Master

    So restarting implies that the two orders/positions show up again, but now all the OLD closed orders do not show. Compare with the 2nd screenshot which I took from the previous post, where you can 3 other closed positions (in reality there were 10+ in this time period).

    image_2023-11-30_161154105.png image_2023-11-30_161154105.png image_2023-11-30_161030838.png image_2023-11-30_161030838.png
    #224662 quote
    PeterSt
    Participant
    Master

    Worse is : when I started V12 the first time, loading took maybe 45 seconds which was under low volatile conditions. I now started V12 with the USA st0ck market open, and loading took well over 5 minutes.
    I also see the same memory behavior which has always been wont in V12-IB (now using 6GB after 10 minutes of operation) which should be 3-4 and which will end up in “death”.

    All these exhibits, thus also the not showing of old orders and the not showing up of new ones, have been in order for V12-IB and were solved.
    I now start to think that all this time the IG version has not been updated and that all the ever back IB issues are still there in the IG version.

    So much for the heads up.

    #224666 quote
    manel
    Participant
    Veteran

    I think its pretty clear that this version of PRT has not been tested adequately. Has it even been tested by any IG account users prior to release ? The most basic stuff is not working properly, in my opinion.

    The lack of response from PRT on these issues is also very disappointing.

    As a client of 10-20yrs of both its not great I must say.

    It is what it is I guess, we just have to put up with the poor service – or leave. Just as well more brokers are entering the UK market now to shake up this space, Its what’s needed.

    #224667 quote
    manel
    Participant
    Veteran

    I managed to revert to using V11 again and it had saved my original layout. Thank goodness !!
    Will be staying clear of V12, not using it again.

    I can confirm the memory usage issue in v12. Insane usage. If its maxing out 16GB of RAM then something is seriously going wrong somewhere ! 😂

    PeterSt thanked this post
    #224670 quote
    GraHal
    Participant
    Master

    My v12 Live is using 1.1GB … see attached.

    RAM usage is related to how many charts we have open.

    Screenshot-2023-11-30-171553.png Screenshot-2023-11-30-171553.png
    #224674 quote
    inverse
    Participant
    New


    11Gb here Gra but you are right it’s a headcount thing for sure.

    Messed with my Time of Sales coloring a bit, so needs massaging there.

    I have a heap of custom indicators based on where sessions open and close and it’s here that it will go very hard and go ahead and ‘calculate’ all of them, irrespective of whether they are active / enabled or not (v11 doesn’t do this or appears not to). Not tried removing them and adding again but as a vanilla start of v12 from a previous v11 yesterday that is what stood out most.

    I’ve also not been able to work out how to remove ‘main chart study’ I think it’s called from the LHS toolbar on a chart. Also prefered having the ‘indicator and systems’ button along the bottom, could be an option buried somewhere – I’ve bailed on looking further at v12 for now because it also irked me in not saving toolbar content – I only use 8 or so tools very basic but I like them to stay put once in position on a toolbar.

    Some thing I have wondered for a little while now is it possible or a wip to be able to ‘group’ select drawings and move them to the RHS a little?


    Hope this makes sense, Flu A and D3 here with all 4 wisdom teeth out the other day – fun times ….


    Cheers,

    inv

    #224675 quote
    inverse
    Participant
    New

    Okay. So between v11 and v12 (IG) there’s general instability where I run out of mem (have 32GB) and reported use can be anywhere between 9-11GB. If I close windows (charts) we just come round on ourselves with similar responses and also complaints re: indicator calculation problems – last time we saw this was EU daylight savings. Going back to v11 again for now. Thinking about it the indicator calc problem could be a byproduct of where we are with v12 on this PC, so a furphy or sorts.


    Following flagged in the error mssg:

    31 chart windows

    620 indicators

    70 values in lists


    There’s 32GB in the PC why only allocate 10GB use 8.8Gb and then moan about it. There’s a bit of inefficiency going on here and could be windows (10) or me lol. Not a platform expert so apologies if overlooking things. When running v11 will happily run +10GB at times and never a peep.

    I can push it over on v11 but don’t have enough eyeballs to realistically use the IP presented to me.

    Last I saw anything similar was on a PC w/16GB. Very leaky, somewhere.

    Might be time for a cache clean and 3 finger salute.

    I managed to revert to using V11 again and it had saved my original layout. Thank goodness !! Will be staying clear of V12, not using it again.

    The term barge pole comes to mind.

    I didn’t have your problems though, could be that I left some settings as default, can’t remember now and so wasn’t as evident.

    What you and what PeterSt said rings true though, in particular the ‘first start’ and other’s there after, it’s as if there’s a bit of ‘house-keeping’ going on and borks it.

    cheers,

    inv

    manel thanked this post
    #224676 quote
    inverse
    Participant
    New

    Went full cache clean (java too) and restarted w10.

    DAX is a few mins off the open and EU proper. See how it rolls.

    When operational (in a good way) should balloon ram usage a little then unwind.

    On v12 now but I don’t do anything sophisticated, so perhaps not a great comparison for those on the bleeding edge.

    Is there any way to remove ‘Main chart study’ button – it is useful but hidding / removing it would be cool too.


    (no errors so far)


    cheers

    inv


    At 11GB now.

    GraHal thanked this post
    #224683 quote
    inverse
    Participant
    New

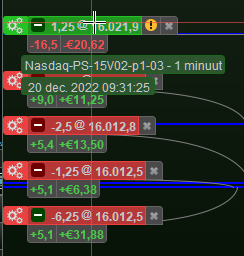
    Rolled through futures open, then cash – all ok. Then went RS shortly there after. Joy.

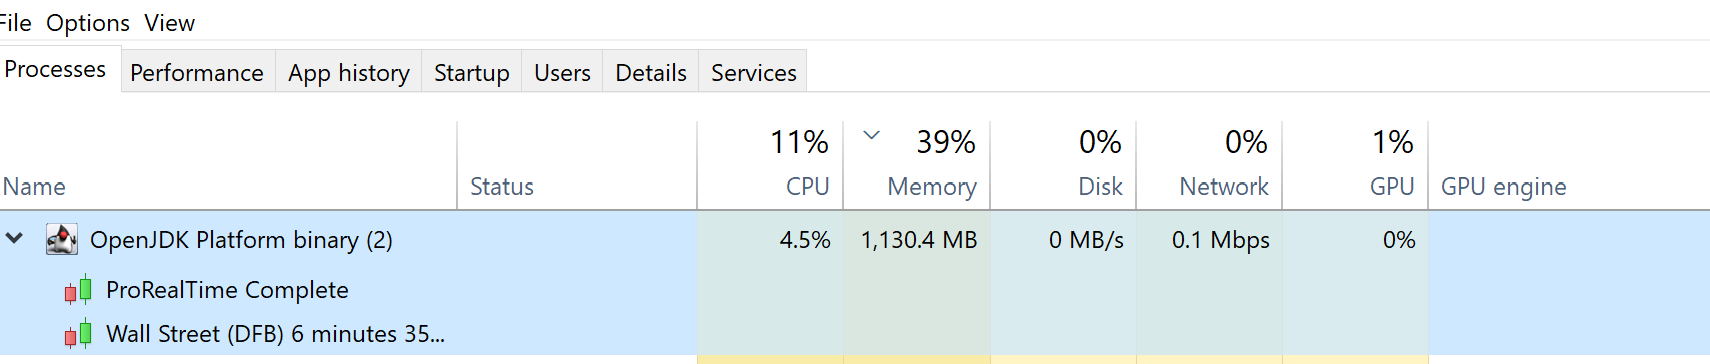
    Once errors trigger (either ram alone and / or indicator combined), the platform never really recovers and drives the CPU to 90% at times while ram util remains at ~11GB. We then enter a continued error cycle state that plays out intermittently – no mouse activity nothing.

    It’s almost as if it’s running inactive indicators, for reasons x and then failing – a condition first seen (running / calculating the indicator) when ‘migrating’ across from 11 to 12  and upon initially starting v12, perhaps an associated root cause – no idea tbh. We also see running / calculating ‘inactive’ indicators when switching templates but not always. V11 doesn’t have the problem.

    Atmo loathed to pull all indicators and re-apply.


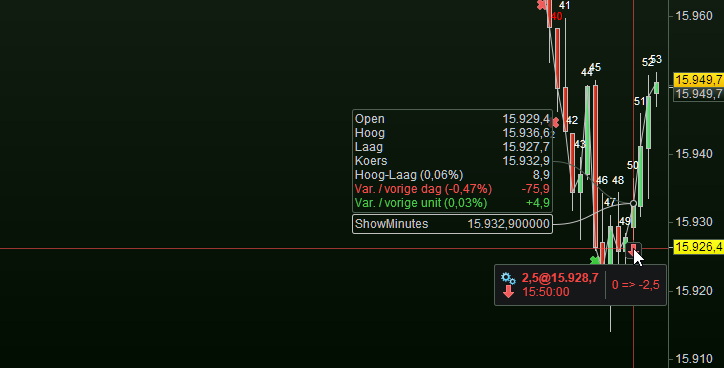
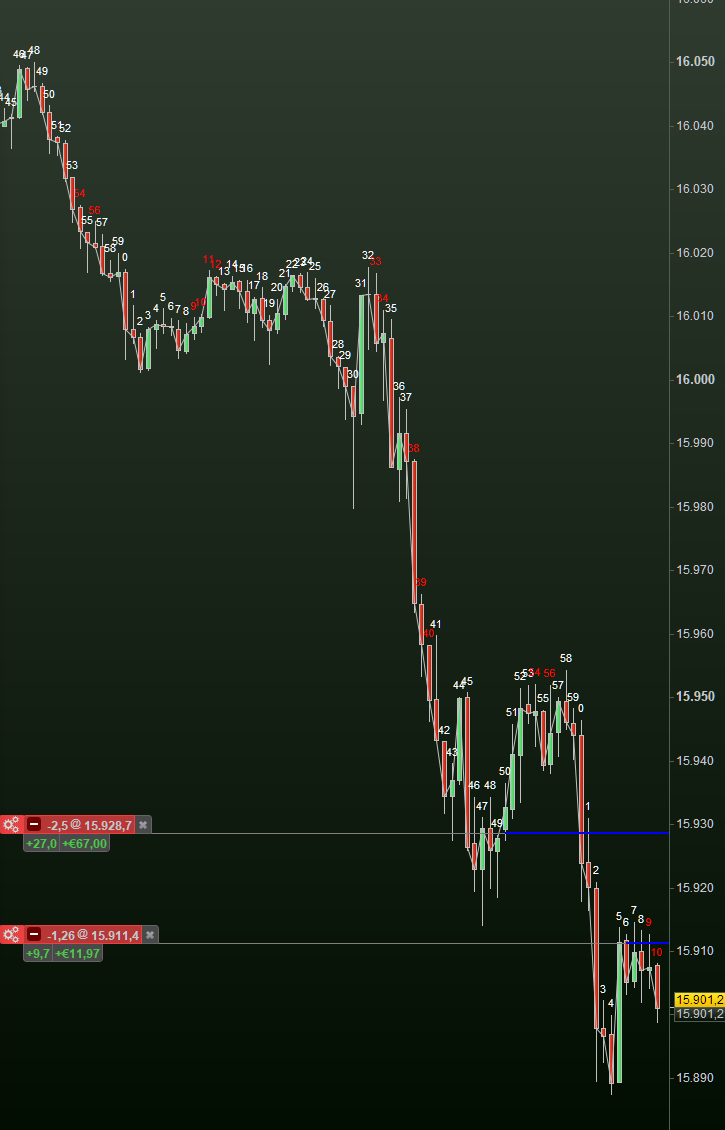
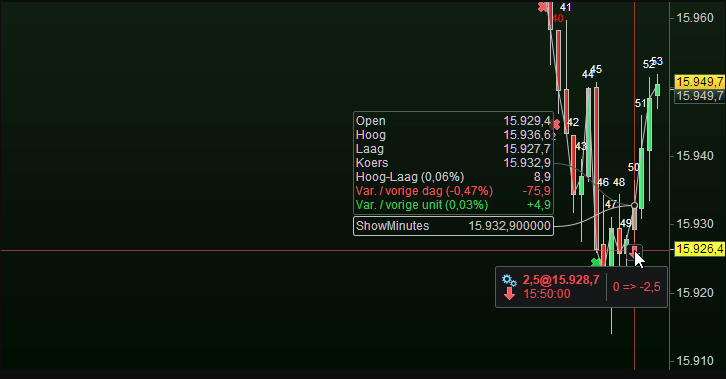
    Attached is a copy of an indicator that draws lines for various opening times. This indicator is inactive but upon the platform starting will be ‘calculated’ out as data is loaded for that chart, again v11 doesn’t seem to do this or I’ve not been able to see it occurring.

    Don’t seem to be able to load png with error mssgs atmo 🙁

    Cheers,

    inv

    defparam drawonlastbaronly=true
    
    defparam calculateonlastbars=100
    //
    //
    //
    //Label offsets
    //
    //
    voffset=50+close
    voffset1=70+close
    voffset2=100+close
    voffset3=120+close
    //
    //
    //
    //
    Time1        = 010000
    Time2        = 011000
    Time2a        = 070000
    Time3        = 080000
    Time4        = 090000
    Time5        = 100000
    //
    //
    //Label Time
    //
    //
    //
    //
    //
    //Time8        = 070000
    Time6        = 081500
    Time7        = 081500
    Time8        = 083000
    Time9        = 091500
    Time10       = 091500
    Time11       = 101500
    //
    //
    NumberOfDays = 1
    Time1          = max(0,min(235959,Time1))
    Time2          = max(0,min(235959,Time2))
    Time2a          = max(0,min(235959,Time2a))
    Time3          = max(0,min(235959,Time3))
    Time4          = max(0,min(235959,Time4))
    Time5          = max(0,min(235959,Time5))
    //
    Time6          = max(0,min(235959,Time6))
    Time7         = max(0,min(235959,Time7))
    Time8         = max(0,min(235959,Time8))
    Time9         = max(0,min(235959,Time9))
    Time10         = max(0,min(235959,Time10))
    Time11         = max(0,min(235959,Time11))
    //
    NumberOfDays   = max(0,min(999,NumberOfDays))
    MyDD           = Day
    MyMM           = Month
    MyYY           = Year
    //
    DayCount       = NumberOfDays
    While DayCount > 0 DO
    //
    // make sure it’s the same number of digits for days < 10
    //If MyDD < 10 Then  //was 10 but needed to go to 0
    //
    If MyDD < 00 Then
    MyDate = (MyYY * 10000) + (MyMM * 1000) + MyDD
    Else
    MyDate = (MyYY * 10000) + (MyMM * 100) + MyDD
    Endif
    // last step, add hours
    a = (MyDate * 1000000) + Time1
    b = (MyDate * 1000000) + Time2
    ba = (MyDate * 1000000) + Time2a
    c = (MyDate * 1000000) + Time3
    d = (MyDate * 1000000) + Time4
    e = (MyDate * 1000000) + Time5
    //
    // plot the lines
    //
    drawvline(datetobarindex(a))Coloured  (105,105,105)style(dottedline,1)
    drawvline(datetobarindex(b))Coloured  (105,105,105)style(dottedline,1)
    //
    //NO AU DS AU-CL
    //drawvline(datetobarindex(ba))Coloured  (105,105,105)style(dottedline,1)
    drawvline(datetobarindex(c))Coloured  (105,105,105)style(dottedline,1)
    drawvline(datetobarindex(d))Coloured  (105,105,105)style(dottedline,1)
    drawvline(datetobarindex(e))Coloured  (105,105,105)style(dottedline,1)
    //
    //
    //
    // draw the lables in
    //
    //
    x = (MyDate * 1000000) + Time6
    i = (MyDate * 1000000) + Time7
    j = (MyDate * 1000000) + Time2a
    k = (MyDate * 1000000) + Time9
    l = (MyDate * 1000000) + Time10
    m = (MyDate * 1000000) + Time11
    //
    //
    //
    //drawtext("FDAX",datetobarindex(x),voffset,SansSerif,standard,14)Coloured (000,100,000)
    //drawtext("FTEU",datetobarindex(i),voffset1,SansSerif,standard,14)Coloured (000,100,000)
    //drawtext("AU-CL",datetobarindex(i),voffset3,SansSerif,standard,14)Coloured (000,100,000)
    //drawtext("JP-CL",datetobarindex(i),voffset2,SansSerif,standard,14)Coloured (000,100,000)
    //drawtext("FSX",datetobarindex(k),voffset,SansSerif,standard,14)Coloured (000,100,000)
    //drawtext("FT100",datetobarindex(l),voffset1,SansSerif,standard,14)Coloured (000,100,000)
    //drawtext("FTSE",datetobarindex(m),voffset,SansSerif,standard,14)Coloured (000,100,000)
    //drawtext("HK-CL",datetobarindex(m),voffset2,SansSerif,standard,14)Coloured (000,100,000)
    //
    //
    //
    
    // get ready to build tomorrow’s date, if needed
    //
    // compute tomorrow’s date (could be a new month, even a new year)
    //
    // 1. compute the last day of the month
    LastDay = 31
    // 2. it’s max 30 on a few months
    If MyMM = 4 or MyMM = 6 or MyMM = 9 or MyMM = 11 Then
    LastDay = 30
    Endif
    // 3. it’s max 28 days in February, 29 on a leap year
    If MyMM = 2 Then
    LastDay = 28
    If Year MOD 4 = 0 Then
    If Year MOD 100 = 0 Then
    If Year MOD 400 = 0 Then
    LastDay = 29
    Endif
    Else
    LastDay = 29
    Endif
    Endif
    Endif
    //
    MyDD = MyDD + 1
    // 4. if it’s greater than LastDay it’s the next month
    If MyDD > LastDay Then
    MyDD = 1
    MyMM = MyMM + 1
    // 5. if it’s greater than 12 it’s a new year
    If MyMM > 12 Then
    MyMM = MyMM - 12
    MyYY = MyYY + 1
    Endif
    Endif
    //
    DayCount = DayCount - 1     //one day has been plotted
    Wend
    RETURN
    
    #224684 quote
    GraHal
    Participant
    Master

    You need to contact PRT directly if you want a fix or at least so they know about your problem.

    Send a Technical Report off the PRT Platform main menu > Help > Help Center > I’m having a Technical Problem.

    inverse thanked this post
Viewing 15 posts - 1 through 15 (of 98 total)
  • You must be logged in to reply to this topic.

V12 for PRT-IG now live on Live


Platform Support: Charts, Data & Broker Setup

New Reply
Author
author-avatar
PeterSt @peterst Participant
Summary

This topic contains 97 replies,
has 9 voices, and was last updated by PeterSt
2 years ago.

Topic Details
Forum: Platform Support: Charts, Data & Broker Setup
Language: English
Started: 11/30/2023
Status: Active
Attachments: 35 files
Logo Logo
Loading...