If the problem is with RAM, you should increase the RAM dedicated to Java on your PC. The first thing is to see if this is the problem, through the help center.
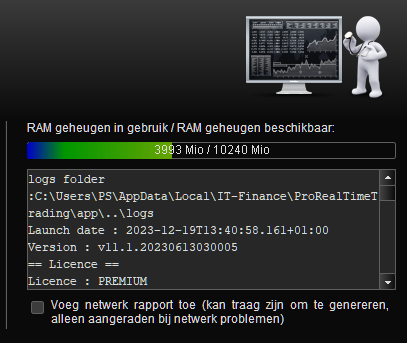
You give help/help center/I’m having technical problems/others…In the square on the right you will see “max memory”, which is the ram memory dedicated to java and “memory detected” which is the ram memory that your pc has . If you have memory problems and the program crashes, you should increase the memory (max memory) to what your PC allows (memory detected), leaving some for other things. My PC has 16 GB RAM and I have dedicated 12 GB (12000) to Java and the program works well for me. At the time I only had 6 GB dedicated and I also had problems, like you.
Thank you jesus. But that really does not help; once things start to go wrong, simply all the memory is eaten. Give it more and more will be eaten.
And to be honest, it is not really the memory issue any more – it is the slow operation, I think worse than it was a month ago. To me it feels that PRT/Java now get too few memory (it should increase when needed, but it doesn’t do that. Until a threshold is passed and then all collapses, including fast increase of memory usage).
But thanks !
It has worked for me, so far… “help/Help center/I have technical problems/other” and you can see the ram memory that is used, and you have to make sure you have a certain margin so that the program does not crash… luck
I have no solution for the slowness…fewer units…optimize the code…I used to use my own indicator that took me half an hour to load…and I stopped using it…
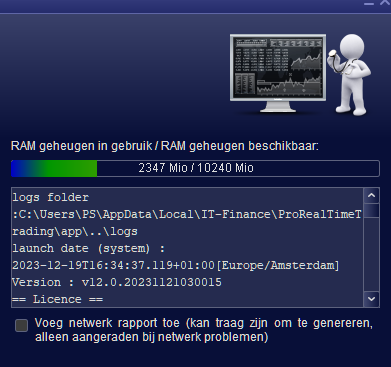
First is v11.1 (runs for 4 hours or so). Second is V12 (just started).
Total memory is 32GB.
with 32 ram you could dedicate more than 10240 to java, but it doesn’t seem like you use all the ram according to the image you post, the problem doesn’t seem to be the ram
Haha, that is what I was saying.
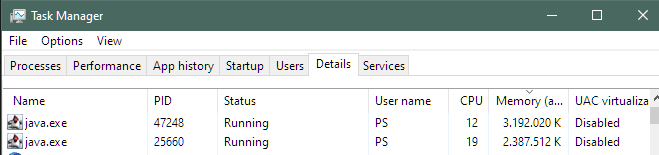
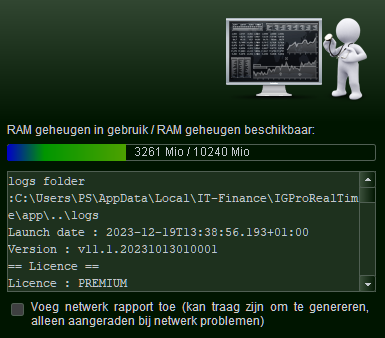
But FYI : 10GB is too much because I usually have 3x PRT running. The third you see below (V11.1 – also running for 4 hours or so). Because it is a general Java setting applied, and the 10GB is for testing V12, I can’t have 2x V12 running, because both may suddenly increase the memory usage and my PC will blow up. But then I can see it happening /coming, as I will always have Taskmanager open, ready to kill the one which causes havoc (which won’t respond any more, also not to crossing away).
Thanks for hitting the thread @jesus and @PeterSt.
It’s an interesting one for sure and as we’re all finding out, tied to doing how we do what we do!
I had 16gb of fast patriot memory 3800/cl14 (manual timings) and can’t remember what it sat at tbh, so went 32 and now 32 mightn’t be enough unless I go past the 10240 limit pre-canned? by PRT when you have 32gb.
I mentioned a page back why don’t PRT bump the ram amounts allocated (until you run into @PeterSt type of usage problems!).
@jesus your 6gb / 16gb is 37.5% of ram allocated / total available. 12GB double that!!!!
37.5% of 32gb = ~12gb, so I’d be maybe ok if PRT were baselining that way. I don’t run systems like @PeterSt does but an all you can eat setup is broken imo.
I’m giving the manual tweak a go today and TBH I really don’t like having to do this, feels like I’m back editing dos config.sys files again.
I’m not sure if this will work for me but if it does will look at seeing if it’s possible to go granular elsewhere again. Personally PRT should set the baselines but appreciate @jesus sharing there findings – cheers.
As a follow up I was in ‘orange-red’ zone in ram usage before and with 12gb set you can see where I’ll blow past 10gb on start and switching templates – not used to seeing +60% ram util on task manager, will see how it goes with all apps open.
v12 crashed x2 during this mornings APAC session. Reported 10gb of 12gb when erroring and while I was on a call with the same window open 10gb went to 11gb of 12gb. It did feel more responsive and tbh thought it could be a work around (glass half full).
Fell over again as typing this went ‘orange-red’ on usage, hit 11900 something.
Will add another 1024 or go 16gb…..
Had multiple crashes today.
Created another new template via save as of an existing env. that breaks.
Pulled most of the inactive indicators and reloaded PRT with 12gb as a test.
‘Resting ram’ sits at ~2-3gb now, winds up to ~5gb and releases back to same #.
I’ve been a little slack and really wanted to see how v11 to a v12 migration would role and didn’t housekeep anything at all, with removal of inactive indicators coming now (considering v12 was re-calculating those all the time and perhaps triggering my break as mentioned in an earlier post). I could as a next step re-write the indicator from new but it feels very different atmo. I wonder whether v11 manifested similarly, I think it might of but was far more resilient when inactive indicators were present, certainly nevr ‘echoed’ the recalc to scr.
We’re not far off the early EU open in APAC and this too was breaking what I had here, so should be a POC.
Pulling inactive indicators lowers the starting point, once noisier sessions get going and you wind up the tick count / lower the tf, ram will creep – even see 10gb again – no errors so far – however pushing to 10gb and perhaps past it feels a little uneasy.
Issue here is, I might have seasonal indicators that lay dormant and I only activate as needed (as on v11), if this is a ‘fix’ it’ll be cumbersome (removing unused at the time indicators) – unless I look at seasonal templates. Have not tried 16gb java allocation and would prefer defaults if possible but this might be another option.
‘Report a problem’ window shows logs as living in the following location.
logs folder
:C:\Users\x_x\AppData\Local\IT-Finance\IGProRealTime\app\..\logs
For me they live in the following.
C:\Users\x_x\AppData\Local\IT-Finance\IGProRealTime
Thought I could get a bit of ip from them. Just feedback onthread.
For the moment I see 3-10gb and it winding up and down between these numbers. No crashes.
@PeterSt I bet you have a few inactive indicators (maybe not) but then you’re also on Premium whereas I’m on Complete, not sure where you sit @jesus1975 on this?
Thanks for humoring me chaps … 🙂
Hi Inv,
I hardly have indicators so I can’t save on them either.
once noisier sessions get going and you wind up the tick count / lower the tf, ram will creep – even see 10gb again
It is exactly that. But I don’t lower timeframes or anything. It is just the data coming in. The more volatile, the worse it gets.
Further … Notice that things will collapse when the set memory limit om Java is superseded. Thus like in my case, it is given 10GB but while it can hang against that for a while, once that limit it passed, it will collapse. Death follows when on 14GB.
With the default 6GB it is no different, only that it will hang against 6GB then. Death when 9GB is reached. But be aware that this counts for V11.1 just the same.
The 10GB hugely helps me with backtesting because I may last with that the whole day (also with V12, if only no live data occurs (weekends). With the standard 6GB each couple of hours required a restart of PRT.
I glanced over the log data earlier on, but could not make much out of it (too few human readable data in there).
The Premium account may make it worse because it allows for more of everything. I think I utilize that only in my main account (but no idea actually), which is the “unworkable” one.
For others : a big difference could be the amount of backtesting data, because with Premium we tend to use 1M of bars. And this really makes a difference, especially when you’d load two instruments at the same time with 1M bars. But I know this and I don’t do that.
Currently I am not using V12 anywhere, because the Detailed Reports don’t show data with backtesting (solved already but not implemented – I don’t check this daily).
All right. I have been suggesting to PRT that it could be an interrupt thing. Not that I can see that, but it feels like that. The difference with me and the common other man or woman, could be that I am using a 10 core Xeon (not in hyperthreaded mode).
Now, the multi-threading of PRT is not the best that I have seen (but it could be complicated in there, so no complaints really), but there could be a lot of overhead going on with task switching. Hence, the more cores the worst this can get. This of course combined with the more required threads = charts etc., the worse it will get.
What processor do you have ?
Otherwise I am quite positive that I have seen more than once that when I do something “special” in the one account, the other one suddenly adds 3-4GB of memory (to its Java instance). As if they can influence each other (I mean at the Java level, not PRT).
And might it be interesting to someone, when the message “the last action you performed required more memory than available” occurs, the Java Garbage Collection is applied. This process alone causes havoc. By now I forgot how to wake that by external means, but it can be done and causes things to stall. And this is one of the advantages of the more memory given – the Garbage Collector does not jump in easily any more.
The GC of Java is not the GC of Windows and I am pretty sure that Java is just eating memory without using the Windows swap file. This is how the PC easily completely stalls when things go bad with PRT (= Java).
All as far as I could determine – not by means of inside info from ProRealTime people (sadly !!).
I think you have expertise I lack @PeterSt …..
You also have more cores than me too, running a 6c/12t AMD R5 3600 here.
At one point I did think the swap was involved because I could see the CPU/threads trigger and my quiet PC got a bit noisier but perfmon really didn’t expose too much at the time other than CPU and tbh (I know lazy), there’s only so much time in the day when the vols up for it to trigger and get busy and it’s a bit distracting (digging into system issues – excuses I know – but I know my limits too, I think).
The way I’m ‘reading’ mem being used (RAM available from w/in PRT) you could be right re: garbage collection and as soon as my inactive indicators where removed this 3-10gb flow was not quite sinusoidal but much much cleaner. With the inactive indicators there would on a regular occurrence be a ‘re-calculating’ event across charts (or single chart) for the inactive indicators ‘attached’ to the charts but disabled. I copied the indicator a page back and there’s variations of these that represent various open/close times (drawn VL and labels).
For some reason with with these ‘inactive’ indicators attached (but disabled) and process is triggered and it manifests in the way you also describe.
I’m curious but also seeking a fix lol, so if running a cut down template for now get’s it sorted I will live with it but v11 never saw this issue or I never caught it.
Right now I’m running the broken template and all is well with 12gb, which earlier in the day was crashing every few mins but we’ve entered a ‘quiet’ period before EU open a bit later.
Another thing is I can’t set 22:00 as a close time for intraday charts on DAX. What I mean here is, it doesn’t persist upon a restart after saving. Might have to see if it’ll save as another template.
I get there’s no doubt a little bit of operator error on my part but as a ‘normie’ I would have hoped that what I could to under v11 was easily done under v11 and perhaps it still is and I need new v12 based templates.
Again thanks for taking the time to respond.
inv