traduzione codice TW Median Proximity Percentile

Viewing 3 posts - 1 through 3 (of 3 total)
  • Author
    Posts
  • #237486 quote
    Msport71Msport71
    Participant
    Senior

    Buongiorno,


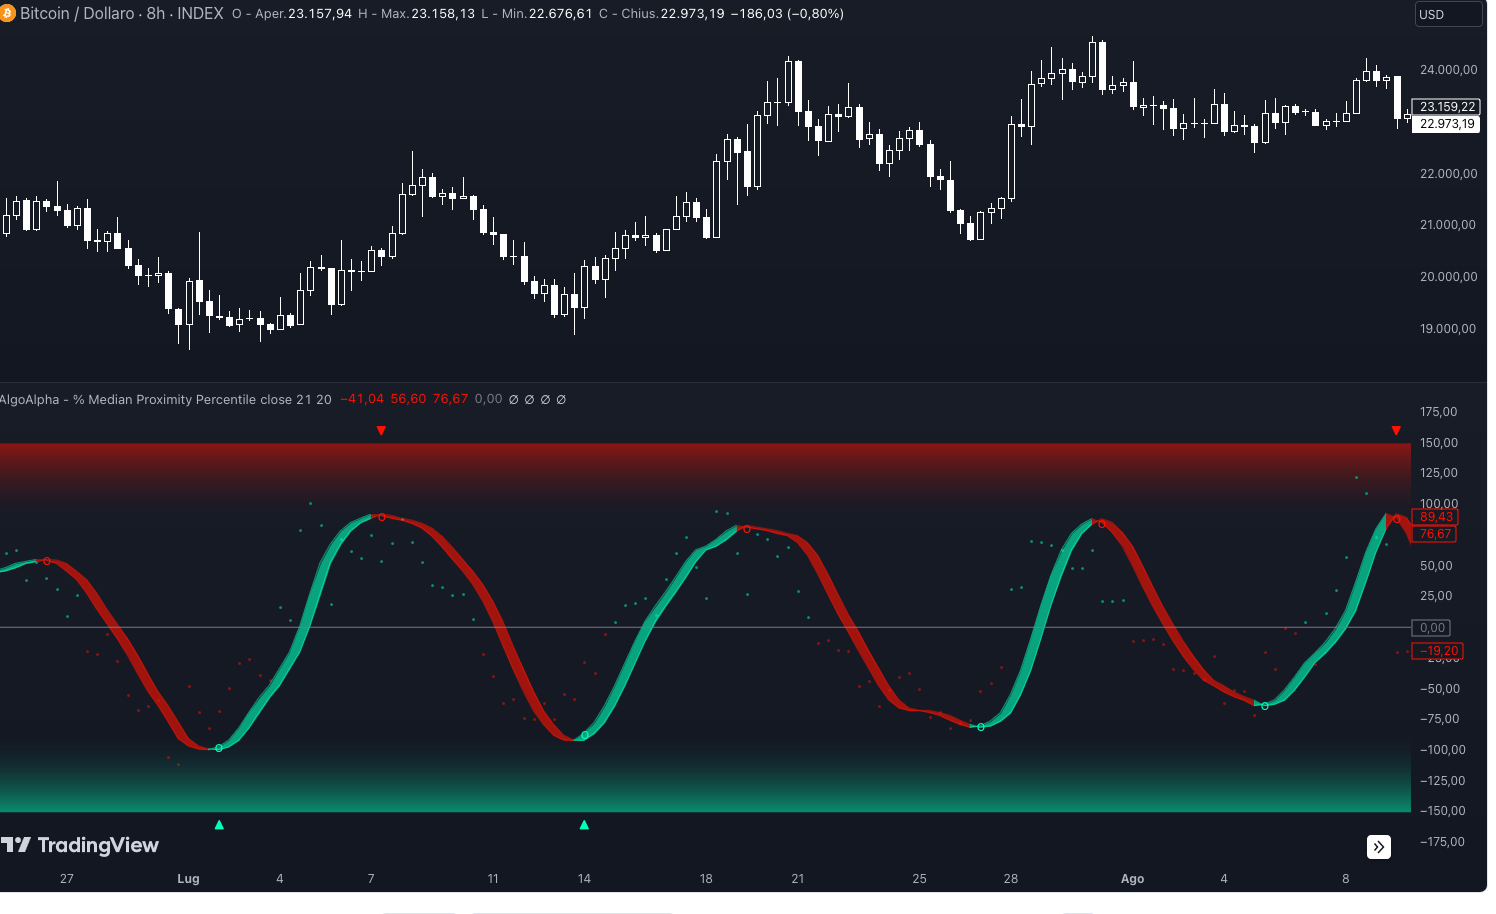
    vorrei chiedere cortese traduzione di questo codice, che sono curioso di testare.

    Grazie come sempre per l’aiuto.

    https://it.tradingview.com/script/YEu4VVBj-Median-Proximity-Percentile-AlgoAlpha/

    // This Pine Script™ code is subject to the terms of the Mozilla Public License 2.0 at https://mozilla.org/MPL/2.0/
    // © AlgoAlpha

    //@version=5
    indicator(“Median Proximity Percentile [AlgoAlpha]”, “AlgoAlpha – % Median Proximity Percentile”, overlay = false, timeframe = “”, timeframe_gaps = false)

    // Inputs
    priceSource = input.source(close, “Source”)
    lookbackLength = input.int(21, minval = 1, title = “Lookback Length”)
    emaLookbackLength = input.int(20, minval = 1, title = “HMA Lookback Length”)
    stdDevMultiplier = 1
    noise = input.bool(true, “Noise Scatterplot”)
    colorUp = input.color(#00ffbb, title = “Up Color”)
    colorDown = input.color(#ff1100, title = “Down Color”)

    // Calculations
    medianValue = ta.median(priceSource, lookbackLength)
    priceDeviation = (priceSource – medianValue)
    standardDeviation = ta.stdev(priceDeviation, 45)
    normalizedValue = priceDeviation / (standardDeviation + standardDeviation)

    positiveValues = normalizedValue > 0 ? normalizedValue : 0
    negativeValues = normalizedValue < 0 ? normalizedValue : 0

    upperBoundary = ta.ema(positiveValues, lookbackLength) + ta.stdev(positiveValues, lookbackLength) * stdDevMultiplier
    lowerBoundary = ta.ema(negativeValues, lookbackLength) – ta.stdev(negativeValues, lookbackLength) * stdDevMultiplier

    percentileValue = 100 * (normalizedValue – lowerBoundary)/(upperBoundary – lowerBoundary) – 50

    emaValue = ta.hma(percentileValue, emaLookbackLength)

    // Color Conditions
    plotColor = percentileValue > 0 ? colorUp :
    percentileValue < 0 ? colorDown : na

    // Plots
    plot(noise ? percentileValue : na, color = color.new(plotColor, 50), style = plot.style_circles)
    hmaPlot = plot(emaValue, color = color.new(emaValue > emaValue[1] ? colorUp : colorDown, 40), title = “Hull MA”)
    hmaPlot1 = plot(emaValue[1], color = color.new(emaValue > emaValue[1] ? colorUp : colorDown, 40))
    zeroLine = plot(0, color = color.gray, title = “Zero Line”)
    plotchar(ta.crossover(emaValue,emaValue[1]) ? emaValue : na, “Bullish Swing”, char = “o”, location = location.absolute, color = colorUp, size = size.tiny)
    plotchar(ta.crossover(emaValue[1],emaValue) ? emaValue : na, “Bearish Swing”, char = “o”, location = location.absolute, color = colorDown, size = size.tiny)
    plotchar(ta.crossunder(emaValue,emaValue[1]) and emaValue[1] > 90 ? 160 : na, “Bearish Reversal”, char = “▼”, location = location.absolute, color = colorDown, size = size.tiny)
    plotchar(ta.crossunder(emaValue[1],emaValue) and emaValue[1] < -90 ? -160 : na, “Bullish Reversal”, char = “▲”, location = location.absolute, color = colorUp, size = size.tiny)

    // Hidden Levels
    maxLevelPlot = plot(150, display = display.none)
    minLevelPlot = plot(-150, display = display.none)
    upperMidLevelPlot = plot(90, display = display.none)
    lowerMidLevelPlot = plot(-90, display = display.none)

    // Fills
    fill(maxLevelPlot, upperMidLevelPlot, top_value = 150, bottom_value = 90, top_color = color.new(colorDown, 50), bottom_color = color.new(chart.bg_color, 90))
    fill(minLevelPlot, lowerMidLevelPlot, top_value = -90, bottom_value = -150, top_color = color.new(chart.bg_color, 90), bottom_color = color.new(colorUp, 50))
    fill(hmaPlot, hmaPlot1, color.new(emaValue > emaValue[1] ? colorUp : colorDown, 40))

    // Alerts
    alertcondition(ta.crossover(emaValue, 0), “Bullish Trend Shift”, “Median Proximity Percentile Crossover Zero Line”)
    alertcondition(ta.crossunder(emaValue, 0), “Bearish Trend Shift”, “Median Proximity Percentile Crossunder Zero Line”)
    alertcondition(ta.crossover(emaValue,emaValue[1]), “Bullish Swing”, “Median Proximity Percentile Swinging Upwards”)
    alertcondition(ta.crossover(emaValue[1],emaValue), “Bearish Swing”, “Median Proximity Percentile Swinging Downwards”)
    alertcondition(ta.crossunder(emaValue,emaValue[1]) and emaValue[1] > 90, “Bearish Reversal”, “Median Proximity Percentile Bearish Reversal”)
    alertcondition(ta.crossunder(emaValue[1],emaValue) and emaValue[1] < -90, “Bullish Reversal”, “Median Proximity Percentile Bullish Reversal”)

    Screenshot-2024-09-11-at-11-47-37-Median-Proximity-Percentile-AlgoAlpha-—-Indicatore-di-AlgoAlpha-—-TradingView.png Screenshot-2024-09-11-at-11-47-37-Median-Proximity-Percentile-AlgoAlpha-—-Indicatore-di-AlgoAlpha-—-TradingView.png
    #237525 quote
    Iván GonzálezIván González
    Moderator
    Legend

    Eccolo qui:

    //-----------------------------------------------//
    //PRC_Median Proximity Percent
    //version = 0
    //12.09.2024
    //Iván González @ www.prorealcode.com
    //Sharing ProRealTime knowledge
    //-----------------------------------------------//
    //-----Inputs------------------------------------//
    //-----------------------------------------------//
    priceSource=close
    lookbacklength=21
    emalookbacklength=20
    stdDevMultiplier=1
    noise=1
    //-----------------------------------------------//
    //-----Calculations------------------------------//
    //-----------------------------------------------//
    //-Median Value
    FOR X = 0 TO lookbacklength-1
    M = close[X]
    SmallPart = 0
    LargePart = 0
    FOR Y = 0 TO lookbacklength-1
    IF close[Y] < M THEN
    SmallPart = SmallPart + 1
    ELSIF close[Y] > M THEN
    LargePart = LargePart + 1
    ENDIF
    IF LargePart = SmallPart AND Y = lookbacklength-1 THEN
    Medianvalue = M
    BREAK
    ENDIF
    NEXT
    NEXT
    //-Price Deviation
    pricedeviation=priceSource-medianvalue
    //-Standard Deviation
    standardDeviation=std[45](pricedeviation)
    //-Normalized Value
    normalizedValue=priceDeviation/(standardDeviation+standardDeviation)
    
    if normalizedValue>0 then
    positiveValues=normalizedValue
    negativeValues=0
    elsif normalizedValue<0 then
    positiveValues=0
    negativeValues=normalizedValue
    endif
    
    upperBoundary=average[lookbacklength,1](positiveValues)+std[lookbacklength](positiveValues)*stdDevMultiplier
    lowerBoundary=average[lookbacklength,1](negativeValues)-std[lookbacklength](negativeValues)*stdDevMultiplier
    
    percentileValue=100*(normalizedValue-lowerBoundary)/(upperBoundary-lowerBoundary)-50
    emaValue=HullAverage[emalookbacklength](percentileValue)
    //-----------------------------------------------//
    //-----------------------------------------------//
    //-----------------------------------------------//
    if percentileValue>0 then
    r1=0
    g1=255
    b1=187
    else
    r1=255
    g1=17
    b1=0
    endif
    
    if noise then
    percentile=percentileValue
    else
    percentile=undefined
    endif
    
    if emavalue>emavalue[1] then
    r02=0
    g02=255
    b02=187
    else
    r02=255
    g02=17
    b02=0
    endif
    
    maxLevelplot=150
    minlevelplot=-150
    upperMidlevelplot=90
    lowerMidlevelplot=-90
    
    colorbetween(maxLevelplot,upperMidlevelplot,255,17,0,50)
    colorbetween(minlevelplot,lowerMidlevelplot,0,255,187,50)
    colorbetween(emavalue,emavalue[1],r02,g02,b02,200)
    
    if emavalue crosses under emavalue[1] then
    drawpoint(barindex,0.5*(emavalue+emavalue[1]),3)coloured("red",100)
    elsif emavalue crosses over emavalue[1] then
    drawpoint(barindex,0.5*(emavalue+emavalue[1]),3)coloured("green",100)
    endif
    
    if emavalue crosses under emavalue[1] and emaValue[1]>90 then
    drawtext("▼",barindex,maxLevelplot)coloured("red",255)
    elsif emavalue crosses over emavalue[1] and emaValue[1]<-90 then
    drawtext("▲",barindex,minLevelplot)coloured("green",255)
    endif
    //-----------------------------------------------//
    //-----------------------------------------------//
    //-----------------------------------------------//
    return percentile as "Percentile" style(point)coloured(r1,g1,b1), 0 as "zero" coloured("grey"),emavalue as "Hull" style(line)coloured(r02,g02,b02),emavalue[1] as "Hull[1]" style(line)coloured(r02,g02,b02), maxLevelplot, minLevelplot
    
    Msport71 thanked this post
    #237529 quote
    Msport71Msport71
    Participant
    Senior

    Grazie e mille!!!

Viewing 3 posts - 1 through 3 (of 3 total)

  • You must be logged in to reply to this topic.

ProRealAI ProRealAI New

Stuck on this ProBuilder code?

Describe what this topic is trying to build, in plain English, and ProRealAI writes the ProRealTime™ indicator, screener or system for you.

Available in 7 languages
Try ProRealAI

traduzione codice TW Median Proximity Percentile


ProBuilder: Indicatori & Strumenti Personalizzati

New Reply
Author
author-avatar
Msport71 @carlo-pasca Participant
Summary

This topic contains 2 replies,
has 2 voices, and was last updated by Msport71Msport71
2 years ago.

Topic Details
Forum: ProBuilder: Indicatori & Strumenti Personalizzati
Language: Italian
Started: 09/11/2024
Status: Active
Attachments: 1 files
ProRealCode ProRealCode
Loading...