Buongiorno,
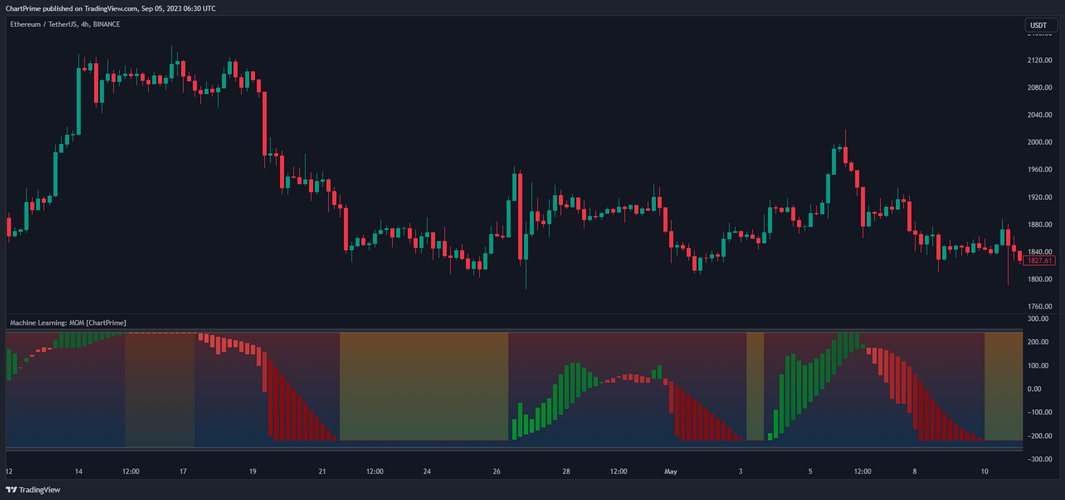
vorrei proporre traduzione di questo codice che sembra interessante, in quanto evidenzia molto chiaramente le fasi di stallo del mercato, potenzialmente
propedeutiche a successivi movimenti.
Grazie come sempre
https://www.tradingview.com/script/OCl780V6-Machine-Learning-Momentum-Oscillator-ChartPrime/
// This source code is subject to the terms of the Mozilla Public License 2.0 at https://mozilla.org/MPL/2.0/
// © ChartPrime
//@version=5
indicator(“Machine Learning Momentum Oscillator [ChartPrime]”,shorttitle = “Machine Learning Momentum Oscillator [ChartPrime]” , overlay=false)
string Core = “➞ ML Core Settings 🔸”
int ShortPriod = input.int (26, ‘Short Period’, 1,group=Core)
int LongPriod = input.int (14, ‘Long Period’, 2,group=Core)
int Smooth = input.int (13, ‘Smoothing Period’, 2,group=Core)
int Neighbours = math.floor(input.int (50,’Neighbours Count’, 5,group=Core))
bool showLines = input.bool(false,”Show prediction lines”)
float prediction = 0.0
float small = 0.0
float BIG = 0.0
int Class = 0
//——– {
type MachineLearning
array<float> D1
array<float> D2
array<float> D3
array<int> dir
array<int> Preds
array<float> PerD
type MLData
float Prime1
float Prime2
float Prime3
float prediction
float Smoothed
float Band
var ML = MachineLearning.new(
array.new_float(0),
array.new_float(0),
array.new_float(),
array.new_int(0),
array.new_int(0),
array.new_float()
)
MData = MLData.new()
method _Band(int len)=>
math.min (ta.atr (len) * 0.3, close * (0.3/100)) [20] /2
method RawData(int x,z) =>
WS = ta.ema(hlc3 – hlc3[1], x)
WQ = ta.ema(math.abs(hlc3 – hlc3[1]), x)
Out = ta.ema(WS, z)
Outs = ta.ema(WQ, z)
Z = 100 * (Out / Outs)
Z
MData.Prime1 := RawData(LongPriod,Smooth)
MData.Prime2 := RawData(ShortPriod,Smooth)
MData.Band := _Band(30) * 2.5
max = MData.Prime2 + MData.Band
min = MData.Prime2 – MData.Band
for i = 0 to math.max(LongPriod,ShortPriod,Neighbours)
Class := MData.Prime1[2] < MData.Prime1[0] ? -1 : MData.Prime1[2] > MData.Prime1[0] ? 1 : 0
ML.D1.push(MData.Prime1)
ML.D2.push(MData.Prime2)
ML.dir.push(Class)
// if Algo.dir.size() > 10000
// Algo.dir.shift()
// method MLCalculation(float x ,float y) =>
method MLCalculation(float x ,float y , float q , float z) =>
math.abs(x – y) + math.abs(q – z)
// math.sqrt(math.abs(x – y) * math.abs(q – z))
// math.abs(x – y))
// Nearest Neighbor Calculations
method Knn(MachineLearning MS) =>
float Minz = -1e-6
for i = 0 to MS.dir.size() – 1
MData.Prime3 := MLCalculation(MData.Prime1,MS.D1.get(i),MData.Prime2 ,MS.D2.get(i))
// MData.Prime3 := MLCalculation(MData.Prime1,ML.data.get(i))
if MData.Prime3 > Minz
Minz := MData.Prime3
if MS.Preds.size() >= Neighbours
MS.Preds.shift()
MS.Preds.push(MS.dir.get(i))
float(MS.Preds.sum() * 5 )
// break
MData.prediction := Knn(ML)
MData.Smoothed := ta.sma(MData.prediction,Smooth)
ML.PerD.push(MData.Smoothed)
// if ML.PerD.size() > 1000
// ML.PerD.shift()
small := ML.PerD.min()
BIG := ML.PerD.max()
Which = MData.prediction > 0 ? small:BIG
Greeny = color.from_gradient(MData.prediction,small,BIG,color.rgb(7, 187, 37), color.rgb(0, 107, 43))
Reddy = color.from_gradient(MData.prediction,small,BIG,color.rgb(153, 0, 0),color.rgb(255, 82, 82))
con = MData.prediction == MData.Smoothed ?
color.from_gradient(MData.prediction,small,BIG,color.rgb(164, 175, 10, 70), color.rgb(87, 61, 0, 70)): na
pred = plot(MData.prediction,color =color.new(color.black,100),style = plot.style_line,title = “ML”,editable = false)
SmoothP = plot(MData.Smoothed,color =color.new(color.black,100),style = plot.style_linebr,title = “Smoothed ML”,editable = false)
_Which = plot(Which,color = color.new(color.black,100),editable = false)
CONA = MData.prediction > MData.Smoothed ? Greeny:Reddy
topLine = plot(BIG,color = color.new(color.white, 78),title = “T-TOP”)
botLine = plot(small,color = color.new(color.white, 78),title = “T-BOT”)
Top = plot(BIG + 15 ,color = color.new(color.white, 78),title = “B-TOP”)
Bot = plot(small – 15,color = color.new(color.white, 78),title = “B-BOT”)
_Center = plot(showLines ? MData.Prime1: na,color = color.new(#efb906, 70),linewidth = 2,editable = false)
Center = plot(showLines ? MData.Prime2: na,color = color.new(#08d3ed, 70),linewidth = 2,editable = false)
alpha = color.new(color.black, 100)
TOP = plot(showLines ? max : na ,color = alpha,linewidth = 2,editable = false)
BOT = plot(showLines ? min: na ,color = alpha,linewidth = 2,editable = false)
plot(showLines ? MData.Prime1: na , “”, color.new(#efb906, 70), 2, editable = false)
plot(showLines ? MData.Prime1: na , “”, color.new(#efb906, 90), 4, editable = false)
plot(showLines ? MData.Prime2: na , “”, color.new(#08d3ed, 70), 2, editable = false)
plot(showLines ? MData.Prime2: na , “”, color.new(#08d3ed, 90), 4, editable = false)
fill(pred,_Which,color = con)
fill(topLine,Top,color = color.rgb(255, 255, 255, 91))
fill(botLine,Bot,color = color.rgb(255, 255, 255, 91))
fill(topLine, botLine, BIG, small, color.rgb(255, 82, 82, 75), color.rgb(33, 149, 243, 82))
plotcandle(MData.prediction,MData.prediction,MData.Smoothed,MData.Smoothed,color=color.new(CONA,20),bordercolor = color.new(CONA,10))
fill(TOP, Center, top_value = max, bottom_value = MData.Prime2, bottom_color = color.new(#08edda, 75), top_color = alpha, editable = true)
fill(Center, BOT, top_value = MData.Prime2, bottom_value = min, bottom_color = alpha, top_color = color.new(#08edda, 75), editable = true)
fill(TOP, _Center, top_value = max, bottom_value = MData.Prime1, bottom_color = color.new(#efb906, 75), top_color = alpha, editable = true)
fill(_Center, BOT, top_value = MData.Prime1, bottom_value = min, bottom_color = alpha, top_color = color.new(#efb906, 75), editable = true)