Hi Nicolas,
I tried to convert the tradingview code of “Time Segmented Volume with divergence with divergence” but, didn’t work as per trading view I need your support on this. Is it possible means please help me or provide ITF file thank you..
// Original TSV Indicator was written by liw0 active on https://www.tradingview.com/u/liw0 Updated/Enhancements by @StephXAGs with inspiration from @storma
// CREDITS: http://quant.stackexchange.com/questions/2816/how-to-calculate-time-segmented-volume and special thanks to mohanee for the base divergece hunter code
//@version=4
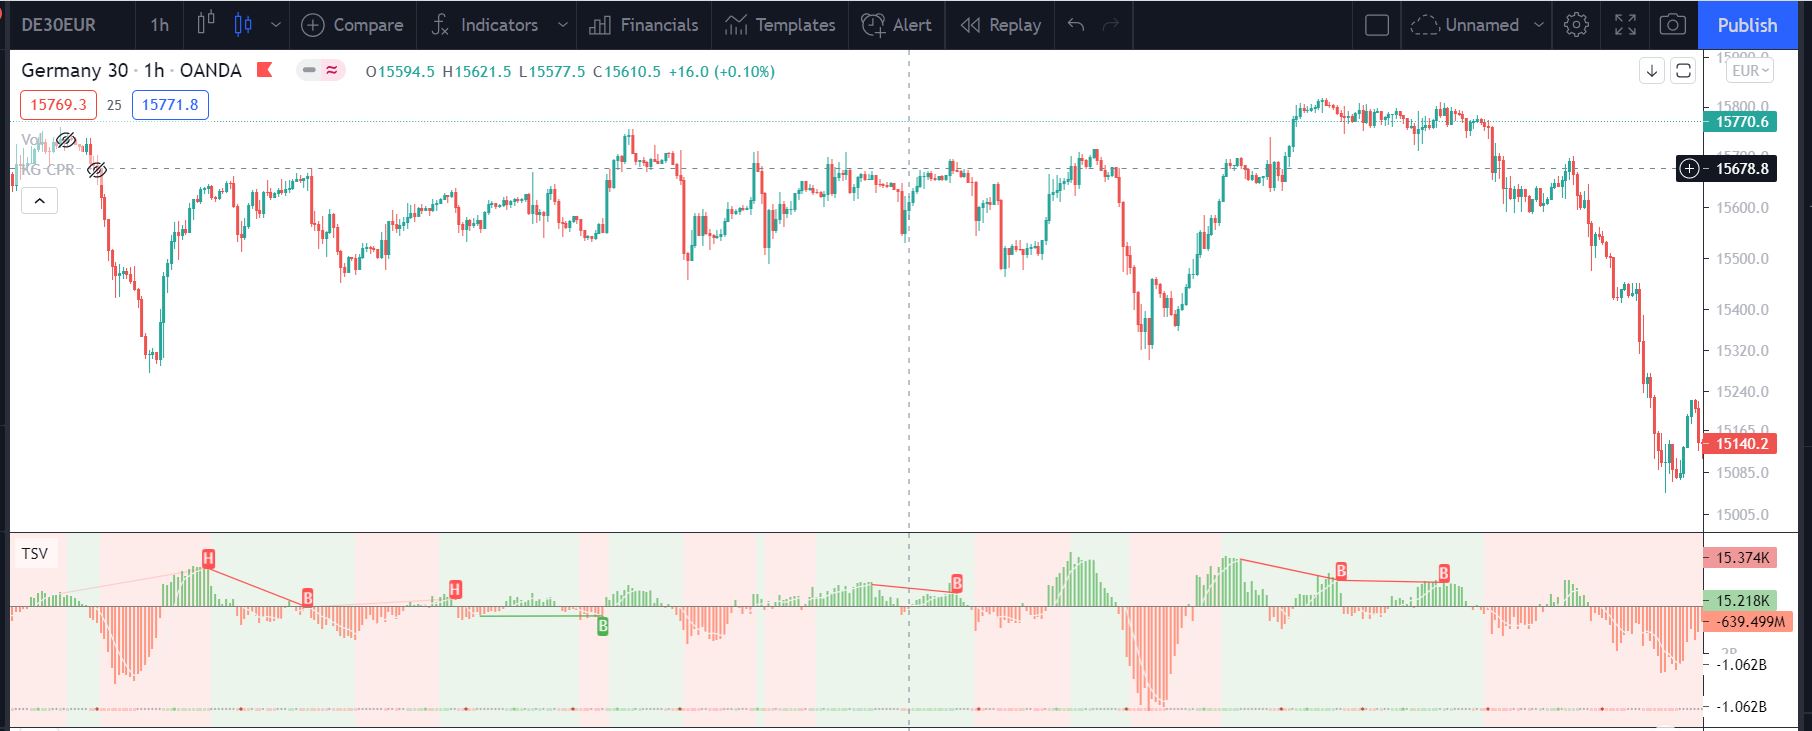
study(title=”Time Segmented Volume with divergence and Kumo cloud background”, shorttitle=”TSV”, format=format.volume, precision=0, resolution=””)
// Getting inputs
len = input(13, title=”TSV Length”)
smoothing = input(defval=”EMA”, options=[“RMA”, “SMA”, “EMA”, “WMA”, “VWMA”], title=”Moving Average”)
toast(rsi ,l_ma) =>
if smoothing == “RMA”
rma(rsi ,l_ma)
else
if smoothing == “SMA”
sma(rsi ,l_ma)
else
if smoothing == “EMA”
sma(rsi ,l_ma)
else
if smoothing == “WMA”
wma(rsi ,l_ma)
else
if smoothing == “VWMA”
vwma(rsi ,l_ma)
l_ma = input(3, title=”MA Length”)
src = input(close, “Source”, type = input.source)
up = rma(max(change(src), 0), len)
down = rma(-min(change(src), 0), len)
lbR = input(title=”Pivot Lookback Right”, defval=5)
lbL = input(title=”Pivot Lookback Left”, defval=5)
rangeUpper = input(title=”Max of Lookback Range”, defval=100)
rangeLower = input(title=”Min of Lookback Range”, defval=2)
plotBull = input(title=”Plot Bullish”, defval=true)
plotHiddenBull = input(title=”Plot Hidden Bullish”, defval=true)
plotBear = input(title=”Plot Bearish”, defval=true)
plotHiddenBear = input(title=”Plot Hidden Bearish”, defval=true)
// Additional Plot colors
//col_grow_above = input(#26A69A, “Above Grow”, input.color, group=”Histogram”, inline=”Above”)
//col_fall_above = input(#B2DFDB, “Fall”, input.color, group=”Histogram”, inline=”Above”)
//col_grow_below = input(#FFCDD2, “Below Grow”, input.color, group=”Histogram”, inline=”Below”)
//col_fall_below = input(#FF5252, “Fall”, input.color, group=”Histogram”, inline=”Below”)
bearColor = color.red
bullColor = color.green
hiddenBullColor = color.new(color.green, 80)
hiddenBearColor = color.new(color.red, 80)
textColor = color.white
noneColor = color.new(color.white, 100)
rsi = sum(close>close[1]?volume*close-close[1]:close<close[1]?(volume*-1)*close-close:0,len)
m = sum(close>close[1]?volume*close-close[1]:close<close[1]?(volume*-1)*close-close:0,len)
xLag = (l_ma – 1) / 2
EMAData = (rsi + (rsi – rsi[xLag]))
ZLEMA = ema(EMAData, l_ma)
osc = toast(rsi ,l_ma)
//zero lag ema variant
//osc = ZLEMA
tsvColor = m > 0 ? color.new(#b2b5be, 0) : color.new(#b2b5bf, 0)
plot(m, color=tsvColor, title=”TSVr”, linewidth=2, style=plot.style_histogram)
//plot(m, title=”TSV”, linewidth=1, style=plot.style_histogram, color=color.new((m>=0 ? (m[1] < m ? col_grow_above : col_fall_above) : (m[1] < m ? col_grow_below : col_fall_below) ),0))
//plot(m, title=”TSV”, linewidth=1, color=#f2f2f2, style=plot.style_histogram)
plot(osc, title=”TSV VWMA”, linewidth=1, color=#f2f2f2)
hline(0, title=”Middle Line”, linestyle=hline.style_solid)
bgcolor(color=crossover(osc, 0) ? #f2f2f2 : na, transp=100, title=”Background Cross Up”)
bgcolor(color=crossunder(osc, 0) ? #f2f2f2 : na, transp=100, title=”Background Cross Down”)
//Additional crossovers
//plotshape(series=crossover(m, osc), style=shape.triangledown, color=#ffffff, transp=0, location=location.belowbar)
//plotshape(series=crossunder(m, osc), style=shape.triangleup, color=#ffffff, transp=0, location=location.abovebar)
plotshape(series=crossover(osc, 0), title=”Cross Up”, size=size.auto, style=shape.diamond, color=#a0d99e, transp=0, location=location.bottom)
plotshape(series=crossunder(osc, 0), title=”Cross Down”, size=size.auto, style=shape.diamond, color=#b04735, transp=0, location=location.bottom)
crossoverCond = crossover(osc, 0)
crossunderCond = crossunder(osc, 0)
Long = (m > osc) and (m > 0)
Long_fail = (m < osc) and (m > 0)
Short = (m < osc) and (m < 0)
Short_fail = (m > osc) and (m < 0)
plotshape(Long, title=”Price Action Long”, location=location.bottom, style=shape.square, size=size.auto, color=color.green, transp=80)
plotshape(Short, title=”Price Action Short”, location=location.bottom, style=shape.square, size=size.auto, color=color.red, transp=80)
plotshape(Long_fail, title=”Price Action Long – FAILURE”, location=location.bottom, style=shape.xcross, size=size.auto, color=color.black, transp=60)
plotshape(Short_fail, title=”Price Action Short – FAILURE”, location=location.bottom, style=shape.xcross, size=size.auto, color=color.black, transp=60)
//Kumo Cloud
conversionPeriods = input(9, minval=1, title=”Conversion Line Length”)
basePeriods = input(26, minval=1, title=”Base Line Length”)
laggingSpan2Periods = input(52, minval=1, title=”Lagging Span 2 Length”)
displacement = input(1, minval=0, title=”Displacement”)
donchian(len) => avg(lowest(len), highest(len))
conversionLine = donchian(conversionPeriods)
baseLine = donchian(basePeriods)
leadLine1 = avg(conversionLine, baseLine)
leadLine2 = donchian(laggingSpan2Periods)
//Additional options to Kumo
//plot(conversionLine, color=#2962FF, title=”Conversion Line”)
//plot(baseLine, color=#B71C1C, title=”Base Line”)
//plot(close, offset = -displacement + 1, color=#43A047, title=”Lagging Span”)
p1 = plot(leadLine1, offset = displacement, color=#A5D6A7, transp=100,
title=”Lead 1″)
p2 = plot(leadLine2, offset = displacement, color=#EF9A9A, transp=100,
title=”Lead 2″)
//fill(p1, p2, color = leadLine1 > leadLine2 ? color.rgb(67, 160, 71, 70) : color.rgb(244, 67, 54, 70))
bgcolor (color = leadLine1 > leadLine2 ? color.rgb(67, 160, 71, 90) : color.rgb(244, 67, 54, 90))
crossKumoCond = cross(leadLine1, leadLine2)
plFound = na(pivotlow(osc, lbL, lbR)) ? false : true
phFound = na(pivothigh(osc, lbL, lbR)) ? false : true
_inRange(cond) =>
bars = barssince(cond == true)
rangeLower <= bars and bars <= rangeUpper
//——————————————————————————
// Regular Bullish
// Osc: Higher Low
oscHL = osc[lbR] > valuewhen(plFound, osc[lbR], 1) and _inRange(plFound[1])
// Price: Lower Low
priceLL = low[lbR] < valuewhen(plFound, low[lbR], 1)
bullCond = plotBull and priceLL and oscHL and plFound
plot(
plFound ? osc[lbR] : na,
offset=-lbR,
title=”Regular Bullish”,
linewidth=1,
color=(bullCond ? bullColor : noneColor),
transp=0
)
plotshape(
bullCond ? osc[lbR] : na,
offset=-lbR,
title=”Regular Bullish Label”,
text=”B”,
style=shape.labelup,
location=location.absolute,
color=bullColor,
textcolor=textColor,
transp=0
)
//——————————————————————————
// Hidden Bullish
// Osc: Lower Low
oscLL = osc[lbR] < valuewhen(plFound, osc[lbR], 1) and _inRange(plFound[1])
// Price: Higher Low
priceHL = low[lbR] > valuewhen(plFound, low[lbR], 1)
hiddenBullCond = plotHiddenBull and priceHL and oscLL and plFound
plot(
plFound ? osc[lbR] : na,
offset=-lbR,
title=”Hidden Bullish”,
linewidth=1,
color=(hiddenBullCond ? hiddenBullColor : noneColor),
transp=0
)
plotshape(
hiddenBullCond ? osc[lbR] : na,
offset=-lbR,
title=”Hidden Bullish Label”,
text=”H”,
style=shape.labelup,
location=location.absolute,
color=bullColor,
textcolor=textColor,
transp=0
)
//——————————————————————————
// Regular Bearish
// Osc: Lower High
oscLH = osc[lbR] < valuewhen(phFound, osc[lbR], 1) and _inRange(phFound[1])
// Price: Higher High
priceHH = high[lbR] > valuewhen(phFound, high[lbR], 1)
bearCond = plotBear and priceHH and oscLH and phFound
plot(
phFound ? osc[lbR] : na,
offset=-lbR,
title=”Regular Bearish”,
linewidth=1,
color=(bearCond ? bearColor : noneColor),
transp=0
)
plotshape(
bearCond ? osc[lbR] : na,
offset=-lbR,
title=”Regular Bearish Label”,
text=”B”,
style=shape.labeldown,
location=location.absolute,
color=bearColor,
textcolor=textColor,
transp=0
)
//——————————————————————————
// Hidden Bearish
// Osc: Higher High
oscHH = osc[lbR] > valuewhen(phFound, osc[lbR], 1) and _inRange(phFound[1])
// Price: Lower High
priceLH = high[lbR] < valuewhen(phFound, high[lbR], 1)
hiddenBearCond = plotHiddenBear and priceLH and oscHH and phFound
plot(
phFound ? osc[lbR] : na,
offset=-lbR,
title=”Hidden Bearish”,
linewidth=1,
color=(hiddenBearCond ? hiddenBearColor : noneColor),
transp=0
)
plotshape(
hiddenBearCond ? osc[lbR] : na,
offset=-lbR,
title=”Hidden Bearish Label”,
text=”H”,
style=shape.labeldown,
location=location.absolute,
color=bearColor,
textcolor=textColor,
transp=0
)
alertcondition(crossKumoCond, title=”Kumo Cloud Change”, message=”Kumo Cloud changed color {{ticker}} XXmin”)
alertcondition(crossoverCond, title=”Cross Up”, message=”TSV Cross Up {{ticker}} XXmin”)
alertcondition(crossoverCond, title=”Cross Down”, message=”TSV Cross Down {{ticker}} XXmin”)
alertcondition(bullCond, title=”Bull”, message=”TSV Regular Bull Div {{ticker}} XXmin”)
alertcondition(bearCond, title=”Bear”, message=”TSV Regular Bear Div {{ticker}} XXmin”)
alertcondition(hiddenBullCond, title=”Hidden Bull”, message=”TSV Hidden Bull Div {{ticker}} XXmin”)
alertcondition(hiddenBearCond, title=”Hidden Bear”, message=”TSV Hidden Bear Div {{ticker}} XXmin”)