Stochastic RSI Crossover

Viewing 5 posts - 1 through 5 (of 5 total)

  • Author
    Posts
  • #113717 quote
    henksaenenhenksaenen
    Participant
    New

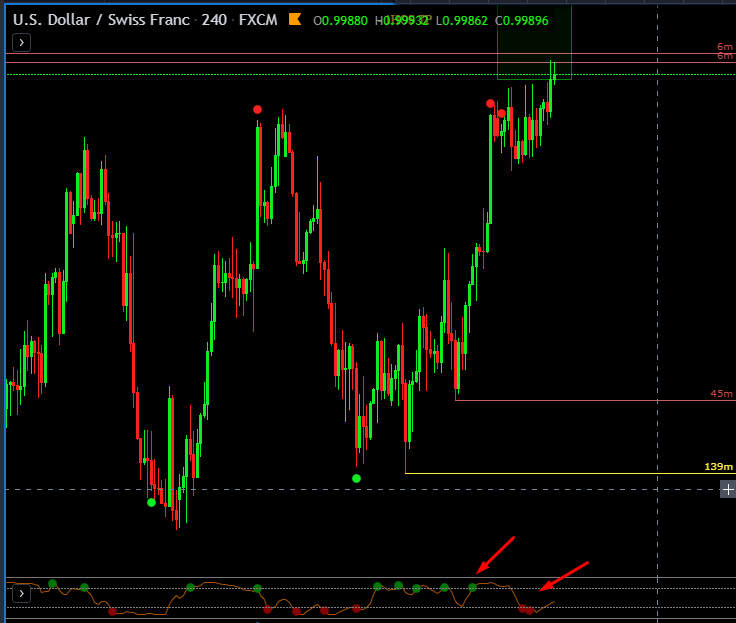
    The indicator gives a dot in the indicator window when the rsi k line crosses up the 70 or down the 30 into overbought or oversold.

    ——————————————————————————————–

    //@version=3

    study(“Stochastic RSI”, shorttitle=”Stoch RSI Crossovers”, overlay=false)

    /////////////////////////////////////////////////
    ///// Variables and Inputs /////
    /////////////////////////////////////////////////

    // Define The Variables //
    V = volume
    O = open
    H = high
    L = low
    C = close

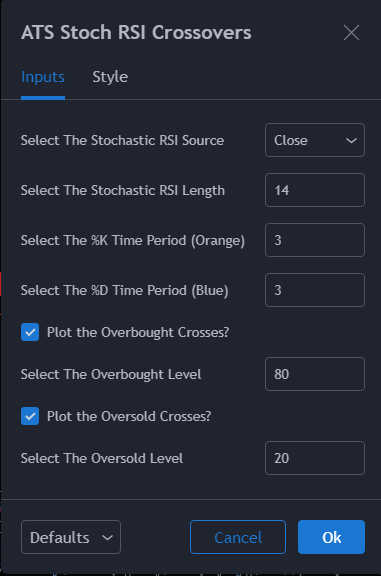
    srcSelect = input(title = “Select the Stochastic RSI Source”, defval = “Close”, options=[“Open”, “High”, “Low”, “Close”, “Volume”, “HL/2”, “HLC/3”, “OHLC/4″])
    src = iff(srcSelect==”Open”, O, iff(srcSelect==”High”, H, iff(srcSelect==”Low”, L, iff(srcSelect==”HL/2″, hl2, iff(srcSelect==”HLC/3″, hlc3, iff(srcSelect==”OHLC/4″, ohlc4, iff(srcSelect==”Volume”, V, C)))))))
    len = input(title = “Select the Stochastic RSI Length”, defval = 14, minval = 1, step = 1)
    stochK = input(title = “Select the %K Time Period (Orange)”, defval = 3, minval = 1, step = 1)
    stochD = input(title = “Select the %D Time Period (Blue)”, defval = 3, minval = 1, step = 1)
    checkOBPlot = input(title = “Plot the Overbought Crosses?”, defval = true)
    overSold = input(title = “Select the Overbought Level”, defval = 80, minval = 1, step = 1)
    checkOSPlot = input(title = “Plot the Oversold Crosses?”, defval = false)
    overBought = input(title = “Select the Oversold Level”, defval = 20, minval = 1, step = 1)

    /////////////////////////////////////////////////
    ///// Stochastic RSI Calc /////
    /////////////////////////////////////////////////

    sRSI = rsi(src, len)
    k = sma(stoch(sRSI, sRSI, sRSI, len), stochK)
    d = sma(k, stochD)

    /////////////////////////////////////////////
    ///// Plots and Plot Conditions /////
    /////////////////////////////////////////////

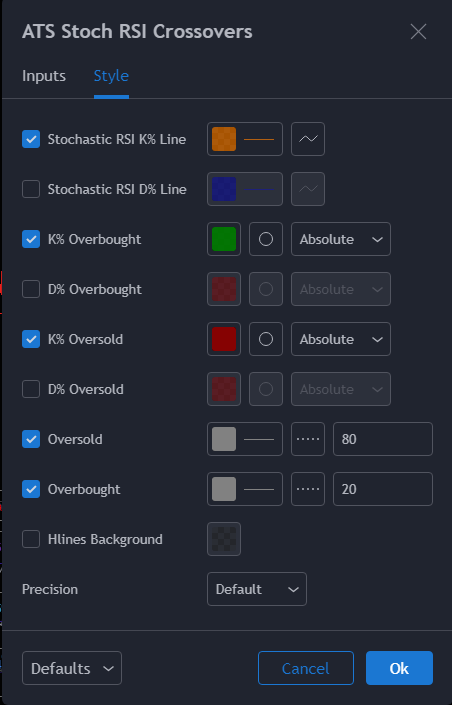
    plot(k, title=”Stochastic RSI K% Line”, color = orange, style = line, linewidth=1)
    plot(d, title=”Stochastic RSI D% Line”, color = blue, style = line, linewidth=1)

    oSoldLine = hline(overSold, title=’Oversold’, color=gray, linestyle=dotted, linewidth=1)
    oBoughtLine = hline(overBought, title=’Overbought’, color=gray, linestyle=dotted, linewidth=1)
    fill(oSoldLine, oBoughtLine, color=gray, transp=80)

    kCrossOver = crossover(k, overSold)
    dCrossOver = crossover(d, overSold)

    kCrossUnder = crossunder(k, overBought)
    dCrossUnder = crossunder(d, overBought)

    plotshape(checkOBPlot and kCrossOver ? k : na, title=”K% Overbought”, color=green, style=shape.circle, location=location.absolute, size=size.tiny, transp=50)
    plotshape(checkOBPlot and dCrossOver ? d : na, title=”D% Overbought”, color=red, style=shape.circle, location=location.absolute, size=size.tiny, transp=50)

    plotshape(checkOSPlot and kCrossUnder ? k : na, title=”K% Oversold”, color=green, style=shape.circle, location=location.absolute, size=size.tiny, transp=50)
    plotshape(checkOSPlot and dCrossUnder ? d : na, title=”D% Oversold”, color=red, style=shape.circle, location=location.absolute, size=size.tiny, transp=50)

    alertcondition(kCrossOver, title=”K% Overbought Alert”, message=”K% Crossed Into Overbought”)
    alertcondition(dCrossOver, title=”D% Overbought Alert”, message=”D% Crossed Into Overbought”)
    alertcondition(kCrossOver, title=”K% Oversold Alert”, message=”K% Crossed Into Oversold”)
    alertcondition(dCrossOver, title=”D% Oversold Alert”, message=”D% Crossed Into Oversold”)

    #113718 quote
    henksaenenhenksaenen
    Participant
    New

    Forgot to mention that this comes from Tradingview….

    #113737 quote
    NicolasNicolas
    Keymaster
    Legend

    Please post a screenshot and follow the rules to ask code conversion next time: Ask for a free code conversion

    #113739 quote
    henksaenenhenksaenen
    Participant
    New

    My apologies . First time here lol. I thought I had attached some screen shots but that went a bit wrong apparently.

    Let me try that again.

    Screenshot_3.png Screenshot_3.png Screenshot_2.png Screenshot_2.png Screenshot_1.png Screenshot_1.png
    #113944 quote
    henksaenenhenksaenen
    Participant
    New

    Hi Nicolas, just to make sure I understand  correctly. Would like me to open a new request or can we work with this one?

Viewing 5 posts - 1 through 5 (of 5 total)
  • You must be logged in to reply to this topic.

ProRealAI ProRealAI New

Stuck on this ProBuilder code?

Describe what this topic is trying to build, in plain English, and ProRealAI writes the ProRealTime™ indicator, screener or system for you.

Available in 7 languages
Try ProRealAI

Stochastic RSI Crossover


ProBuilder: Indicators & Custom Tools

New Reply
Author
author-avatar
henksaenen @henksaenen Participant
Summary

This topic contains 4 replies,
has 2 voices, and was last updated by henksaenenhenksaenen
6 years, 10 months ago.

Topic Details
Forum: ProBuilder: Indicators & Custom Tools
Language: English
Started: 11/27/2019
Status: Active
Attachments: 3 files
ProRealCode ProRealCode
Loading...