Stoch RSI Heat Map

Viewing 5 posts - 1 through 5 (of 5 total)

  • Author
    Posts
  • #111449 quote
    Loop
    Participant
    Senior

    Hi All,

    I have this little code for a Stochastic RSI Indicator built up on an exponentialmoving average of xx length:

    A=exponentialaverage[xx](close)
    AH=exponentialaverage[xx](high)
    AL=exponentialaverage[xx](low)
    
    RSI14 = RSI[14](A)
    MinRSI = lowest[14](RSI[14](AH))
    MaxRSI = highest[14](RSI[14](AL))
    
    StochRSI = (RSI14-MinRSI) / (MaxRSI-MinRSI)
    
    IF StochRSI < 0 THEN
    StochRSI = 0
    ENDIF
    
    IF StochRSI > 1 THEN
    StochRSI = 1
    ENDIF
    
    return StochRSI as "Stoch RSI 3", 0.2, 0.8


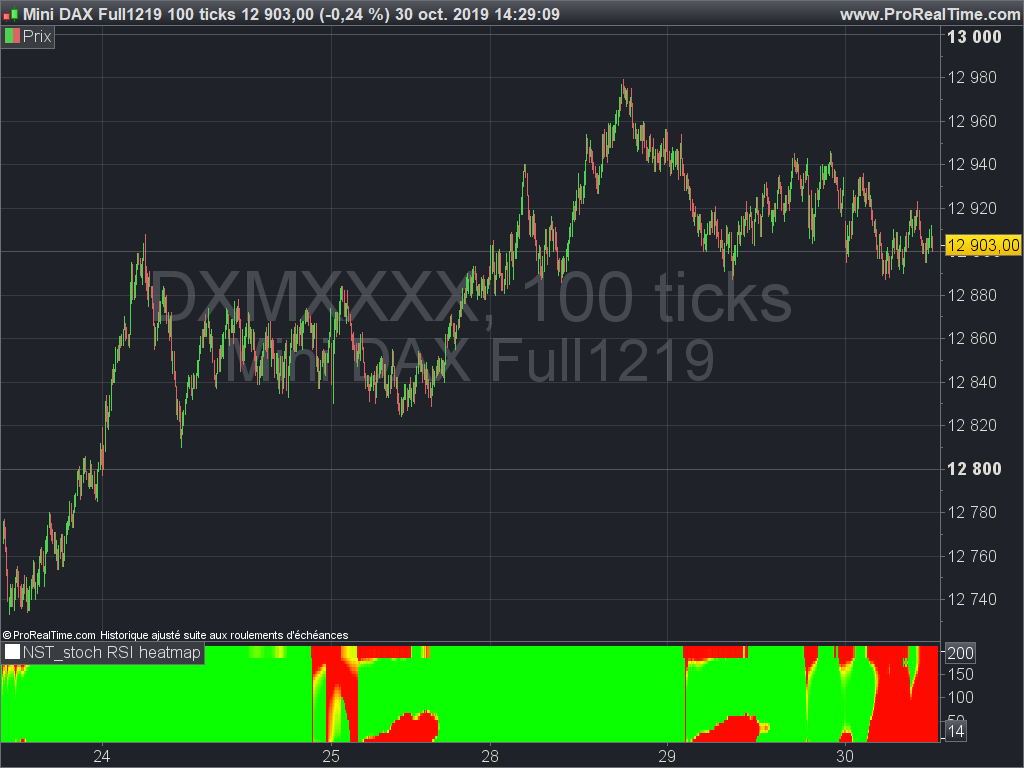
    I would like to build up an “heat map chart” similar to that reported here: https://www.prorealcode.com/prorealtime-indicators/rsi-multiperiods-heatmap/ in which the values of my “Stochastic RSI Indicator” are represented in function of the xx length value of the exponential moving average.

    Can anyone help me with this idea?

    Thanks a lot

    Loop

    #111454 quote
    Vonasi
    Moderator
    Master

    Loop – Please use the ‘Insert PRT Code’ button when posting code in future posts as it makes it so much easier for others to read. I have tidied up your post on this occasion. 🙂

    #111494 quote
    Nicolas
    Keymaster
    Legend

    So do you consider that the 3 exponential moving average A, AH and AL share the same exact calculation period?

    #111533 quote
    Loop
    Participant
    Senior

    Hi Nicolas,

    I did. Does this represent  a problem?

    #111671 quote
    Nicolas
    Keymaster
    Legend

    I don’t know how you will interpret it, but here it is:

    //PRC_STOCH RSI multiperiods HeatMap | indicator
    //https://www.prorealcode.com/topic/stoch-rsi-heat-map/
    //Plot an heatmap of the RSI range of periods
    //Nicolas @ www.prorealcode.com
    //Sharing ProRealTime knowledge
    
    // --- settings
    startperiod=14 //start period of the loop
    maxscale=200 //end period of the loop
    Step=7 //period step of the loop
    // --- end of settings
    
    iPeriod=startperiod //first period to test is..startperiod
    
    while iPeriod<=maxscale do
    
    // --- indicator calculation
    A=exponentialaverage[iperiod](close)
    AH=exponentialaverage[iperiod](high)
    AL=exponentialaverage[iperiod](low)
    
    RSI14 = RSI[14](A)
    MinRSI = lowest[14](RSI[14](AH))
    MaxRSI = highest[14](RSI[14](AL))
    
    StochRSI = (RSI14-MinRSI) / (MaxRSI-MinRSI)*100
    
    
    // -----
    
    result=stochRSI
    
    R = max(0,50+(200-(result-50)*12))
    G = max(0,50+(200+(result-50)*12))
    
    drawtext("■",barindex,iperiod,dialog,bold,18) coloured(min(max(10,r),255),min(max(10,g),255),0)
    
    iPeriod=max(startperiod,iPeriod+Step) //increase indicator period for next loop iteration
    wend
    
    return startperiod,maxscale


    stochastic-rsi-heatmap.png stochastic-rsi-heatmap.png
Viewing 5 posts - 1 through 5 (of 5 total)

  • You must be logged in to reply to this topic.

ProRealAI ProRealAI New

Stuck on this ProBuilder code?

Describe what this topic is trying to build, in plain English, and ProRealAI writes the ProRealTime™ indicator, screener or system for you.

Available in 7 languages
Try ProRealAI

Stoch RSI Heat Map


ProBuilder: Indicators & Custom Tools

New Reply
Author
author-avatar
Loop @loop Participant
Summary

This topic contains 4 replies,
has 3 voices, and was last updated by Nicolas

6 years, 10 months ago.

Topic Details
Forum: ProBuilder: Indicators & Custom Tools
Language: English
Started: 10/28/2019
Status: Active
Attachments: 1 files
Logo Logo
Loading...