The condition :
Cv3 = STD[10](close) >= 10.93 * pipsize
is made to avoid taking position in a small range = FALSE SIGNALS !!
I have choise 10.93 after a walk forward backtest with 6 occurencies. You can try and tou will see that the results are good.
Personnaly I prefer the original version of the code without Training Stop :
12
13
14
15
16
17
18
19
20
|
// PAC MAN STRATEGY – PIP HUNTER
// SHORT EUR USD (M15)
// SPREAD = 1 PIP
DEFPARAM CumulateOrders = false
DEFPARAM Preloadbars = 4000
N = 7 //MINI LOT $1
Cv1 = (close < Average[100]) and (Average[50] < Average[50](close[1]))
Cv2 = RSI[14](close) <= 28
Cv3 = STD[10](close) >= 10.93 * pipsize
Cv4 = close <= BollingerDown[13](close[2])
OKSHORT = cv1 and cv2 and Cv3 and Cv4
IF OKSHORT then
Sellshort n CONTRACT at market
SET STOP pLOSS 52
SET TARGET PPROFIT 25
ENDIF
|
But i think the code can be improve with less optimisation and more “price action”…
 CN
CNParticipant
Senior
I enjoy the code Balmora. Running it live 🙂
Hi Inertia , Balmora,
I’am playng with your code … I added : tprofit 11 + Nicolas Trailing and doesn’t work on Friday
What do you think ?
// PAC MAN STRATEGY - PIP HUNTER
// SHORT EUR USD (M15)
// SPREAD = 0.8 PIP
//  Modifiche dall'originale :   TP 11 , +trailing stop

DEFPARAM CumulateOrders = false
//DEFPARAM Preloadbars = 4000

N = 1   //MINI LOT $1

Cv1 = (close < Average[100]) and (Average[50] < Average[50](close[1]))
Cv2 = RSI[14](close) <= 28
Cv3 = STD[10](close) >= 10.93 * pipsize
Cv4 = close <= BollingerDown[13](close[2])
OKSHORT = cv1 and cv2 and Cv3 and Cv4


if currentdayofweek <> 5 then
IF OKSHORT then
Sellshort n CONTRACT at market
SET STOP pLOSS 52
SET TARGET PPROFIT 11
//SET TARGET PPROFIT 25
ENDIF
endif


//***************************************************************************************
trailingstart = 5  // 5, 10, 21   trailing will start @trailinstart points profit
trailingstep  = 1      //1     trailing step to move the "stoploss"
//reset the stoploss value
IF NOT ONMARKET THEN
newSL=0
ENDIF
//manage long positions
IF LONGONMARKET THEN
//first move (breakeven)
IF newSL=0 AND close-tradeprice(1)>=trailingstart*pipsize THEN
newSL = tradeprice(1)+trailingstep*pipsize
ENDIF
//next moves
IF newSL>0 AND close-newSL>=trailingstep*pipsize THEN
newSL = newSL+trailingstep*pipsize
ENDIF
ENDIF
//manage short positions
IF SHORTONMARKET THEN
//first move (breakeven)
IF newSL=0 AND tradeprice(1)-close>=trailingstart*pipsize THEN
newSL = tradeprice(1)-trailingstep*pipsize
ENDIF
//next moves
IF newSL>0 AND newSL-close>=trailingstep*pipsize THEN
newSL = newSL-trailingstep*pipsize
ENDIF
ENDIF
//stop order to exit the positions
IF newSL>0 THEN
SELL AT newSL STOP
EXITSHORT AT newSL STOP
ENDIF
///   -----------------------------------------
Hi JR1976. Seems very interesting. I’m not at home but tonight i will test it on 200.000 units 15
Thx JR1972.
However ratio between Drawdown/Runup is >15% (high and risky IMHO)
Not to compare stupidly but the one with the EMA filter shared ealier show a ratio <8% which makes it stronger over time (if I may).
Perhaps, % instead of points could be more adaptative over time as well…
You can try this new versus of the code with an exit instruction after 100 units in negative performance :
// PAC MAN - PIP HUNTER
// EUR / USD (M15)
// By BALMORA74 19.05.2018

DEFPARAM CumulateOrders = false
DEFPARAM Preloadbars = 4000

//VARIABLES
ONCE BarShort = 100   //EXIT ZOMBIE TRADE
N = 5                 // POSITION SIZE $1

// STRATEGY
Cv1 = (close < Average[100]) and (Average[50] < Average[50](close[1]))
Cv2 = RSI[14](close) <= 28
Cv3 = STD[10](close) >= 10.93 * pipsize
Cv4 = close <= BollingerDown[13](close[2])
OKSHORT = cv1 and cv2 and Cv3 and Cv4

IF OKSHORT then
Sellshort n CONTRACT at market
SET STOP pLOSS 52
SET TARGET PPROFIT 25
ENDIF


//EXIT ZOMBIE TRADE
IF POSITIONPERF<0 THEN
IF shortOnMarket AND BARINDEX-TRADEINDEX(1)>= barshort  THEN
EXITSHORT AT MARKET
ENDIF
ENDIF
Have a nice day !
Hi JR1976,
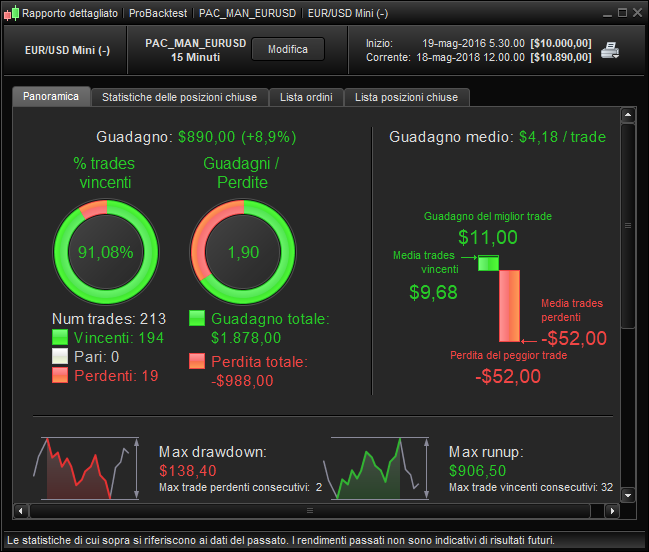
I show you the backtest of your code with a 200kb unit backtest.
Position size = 5 mini lot ($1) and Starting Capital = 10.000 euros.
Seems interesting….
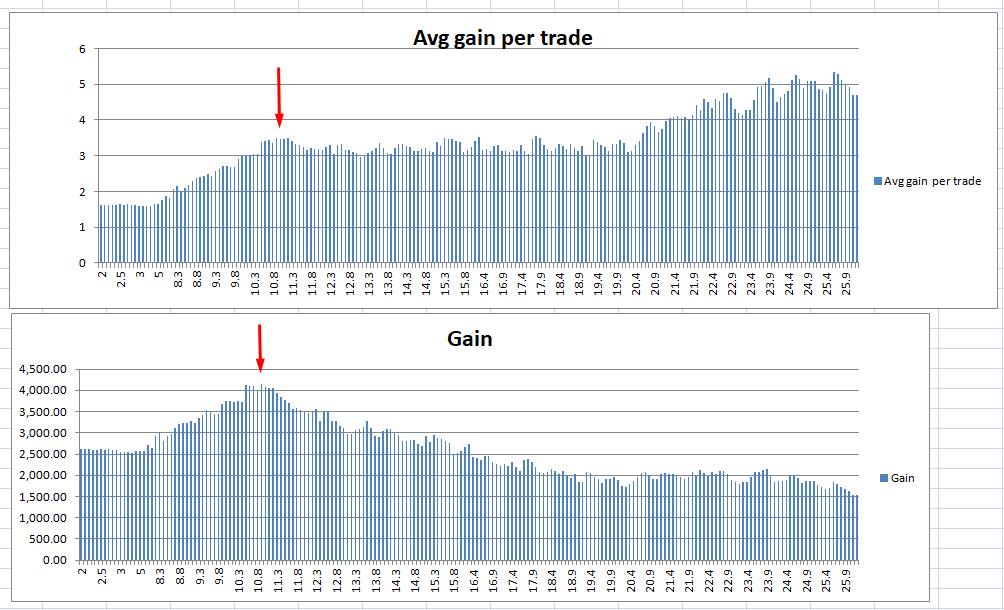
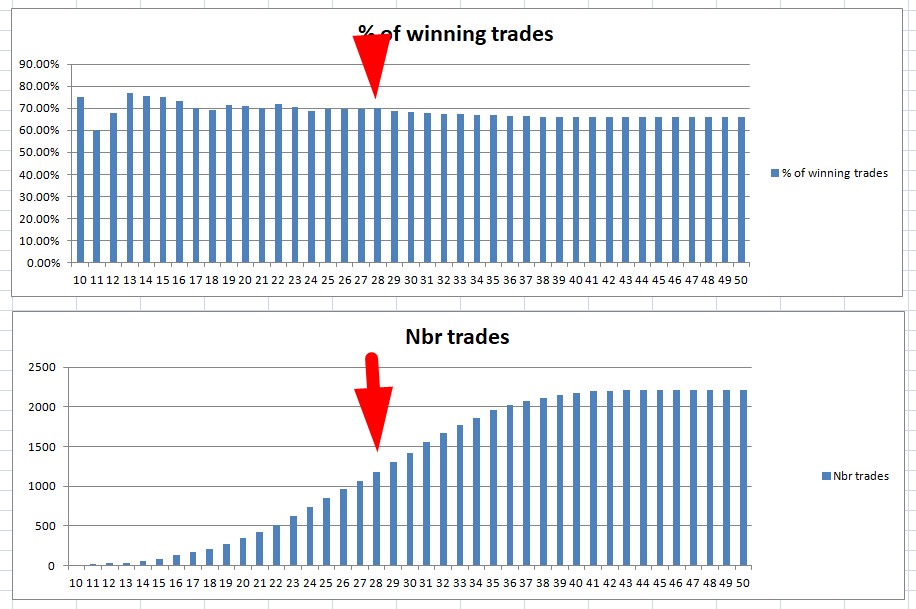
I thought I’d check out the importance of some of the variables. The one that worried me the most upon first inspection was this one set at 10.93
Cv3 = STD[10](close) >= 10.93 * pipsize
So I graphed the results for other potential values:
[attachment file=70875]
[attachment file=70876]
So it seems that 10.93 is a very optimized value. This is not to say that it will not work into the future (and you would not have lost any money either side of this optimized value but the further future markets move from this ideal value the rougher the equity curves are likely to get I suspect.
A walk forward test with different values showed that earlier on a value around 15 would have been the best value to run with but since then around 9 or 10 would have been better.
One to put on demo and watch I think…..
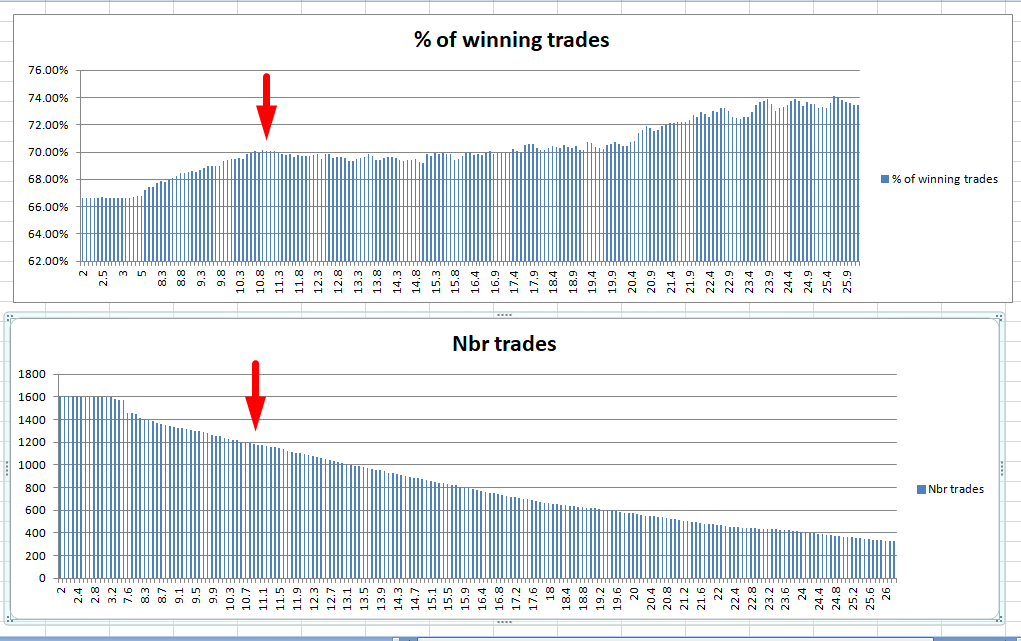
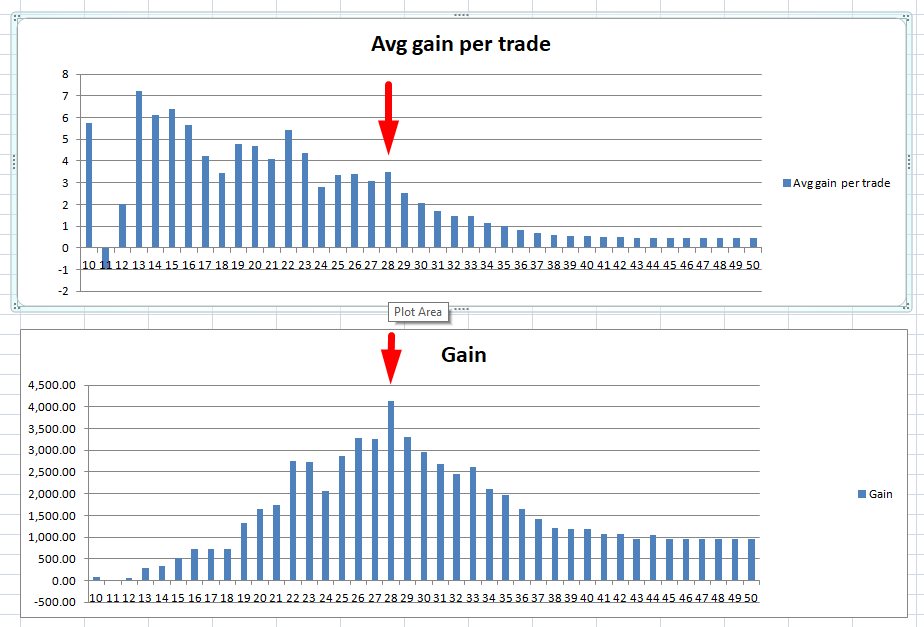
…and the analysis of RSI values:
[attachment file=70879]
[attachment file=70880]
Thanks Vonasi for your very strong analysis ! You can do it with PRT tools or is it personnals tools ?
Just Excel. Arrange the optimized results from low value to high value and then drag the window into Excel and create a chart. Worth doing for every strategy you create just to get an idea of results either side of your perfect value.
IMHO I think that this strategy could be profitable. Whether everyone could stomach the equity curve when it is not as perfect as the perfect variable values makes everyone think the results should be is the bigger question. Going for three years with small losses and no profits is difficult to follow through with despite the fact that year four eventually makes up for all of it. A big starting bank balance and lots of other strategies and a strong psychology will only make up for this. No one strategy is a get rich quick in a straight line possibility unless you are lucky and luck cannot be quantified so should never be a part of a traders portfolio.
Small starting balance = one strategy and trade and hope for luck.
Big starting balance = lots of strategies diversified across markets and trade and make money with some big draw downs.
Sorry – all a bit heavy but a lot of full time paper trading and analysing has led me to this conclusion.
Still this one may work for a while and some may make some money and some may lose some money eventually!
Vonasi thank you for the detailed and well explained answer
Would you personally use this algorithm and if so with what value the conditions on the RSI and STD?
Would you personally use this algorithm and if so with what value the conditions on the RSI and STD?
I would not put any strategy live until it has had at least several months successful forward testing on demo and after that only with minimum stake. money is difficult to make but very easy to lose. It is boring and a difficult thing to just sit on your hands and not have the excitement of real money on the table but if you look back on this forum and find strategies that were posted over a year ago and then backtest them now with the new out of sample period that you have it will be rare that you will find one that you would be happy to trade now. Unfortunately simplicity and ability to withstand massive draw down always seem to work.
I like your strategy because it is simple, it has few variables and is profitable over a large range of variables even if the equity curve is not always positive. What I don’t like is the limited back test period available due to the short time frame chart.
Looking at the graphs I made the values you chose are the optimum and either side is profitable so I would demo test with them and see how things go. I think the amount won per trade is very low and it will not take much for this to become a losing strategy due to this. A slightly off optimum variable value moving forward, a trade or two with increased spread and some slippage is all it needs to turn it to a losing strategy as nice as the equity curve is IMHO.