Vonasi do you think that unstead using the value 10.93 it would be bette to use this instruction based on the price :
Cv3 = average[8](STD[12](close)) >= STD[12](close[3])
I show you then equity curve / n= 5 (position size) / Capital = 10.000 euros :
IMHO = In My Humble Opinion.
Ref your last post I will have to try to find time tomorrow to test what you suggest as it is getting a bit late here in Greece and I am behind with my drinking!
IMHO = In My Humble Opinion.
Ref your last post I will have to try to find time tomorrow to test what you suggest as it is getting a bit late here in Greece and I am behind with my drinking!
ok have a nice night and week end !
 CN
CNParticipant
Senior
IMHO = In My Humble Opinion.
Ref your last post I will have to try to find time tomorrow to test what you suggest as it is getting a bit late here in Greece and I am behind with my drinking!
Great input and looking forward to seeing the test made by u 🙂
Well I have been messing around with this strategy for a few hours now and trying to come to some conclusions. Normally I do not like adding indicators to indicators – especially lagging averages to indicators as Balmora74 suggested with this:
Cv3 = average[8](STD[12](close)) >= STD[12](close[3])
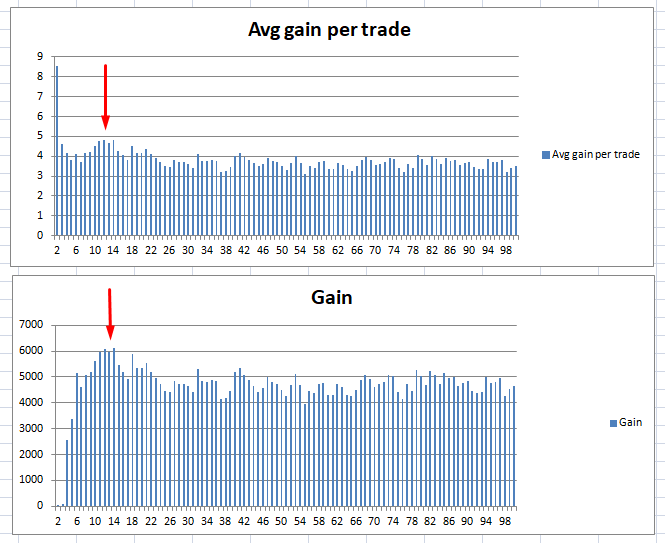
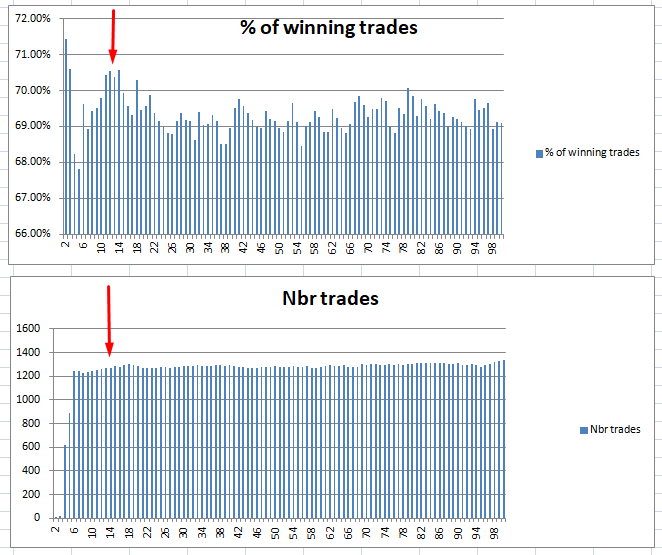
So I ran it with various values and graphed the results and it seemed that the values 3 and 8 were in the ball park so if we fixed them and tested with different values other than the STD[12] it might tell us more. Here are the graphs.
[attachment file=70965]
[attachment file=70966]
So it seems we are at or around the optimal value but is also is interesting to see that every value makes a profit. How straight the equity curve to that profit is then the issue for most people.
I decided to modify the code so that it opens a trade if the above code with values of STD[11] to STD[14] are true.
I should also point out that I added a condition to the 100 bar get out that it only gets out if in profit. So up to 100 bars it aims for the take profit level but after that it just aims to get out with any profit. This had little benefit or disadvantage but I left it in.
So then I noticed that being a shorting strategy its performance when the instrument was falling was much better than when it was rising or chopping up and down so I tried to filter this out but gave up as it seemed better to just put up with the chop or short down periods rather than rely on a very fitted filter on historical data. My worry though is that with a very rapidly rising price this strategy will more than likely lose money.
So having failed to break the strategy so far I decided to do what I normally do and remove things to see what effect they have. It seems that the filters Cv1 and Cv4 do very little at all so I deleted them.
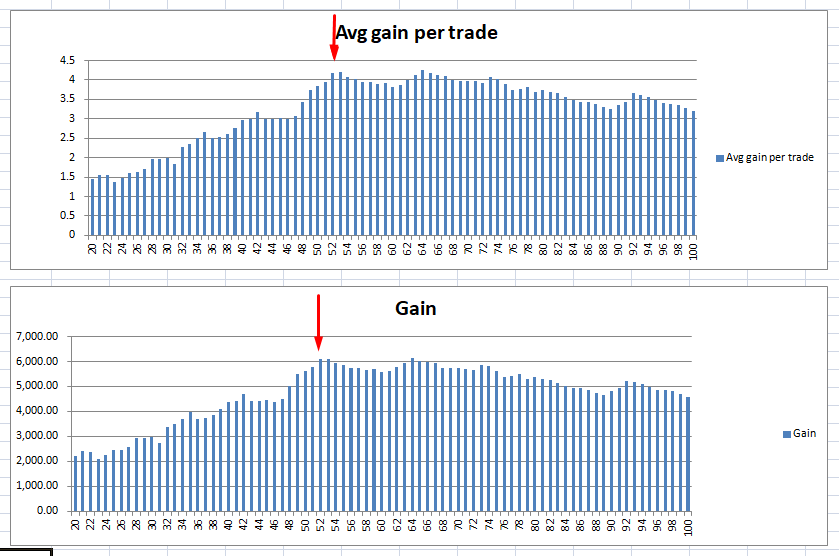
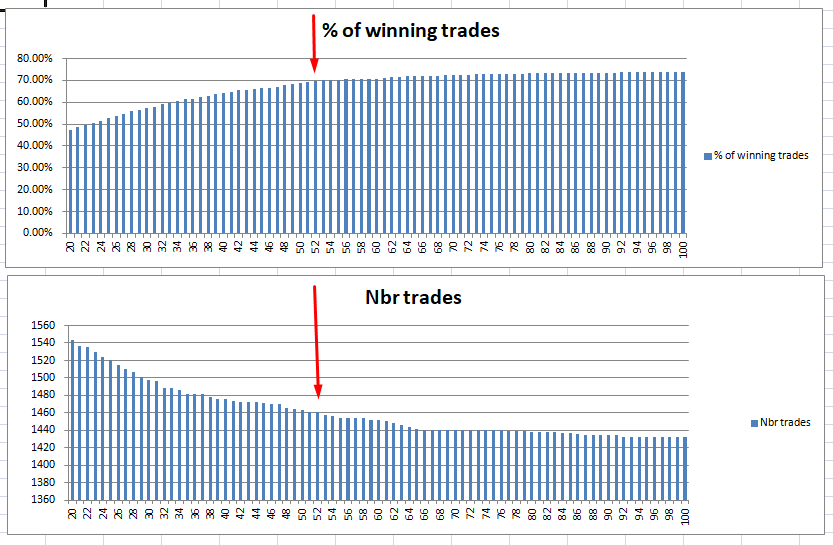
The next thing to do is look at the stop loss level. Here are the graphs with other values:
[attachment file=70967]
[attachment file=70968]
It seems that the level of 52 is very optimized and very close to the cliff edge. I am not a fan of tight stop losses or stop losses at all! I think moving it further to the middle of the range that provided best profit – around 64 would be better.
It seems a fairly robust strategy and there is definitely something about it that has worked over the test period – whether that continues or how straight the equity curve is can only be tested with out of sample forward testing. For interest here is the code that I ended up with – I can’t say that it is any better or will be profitable going forward but it has less and is slightly less optimized:
// PAC MAN - PIP HUNTER
// EUR / USD (M15)
// By BALMORA74 19.05.2018 - Vonasi modifications 20-5-18

DEFPARAM CumulateOrders = false
DEFPARAM Preloadbars = 4000

PositionSize = 1

Cv2 = RSI[14](close) <= 28
Cv3 = 0
For i = 11 to 14 Do
IF average[8](STD[i](close)) >= STD[i](close[3]) THEN
Cv3 = 1
ENDIF
NEXT

OKSHORT = cv2 and Cv3

IF OKSHORT then
Sellshort PositionSize CONTRACT at market
SET STOP pLOSS 64
SET TARGET PPROFIT 25
ENDIF

//EXIT ZOMBIE TRADE
IF shortOnMarket AND BARINDEX-TRADEINDEX(1)>= 100 and close > TradePrice THEN
EXITSHORT AT MARKET
ENDIF
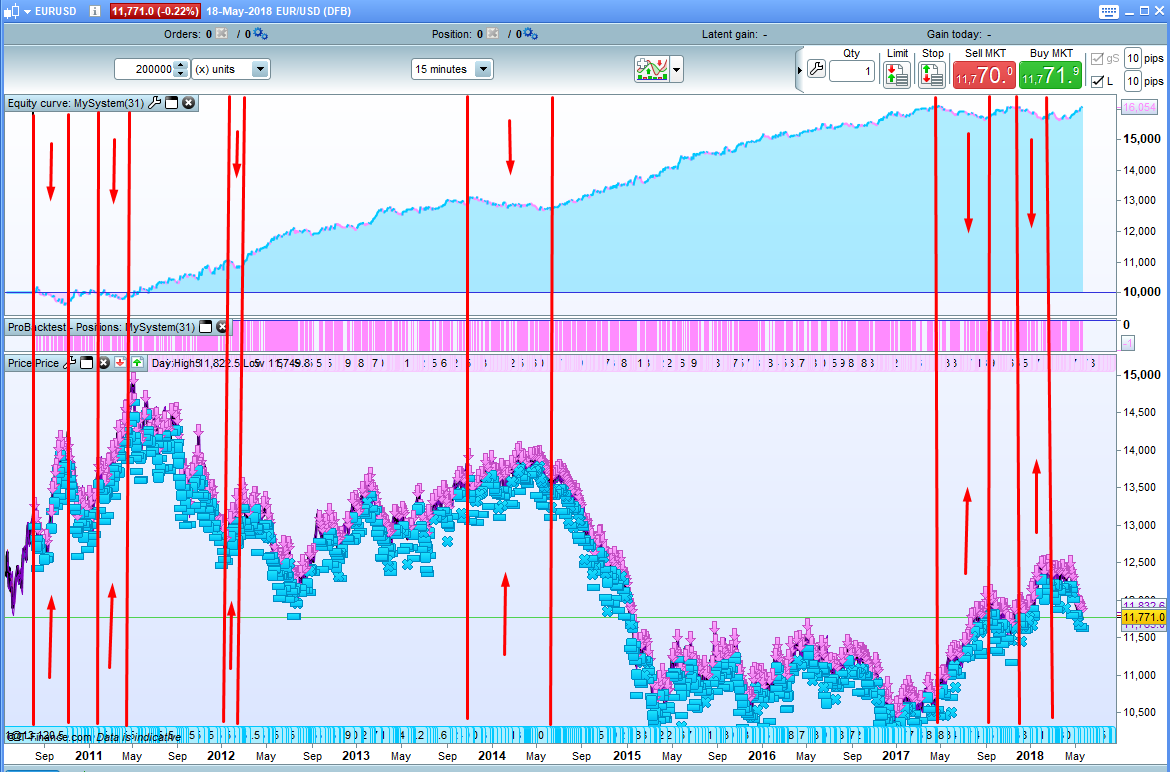
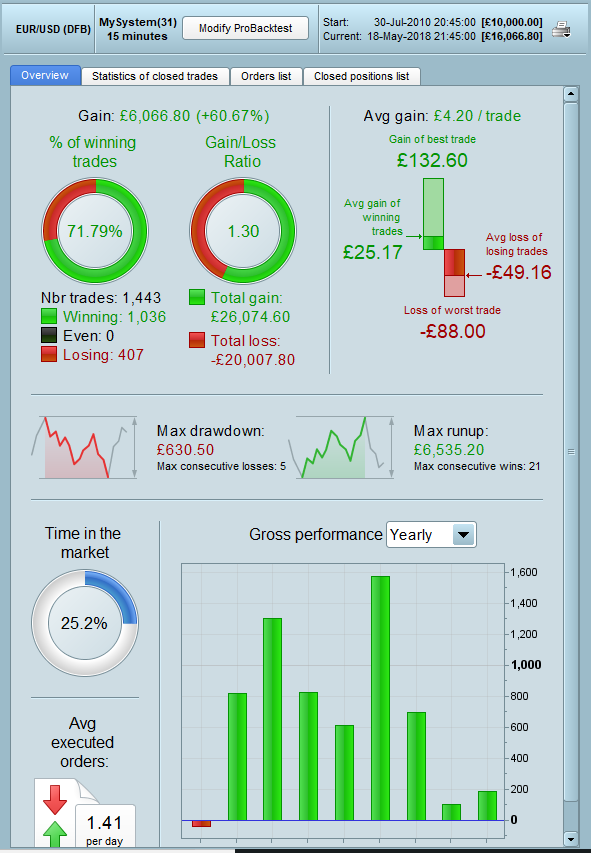
Here is the equity curve etc. I feel the secret to making this more robust is to find a filter that keeps it out of the market when the market is rising – if only it were that easy! The lines on the graph show the falling equity curve when the market is rising – filter some of these out and gain per bet will be far higher. At the end of the day no matter what I did the average gain per bet was very low and that is always a worry as it is very easy to slip into a steadily losing strategy from there.
[attachment file=70971]
[attachment file=70972]
CNParticipant
Senior
Wow, amazing work @Vonasi
Much apriciated!
Ok Vonasi thanks for you report & analysis. I return to work on the algorithm….. I have some ideas…. 😉
No problem Balmora74. Bear in mind that what I ended up with is just where I got to before beer started calling me. I should really go back to the beginning and re-analyse various values to double check that it is all still in the right ball park. Iron out the losses in a rising market and you may be on to something – although the in sample development period is still very small due to the time frame being used for good confidence building – which I guess is why I tend to avoid short time frames these days.
Not a bad start. Both the original version and my later version both opened two trades so far and both were closed in a short space of time for the full 25 pips profit with no overnight fees. So now we can afford a loser without too much panic.
I think the starting date was lucky as a backtest starting much earlier would have exchanged the first winner for a 64 pip loser which reminds me that I read somewhere once that you should always try to start your strategy during favourable conditions to try to get a good bit of credit at the beginning. Markets have been climbing but with all the trade war talks this week it is a good time to start a shorting strategy I guess. These little things can make a little difference and a lot of little things together makes a lot!
Fingers crossed the forward test continues this well and I look forward to any further development ideas from Balmora74 or anyone else who is thinks of a new filter or improvement.
Vonasi i’m trading via the broker IG and on SHORT position (EUR – USD) i have positive overnight costs. It’s means that IG gave me money. So this positive credit improves the strategy ans equity curves !!
I’have mixed different ideas and especially the code posted by Inertia (page 1 of these forum discussion) with an Trailing Stop ang Long Time Average Filter. I also add exit conditions.
Back test tick by tick / 200kb candles / Capital = 1000 $ / PositionSize = 1 mini contract.
Less positions but a very small drawdown…
This is the code :
DEFPARAM CumulateOrders = False
DEFPARAM Preloadbars = 6000


ONCE BarShort = 100   //EXIT ZOMBIE TRADE
PositionSize = 1   //EUR - USD $1


//STRATEGY
Cv1 = (close < Average[100]) and (Average[50] < Average[50](close[1]))
Cv2 = RSI[14](close) < 28
Cv3 = STD[10](close) >= 10.93 * pipsize
Cv4 = close <= BollingerDown[4](close[2])
Cv5 = close > ExponentialAverage[7250](close)
OKSHORT = Cv1 and Cv2 and Cv3 and Cv4 and Cv5

IF OKSHORT then
Sellshort PositionSize CONTRACT at market
endif

//STOP LOSS & TAKE PROFIT
SET STOP PLOSS 51
SET TARGET PPROFIT 47


//BREAKEVEN
startBreakeven = 30
PointsToKeep   = 1

IF SHORTONMARKET AND (tradeprice(1) - close) >= (startBreakeven * pipsize) THEN
breakevenLevel = tradeprice(1) + (PointsToKeep * pipsize)

IF breakevenLevel > 0 THEN
EXITSHORT AT breakevenLevel STOP
ENDIF
ENDIF

//EXIT EMA CROSSING
ex1 = SHORTONMARKET
ex2 = close CROSSES UNDER Average[3600]
ex3 = close CROSSES UNDER Average[8](close) - 2.5*std[8](close)
ex4 = close CROSSES OVER Average[16](close) + 3.25*std[16](close)
//16 + 3.25
IF ex1 AND (ex2 OR ex3 OR ex4) THEN
EXITSHORT AT MARKET
ENDIF


//EXIT ZOMBIE TRADE
IF POSITIONPERF<0 THEN
IF shortOnMarket AND BARINDEX-TRADEINDEX(1)>= barshort  THEN
EXITSHORT AT MARKET
ENDIF
ENDIF
I’ve only run a few quick checks on 100K bars so far but here are my thoughts for what they are worth.
You have added quite a lot and it has to be considered that everything and every variable that you add to a strategy just curve fits it more to the past and makes it less likely to work in the future. Try removing things and if you can barely notice the difference then they are not worth including. My quick check showed that Cv1 is adding nothing – in fact the strategy has higher gain/loss without it. The trailing stop is adding virtually nothing too. I am not a fan of trailing stops and this ones just made me even less of a fan.
I also notice that you have played with the take profit and stop loss. I suspect the stop loss is slightly closer to the cliff edge where if market characteristics shift just slightly then you will have a very good strategy…. at losing. I have not graphed it so you will need to check this yourself. Personally I think that if you can do away with targets and stop losses altogether and find a way that positions are closed on a condition then you will have a much stronger strategy.
I think that you also need to graph the average used as a filter and see how over optimized that is and also check what the draw down is either side of it.
When I see numbers like 51 and 47 for take profit and stop loss it rings alarm bells – graph them too!
I also preferred my idea of only using your ‘Zombie’ stop if the trade was in profit after a certain period. Just getting out based on time passed is never a good idea as maybe at some point at bar 99 it would have been a massive loss and bar 100 a small profit and you have just curve fitted to that with a number chosen for no other reason than it is a nice number. Plus as you said – you are getting paid for being in a short position so why rush to leave it.
Hope my ideas help……
Thank you for all these valuable tips. I am a beginner in algorithmic trading and I am really happy to receive advices to improve my algorithms. I want to try many things but I have to keep in mind that simplicity is the ultimate sophistication….
I am a beginner in algorithmic trading
I want to try many things but I have to keep in mind that simplicity is the ultimate sophistication….
We are all beginners in algorithmic trading as the markets tomorrow have very little interest in what happened yesterday or a week ago or a month ago or a year ago. But yesterday is all we have to work with so simple is more likely to fit tomorrow than complicated. IMHO
If you try to make a strategy that fits from 1970 till today then it will most probably fail tomorrow because in 1970 no one had even thought of computers or the internet and trading was done from pits with men with bits of paper. Recent history is far more relevant than distant history but as humans we want to be confident so we try to look to the past to tell us what the future will do – and the future always amazes us!
Bit heavy… sorry!