I was running both the Balmora74 and my modified version (which I believe is the one you show in your post above Sharkool – unless you have modified it and just left my name on it?) side by side in demo forward testing ever since this strategy was first discussed but unfortunately IG wiped that account out in their Christmas cull of what they called idle accounts – thanks IG it makes development and testing really easy when you just randomly delete months worth of results while we are eating Christmas dinner!
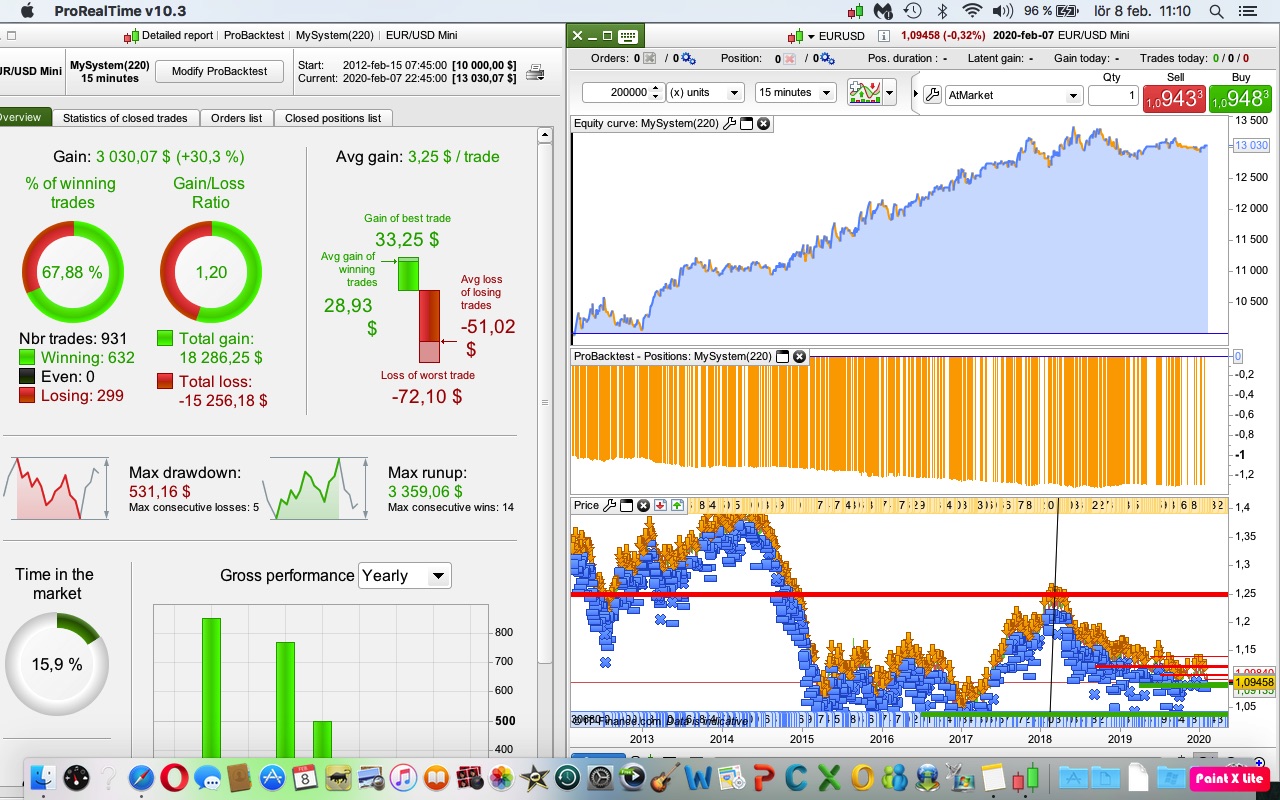
As far as I recall both versions were in profit but my modified version was winning by some way. I had not paid much attention to them as the the EUR had been in a downward trend during the whole forward test and as they are a shorting strategy I did not feel that they had been fully stress tested. The 200k results look pretty good though. Some periods of drawdown during strong upward trends but otherwise pretty nice. We also have to consider the benefit of getting paid overnight fees which cannot be shown in these results.
Possibly a strategy to re-visit I think.
It would be interesting if you have time Razz if you could do a 200k test on Balmoa74’s original version for comparison.
It is the first code shown in this post:
SHORT EUR USD (m15) // PAC MAN STRATEGY
200 k
spread=2
//-------------------------------------------------------------------------
// Main code : PacMan BALMORA74
//-------------------------------------------------------------------------
// PAC MAN - PIP HUNTER
// EUR / USD (M15)
// By BALMORA74 19.05.2018

DEFPARAM CumulateOrders = false
DEFPARAM Preloadbars = 4000

//VARIABLES
x = 100

MoneyManagement = 1 //0, 1or 2
RiskManagement = 0 //0 or 1
Capital = 10000
MinBetSize = 1
RiskLevel = 5

Equity = Capital + StrategyProfit

IF MoneyManagement = 1 THEN
PositionSize = Max(MinBetSize, Equity * (MinBetSize/Capital))
ENDIF

IF MoneyManagement = 2 THEN
PositionSize = Max(LastSize, Equity * (MinBetSize/Capital))
LastSize = PositionSize
ENDIF

IF MoneyManagement <> 1 and MoneyManagement <> 2 THEN
PositionSize = MinBetSize
ENDIF

IF RiskManagement THEN
IF Equity > Capital THEN
RiskMultiple = ((Equity/Capital) / RiskLevel)
PositionSize = PositionSize * (1 + RiskMultiple)
ENDIF
ENDIF

PositionSize = Round(PositionSize*100)
PositionSize = PositionSize/100

// STRATEGY
Cv1 = (close < Average[100]) and (Average[50] < Average[50](close[1]))
Cv2 = RSI[14](close) <= 28
Cv3 = STD[10](close) >= 10.93 * pipsize
Cv4 = close <= BollingerDown[13](close[2])
OKSHORT = cv1 and cv2 and Cv3 and Cv4

IF OKSHORT then
Sellshort PositionSize CONTRACT at market
SET STOP pLOSS 52
SET TARGET PPROFIT 25
ENDIF

//EXIT ZOMBIE TRADE
//IF POSITIONPERF < 0 THEN
IF shortOnMarket AND BARINDEX-TRADEINDEX(1)>= x and close > TradePrice THEN
EXITSHORT AT MARKET
ENDIF
//ENDIF
Thanks Stefanb.
It would have been slightly better to keep the spread at 0.7 which is what my version was back tested with. Also you have money management turned on so we are not really comparing eggs with eggs.
It is interesting to see that the equity curve has basically gone sideways since the strategy was created which proves that it was over optimised to the history.
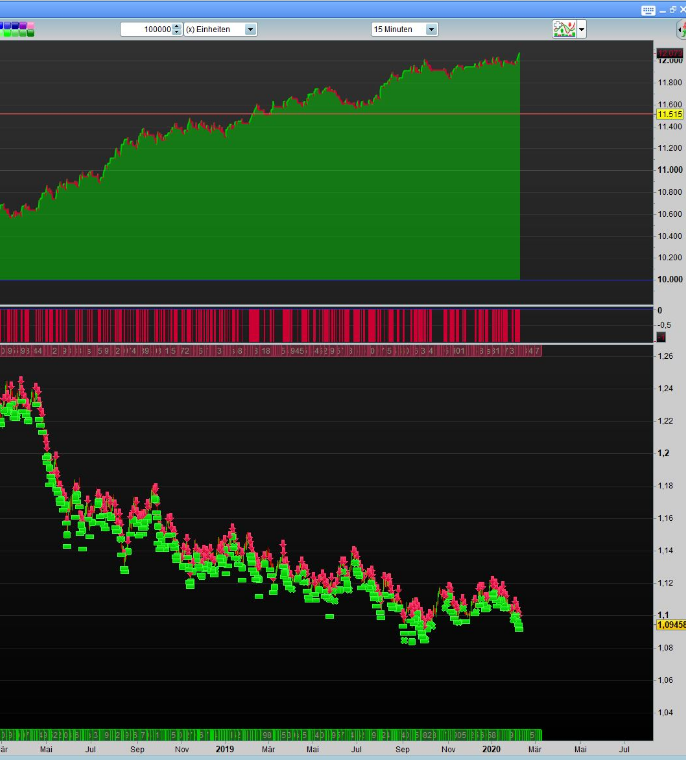
OK – I think the excitement is over. I just scanned back through the thread and I note that Balmora74 developed the strategy on 200k bars and used all the data. So that is why it looks so good on 200k bars! So really we only have the data since it’s conception on 1st May 2018 as an OOS test.
So the OOS that we have for my version (actually Sharkool’s slightly modified version) is shown in the attached image. Pretty good but we have to consider that the market has been a shorters paradise for the whole OOS period. Still it performed OK in the IS period which was much more varied so we have some hope that it won’t fall apart completely and with Brexit hanging over the Euro perhaps it will be a shorters of the Euro paradise for a bit longer.
@Vonasi, yes indeed it is your modified version which i have tried with various parameters. Looks like i ended up changing only the profit/loss targets that are more in line with my profit management. I was hoping that the strategy would behave correctly in 2017 and thanks to the 200k test it doesn’t look too bad.
So below strategy i have run between 01/09/19 to early Dec/19 and it generated slightly more than 3% excl. gain on fees (i did pause it from time to time, result is based on 37 trades). I can say this was the only profitable strategy i had during that politically movemented period.
//-------------------------------------------------------------------------
// Main code : PacMan-EURUSD-15m
//-------------------------------------------------------------------------
// PAC MAN - PIP HUNTER
// EUR / USD (M15)
// By BALMORA74 19.05.2018 - Vonasi modifications 20-5-18 - Sharkool mod 01-9-19

DEFPARAM CumulateOrders = false
DEFPARAM Preloadbars = 4000

TP = 22
SL = 40

PositionSize = 1

Cv2 = RSI[14](close) <= 28
Cv3 = 0
For i = 11 to 14 Do
IF average[8](STD[i](close)) >= STD[i](close[3]) THEN
Cv3 = 1
ENDIF
NEXT

OKSHORT = cv2 and Cv3

IF OKSHORT then
Sellshort PositionSize CONTRACT at market
SET STOP pLOSS SL
SET TARGET PPROFIT TP
ENDIF

//EXIT ZOMBIE TRADE
IF shortOnMarket AND BARINDEX-TRADEINDEX(1)>= 100 and close > TradePrice THEN
EXITSHORT AT MARKET
ENDIF
A good one to watch i agree.
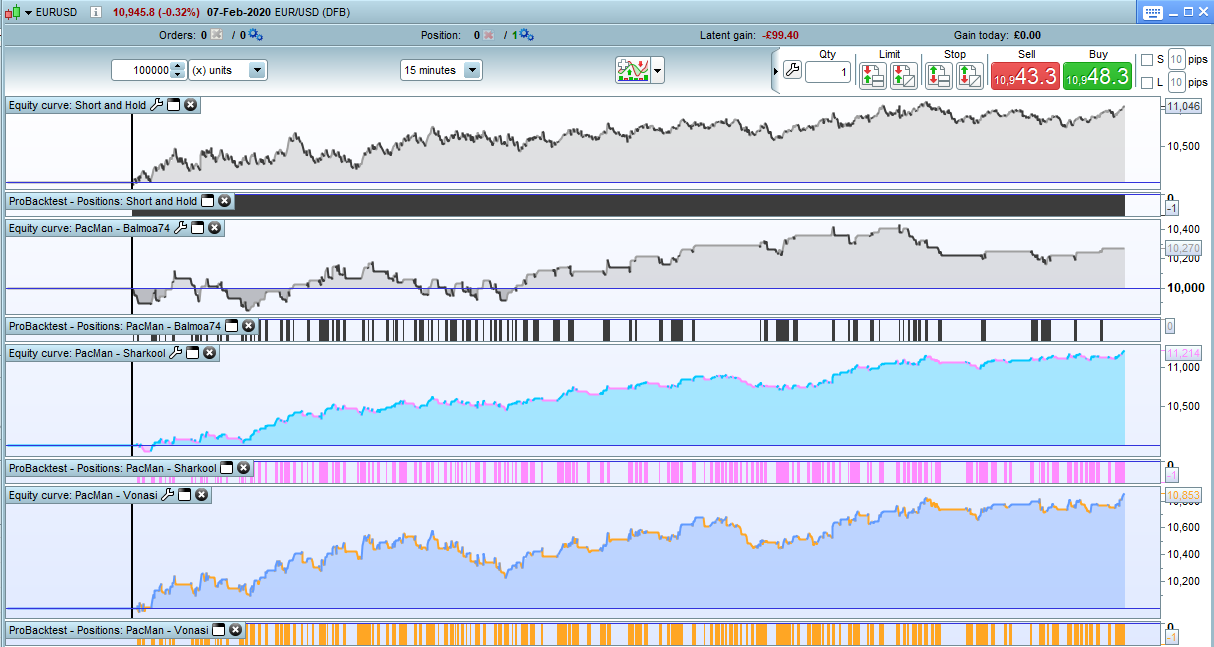
I thought that I would do a side by side comparison.
In the image are the equity curves for our forward test OOS period from 1st May 2018 of Balmora74’s original version, my modified version of his code and now Sharkool’s slightly modified version of mine. Also at the top is ‘short and hold’ to show what the equity curve would be if we just went short and held that position open.
….and the winner is….. ( drum roll)….. Sharkool’s version.
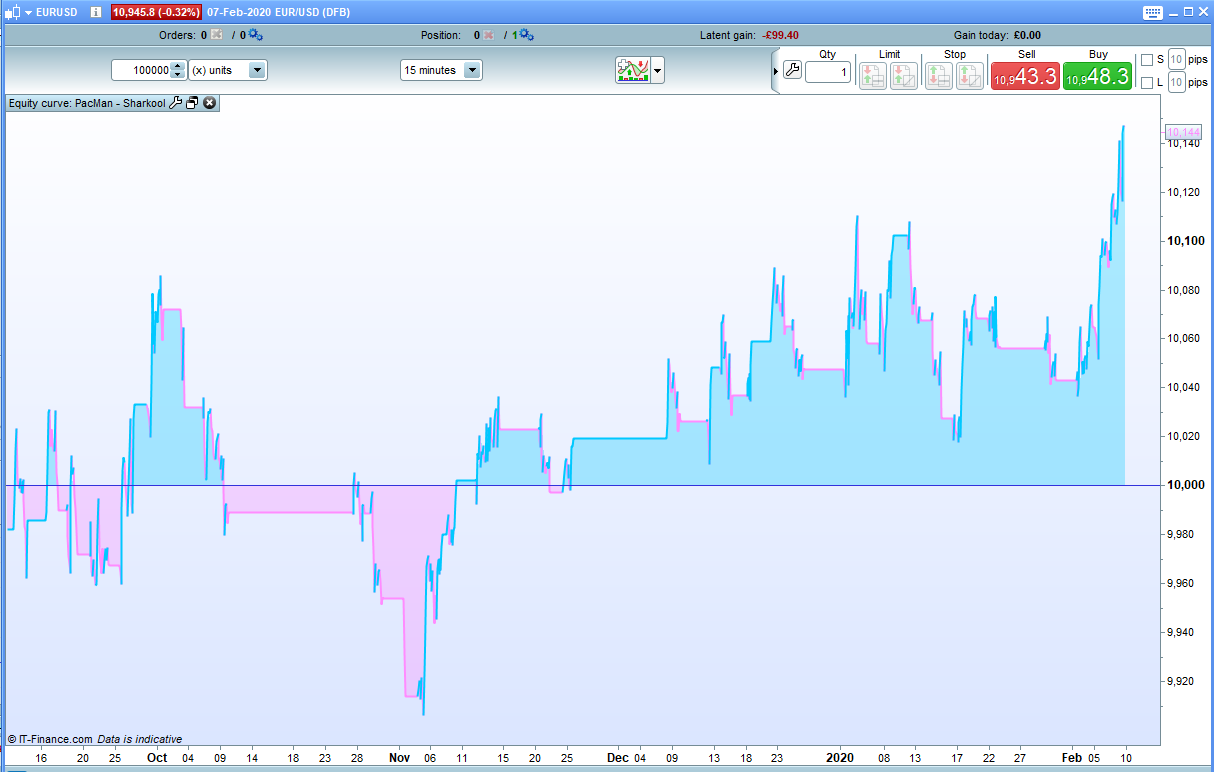
It is possible however that as Sharkool said that he started testing it from 1st Sep 2019 that it has just been fitted to include most of the data in our OOS – so in reality we only have the OOS equity curve shown in the second image for the Sharkool version.
What still worries me is the short and hold equity curve – we still have not had a bull run to properly test the strategies and short and hold would still win hands down compared to any of the strategies tested here – especially if you add in all those overnight fees that you would have been paid.
Just wanted to understand the reasoning behind that part of the code:
//EXIT ZOMBIE TRADE
IF shortOnMarket AND BARINDEX-TRADEINDEX(1)>= 100 and close > TradePrice THEN
EXITSHORT AT MARKET
ENDIF
@Balmora74 is this to avoid incurring overnight fees?
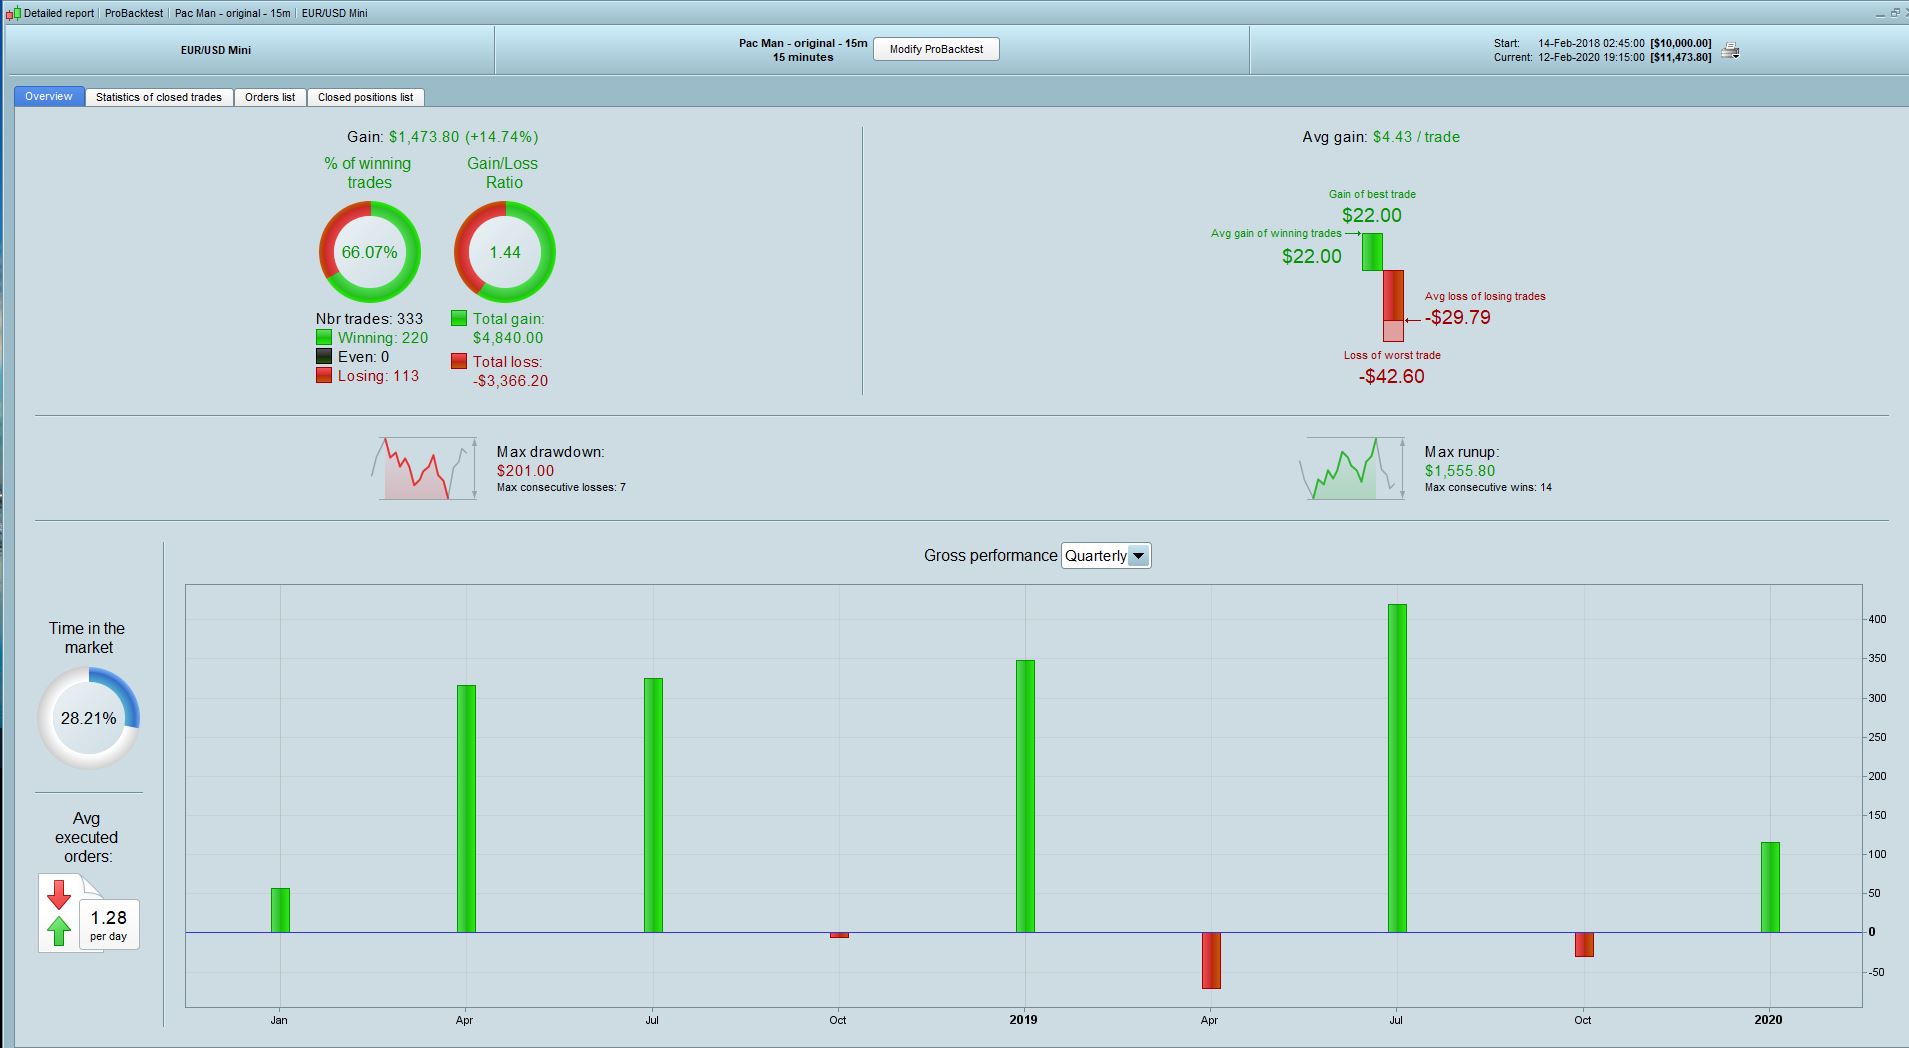
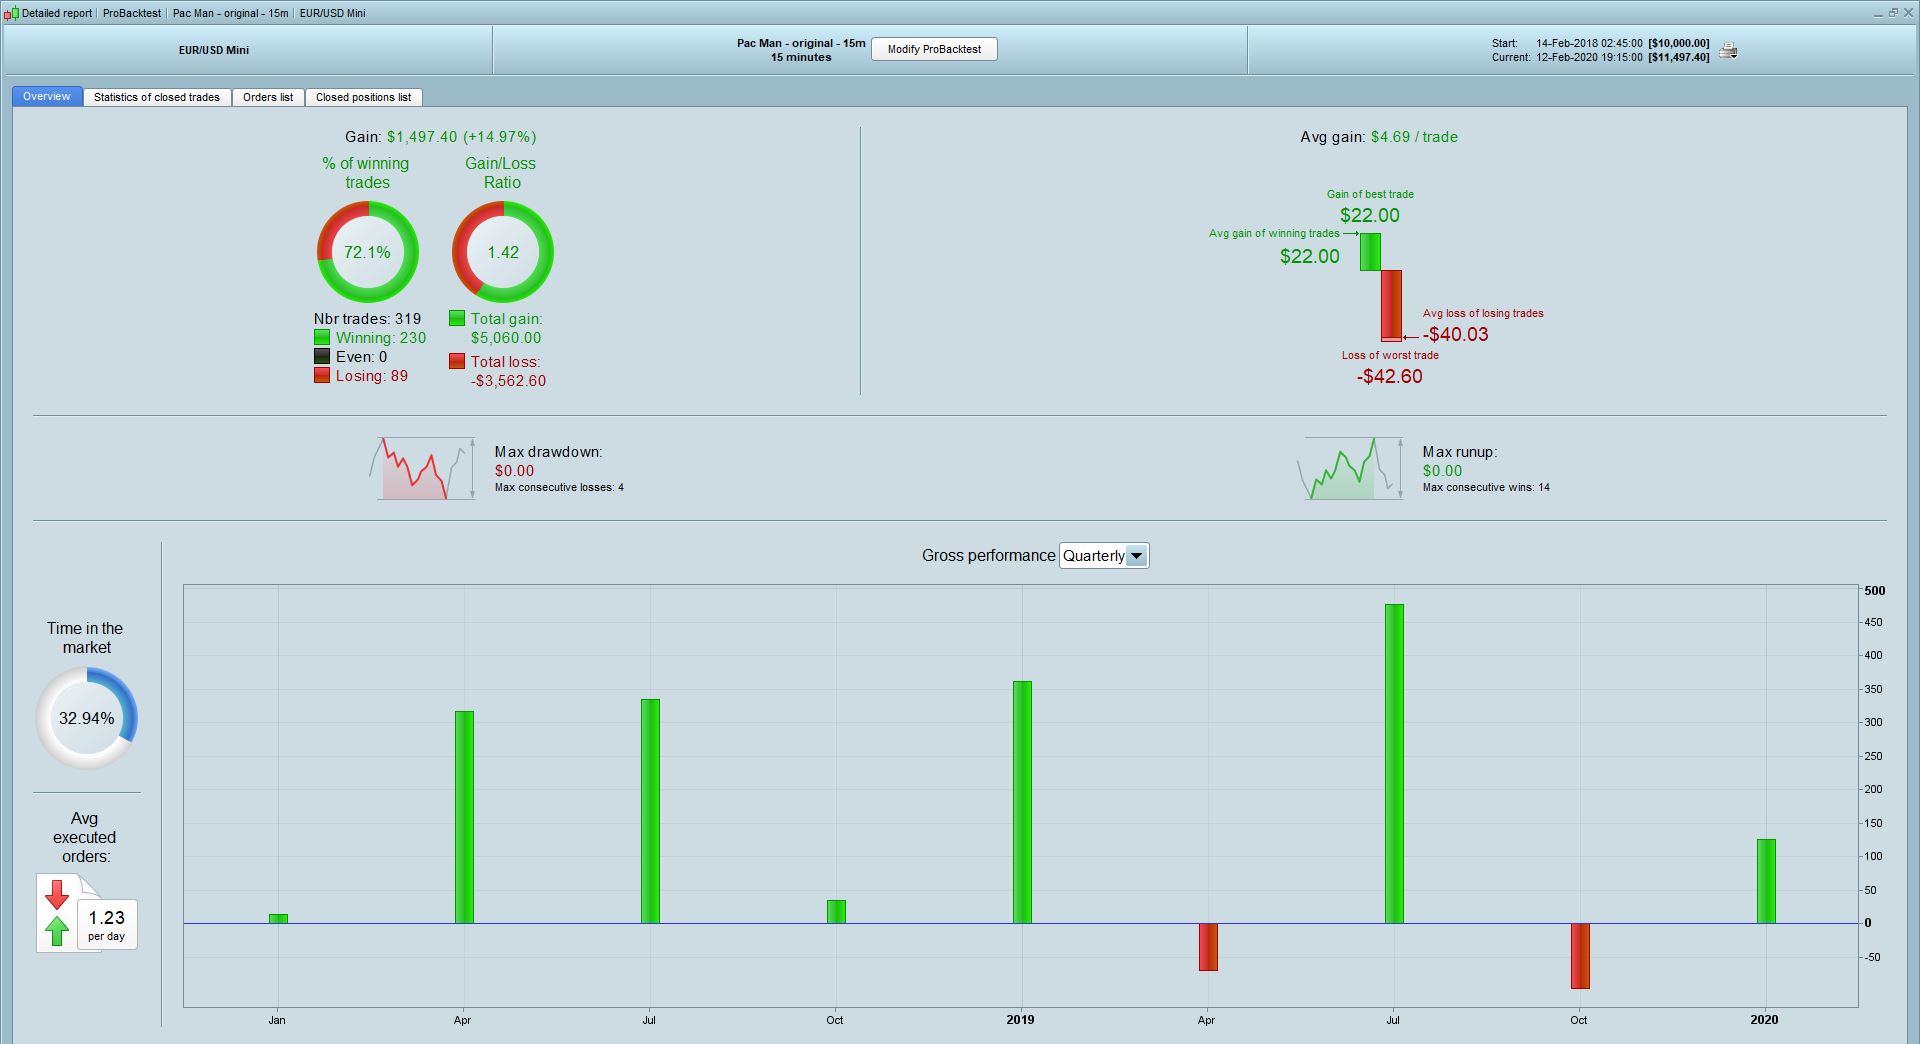
In the version i have, when i remove this the performance increases slightly and so does the %. (see screenshots attached)
That simply exits any trade if it has been on the market for more than 100 candles and is in profit. Sometimes an entry point is not very good and the market just goes sideways for ages and if you hold for too long the reason that you entered becomes completely invalid so you might as well just try to take a small profit if there is one to be had and start looking for a better trade.