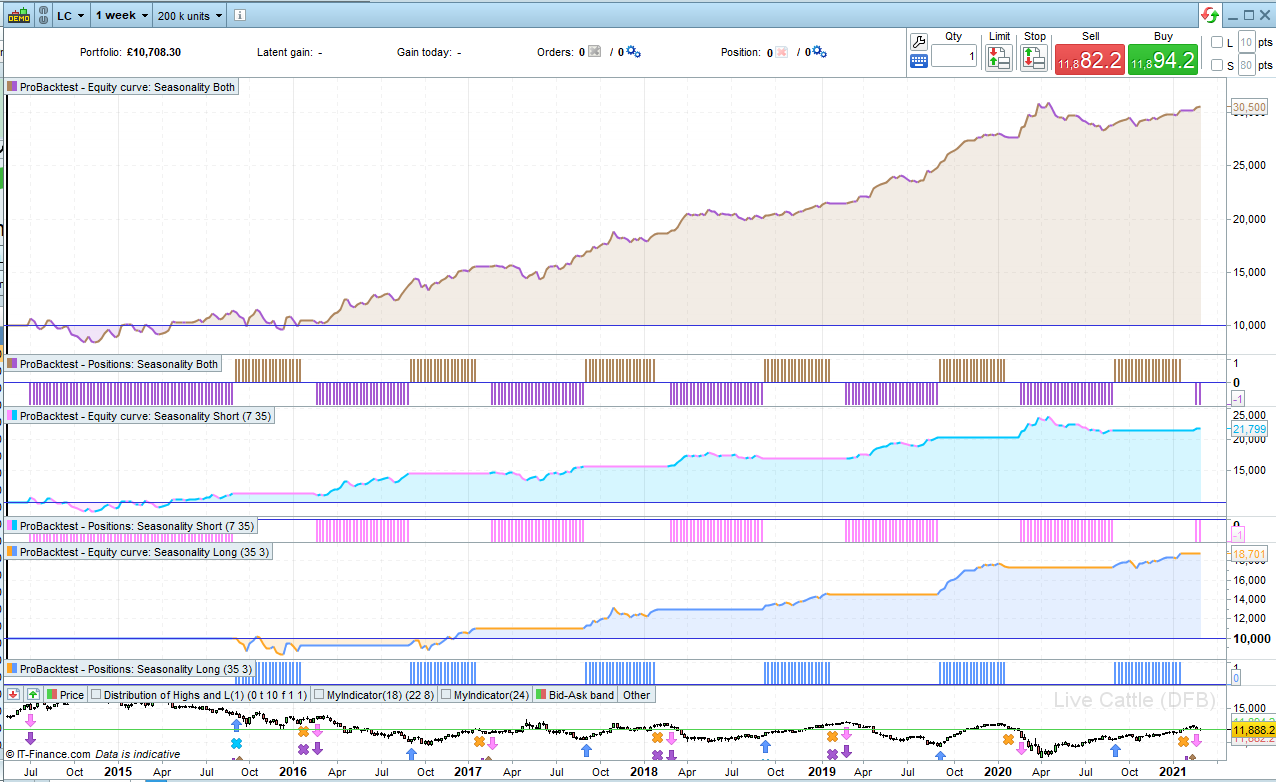
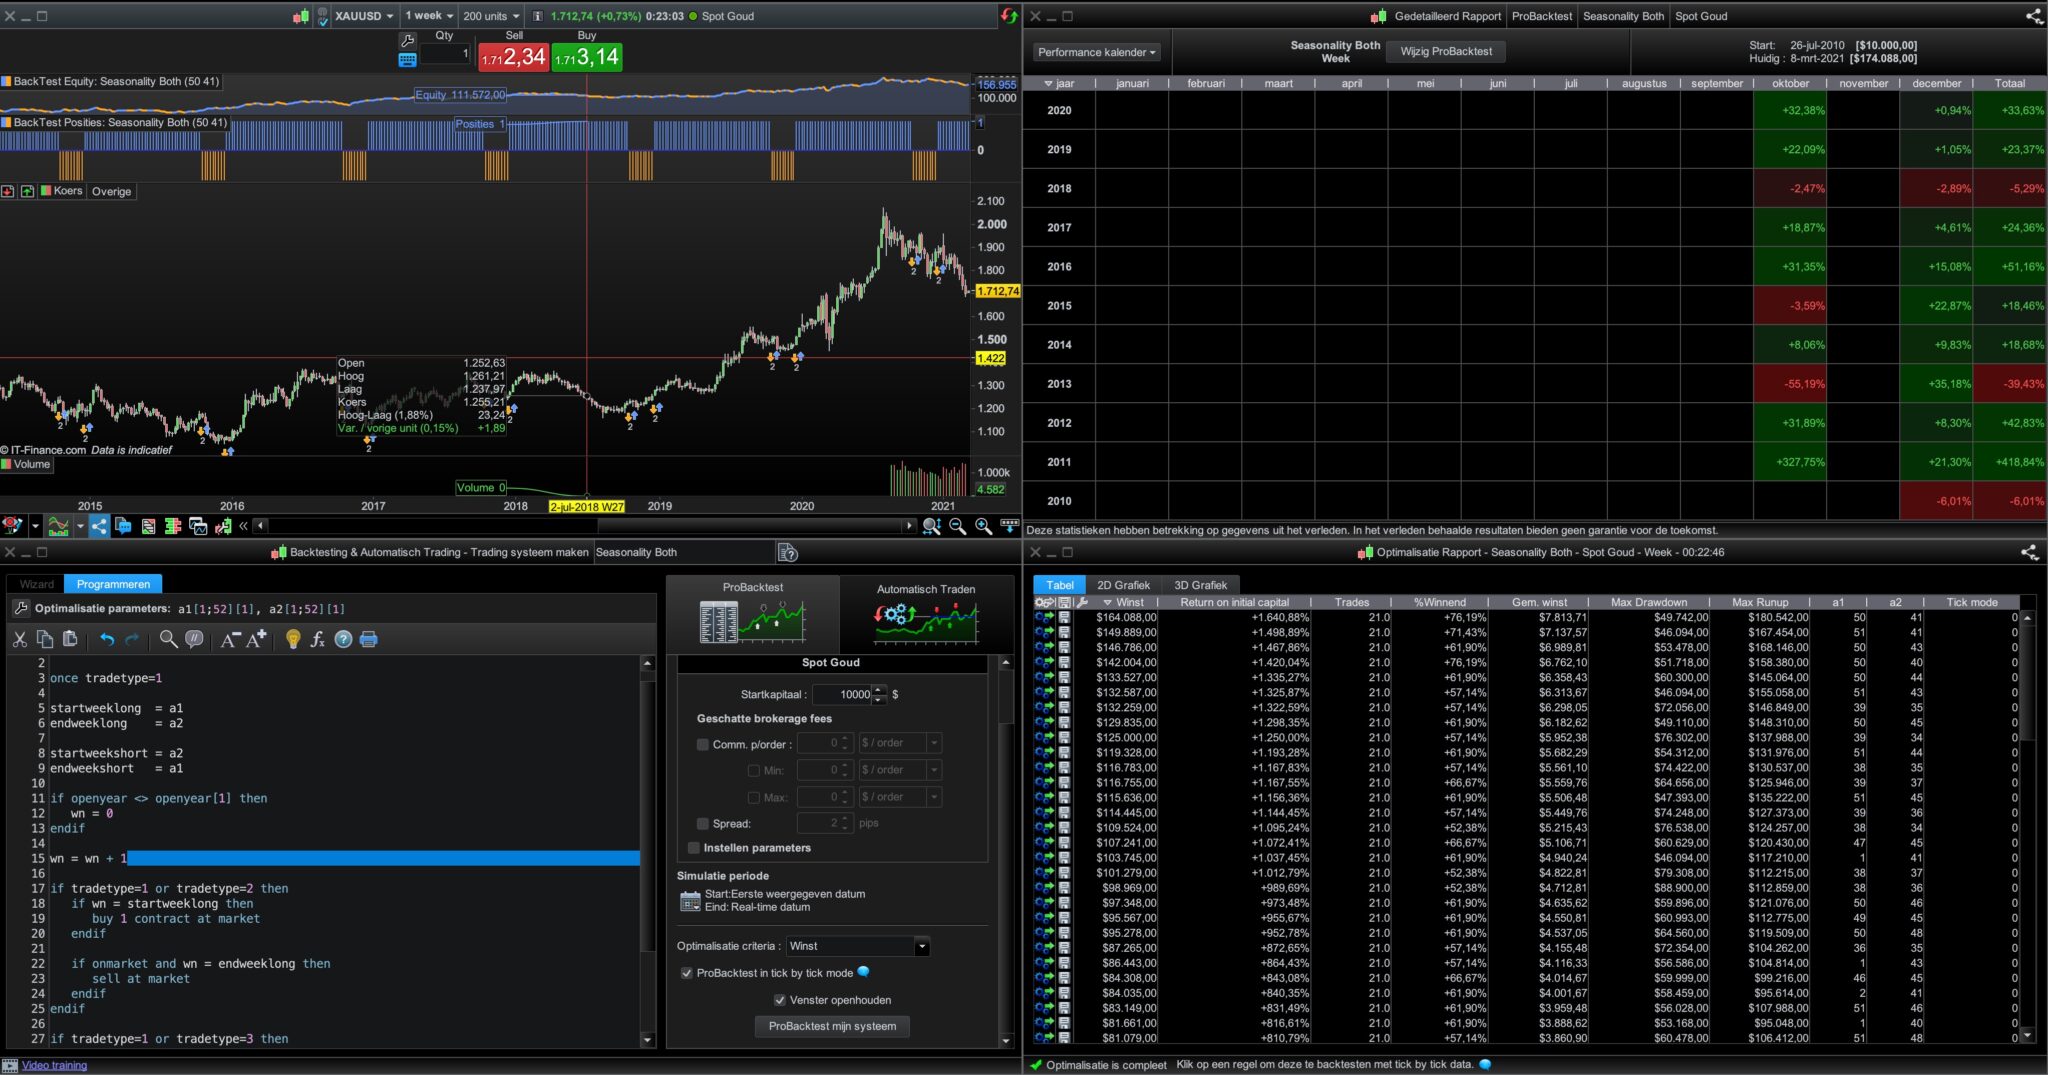
I got to thinking about seasonality again and this got me thinking that I should test to see if there are any sections of a year that if you had been long or short in every year would have returned good results and a nice equity curve. So I coded two very simple strategies that count week numbers and and buy on one week number and sell on another week number. Optimise the two strategies with the variables startweek and endweek with values between 1 and 53 and it will tell you which blocks of weeks have given the best return during the historical data.
Then I created a third strategy that you can enter the best returned values as startweeklong, endweeklong, startweekshort and endweekshort so as to see what the equity curve would have looked like had you been short during the best weeks and long during the best weeks. On my tests I found that the best long weeks rarely clashed with the best short weeks but if you find an instrument where they do then you can’t put those values in the ‘Both’ strategy.
The strategies only work on the weekly chart.
The question up for general discussion is….. is this seasonality or is it just the ultimate curve fit?
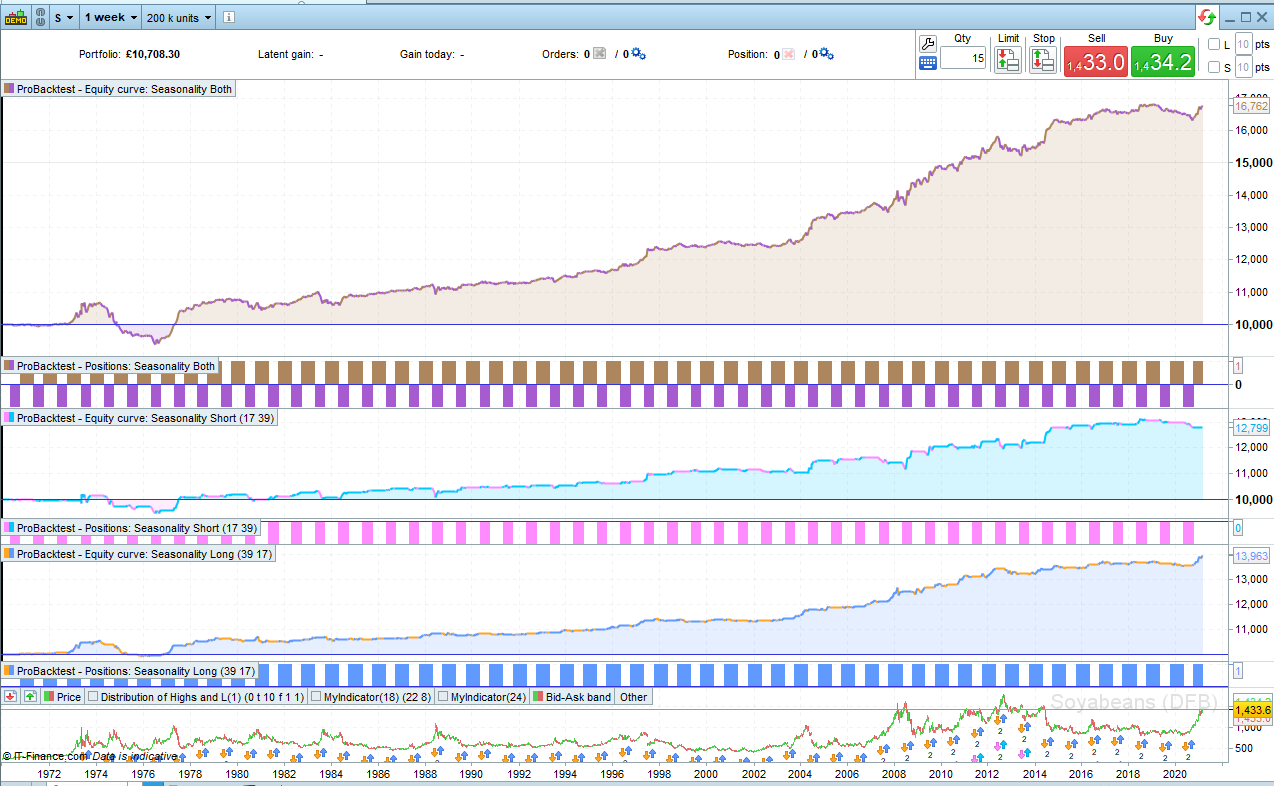
I have attached images of Live Cattle and Soybeans. No spread was used in the tests.
defparam cumulateorders = false

if openyear <> openyear[1] then
wn = 0
endif

wn = wn + 1

if wn = startweek then
buy 1 contract at market
endif

if onmarket and wn = endweek then
sell at market
endif
defparam cumulateorders = false

if openyear <> openyear[1] then
wn = 0
endif

wn = wn + 1

if wn = startweek then
sellshort 1 contract at market
endif

if onmarket and wn = endweek then
exitshort at market
endif
defparam cumulateorders = false

startweekshort = 17
endweekshort = 39
startweeklong = 39
endweeklong = 17

if openyear <> openyear[1] then
wn = 0
endif

wn = wn + 1

if wn = startweeklong then
buy 1 contract at market
endif

if onmarket and wn = endweeklong then
sell at market
endif

if wn = startweekshort then
sellshort 1 contract at market
endif

if onmarket and wn = endweekshort then
exitshort at market
endif
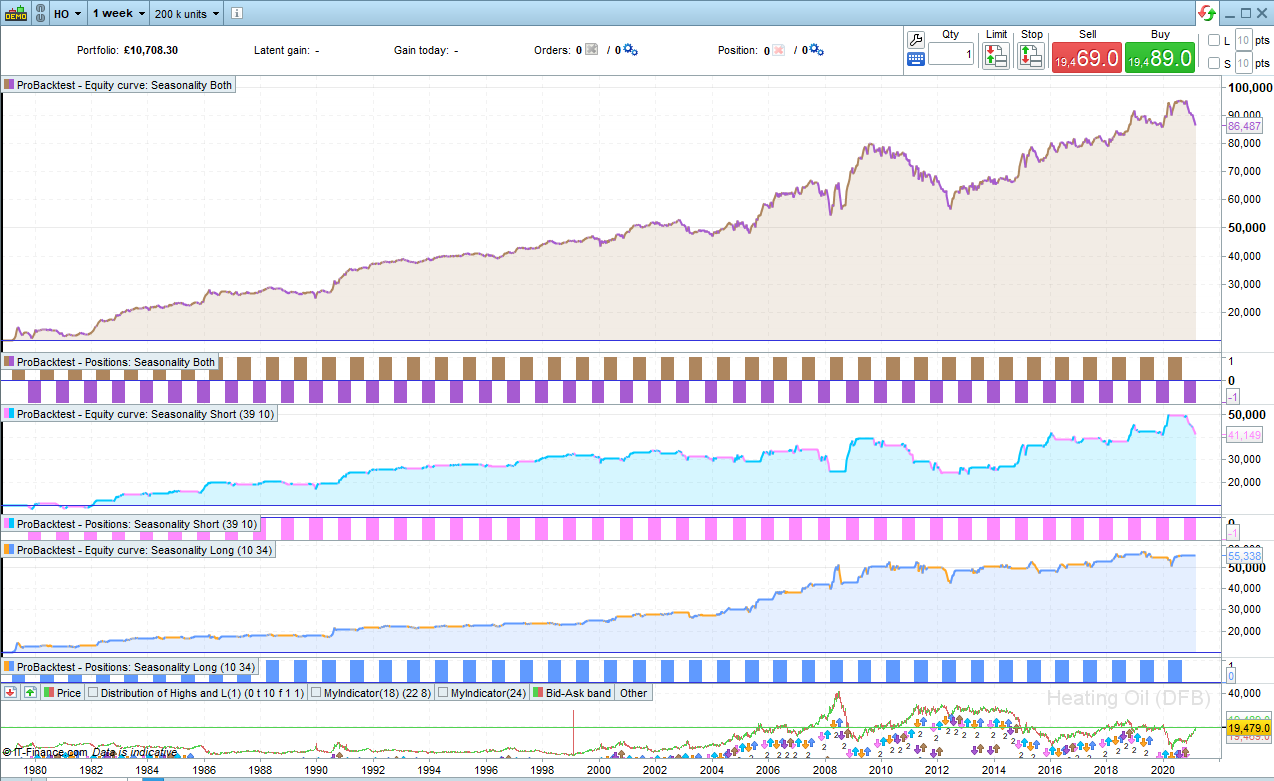
Here is another example. This time it is Heating Oil.
 Paul
PaulParticipant
Master
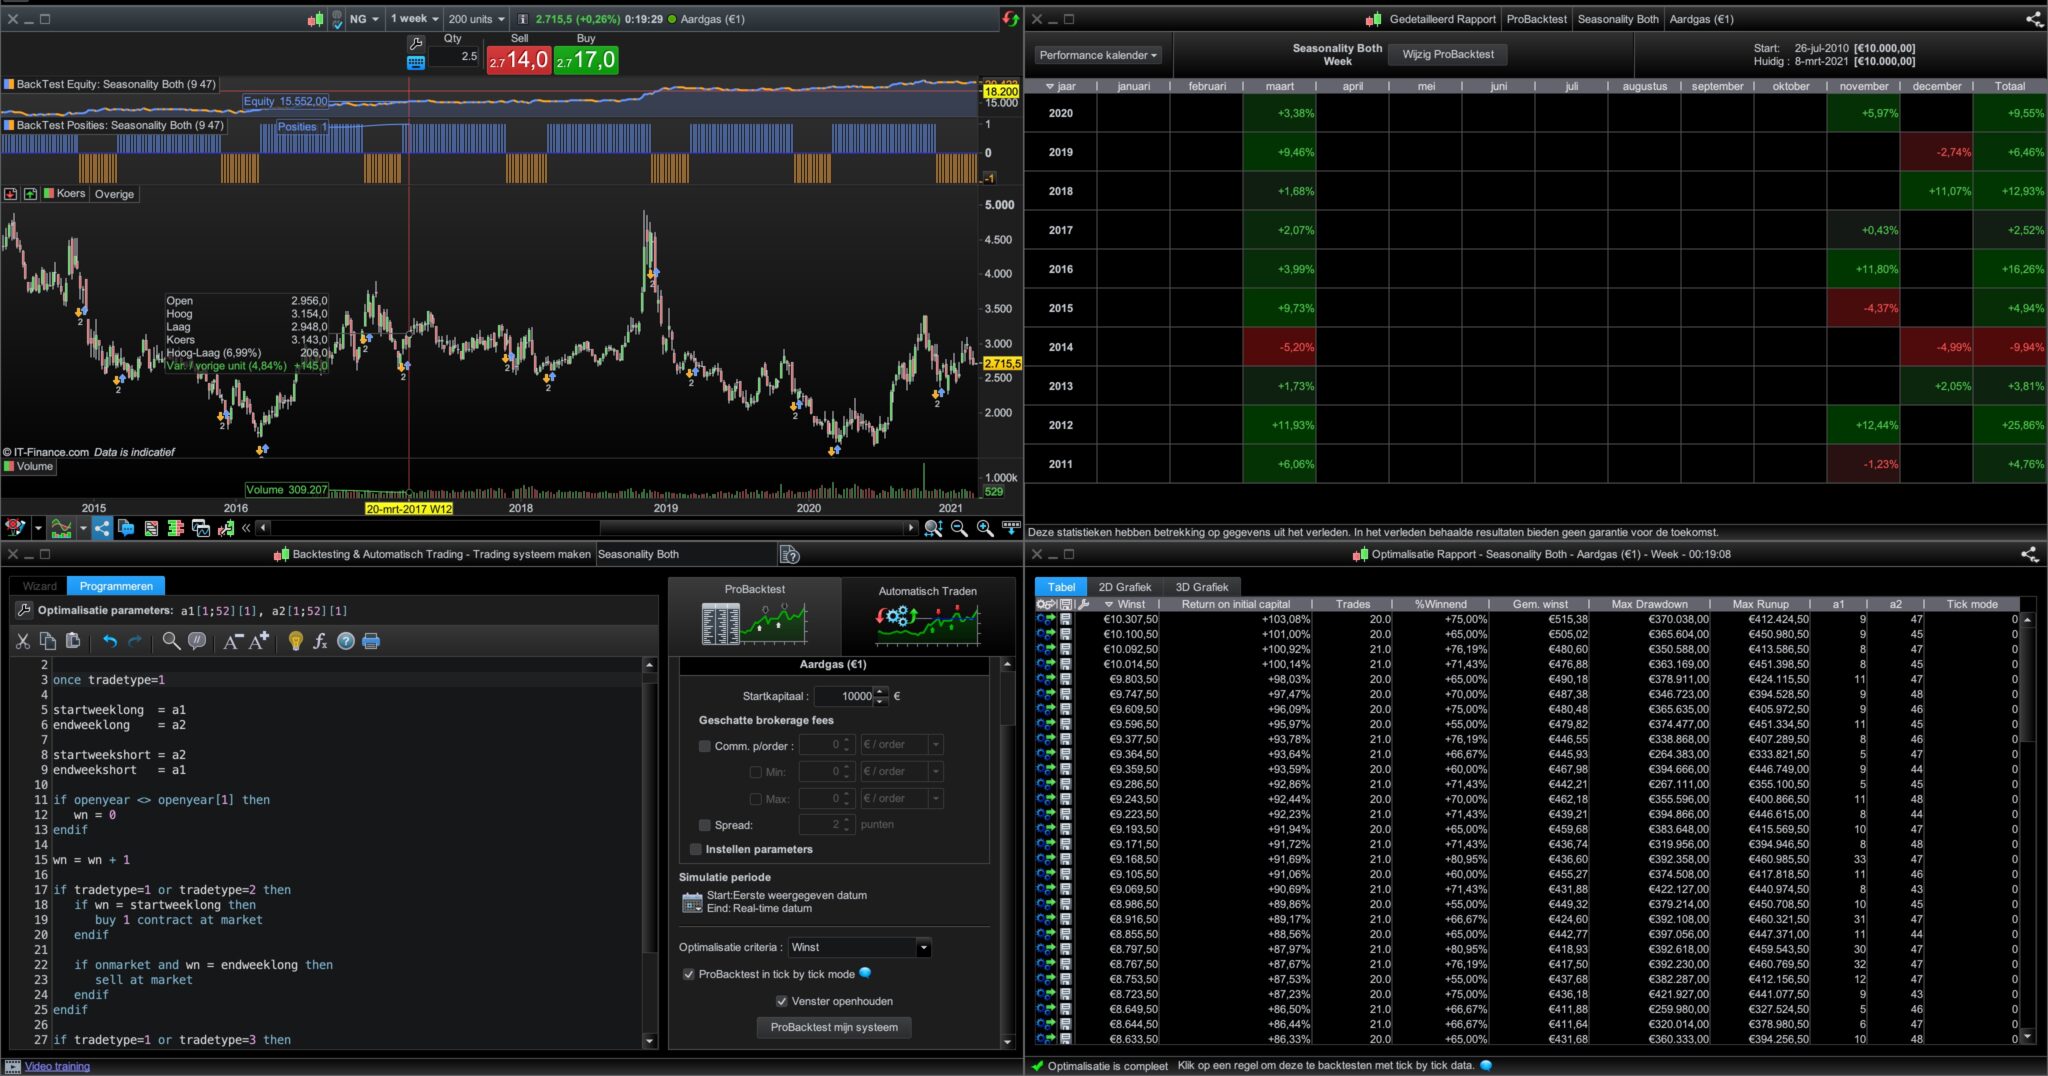
interesting. I put it also on a few.
maybe a month is interesting too and you can expand parameters to enter again long after short i.e. more easily. Not sure yet if usefull.
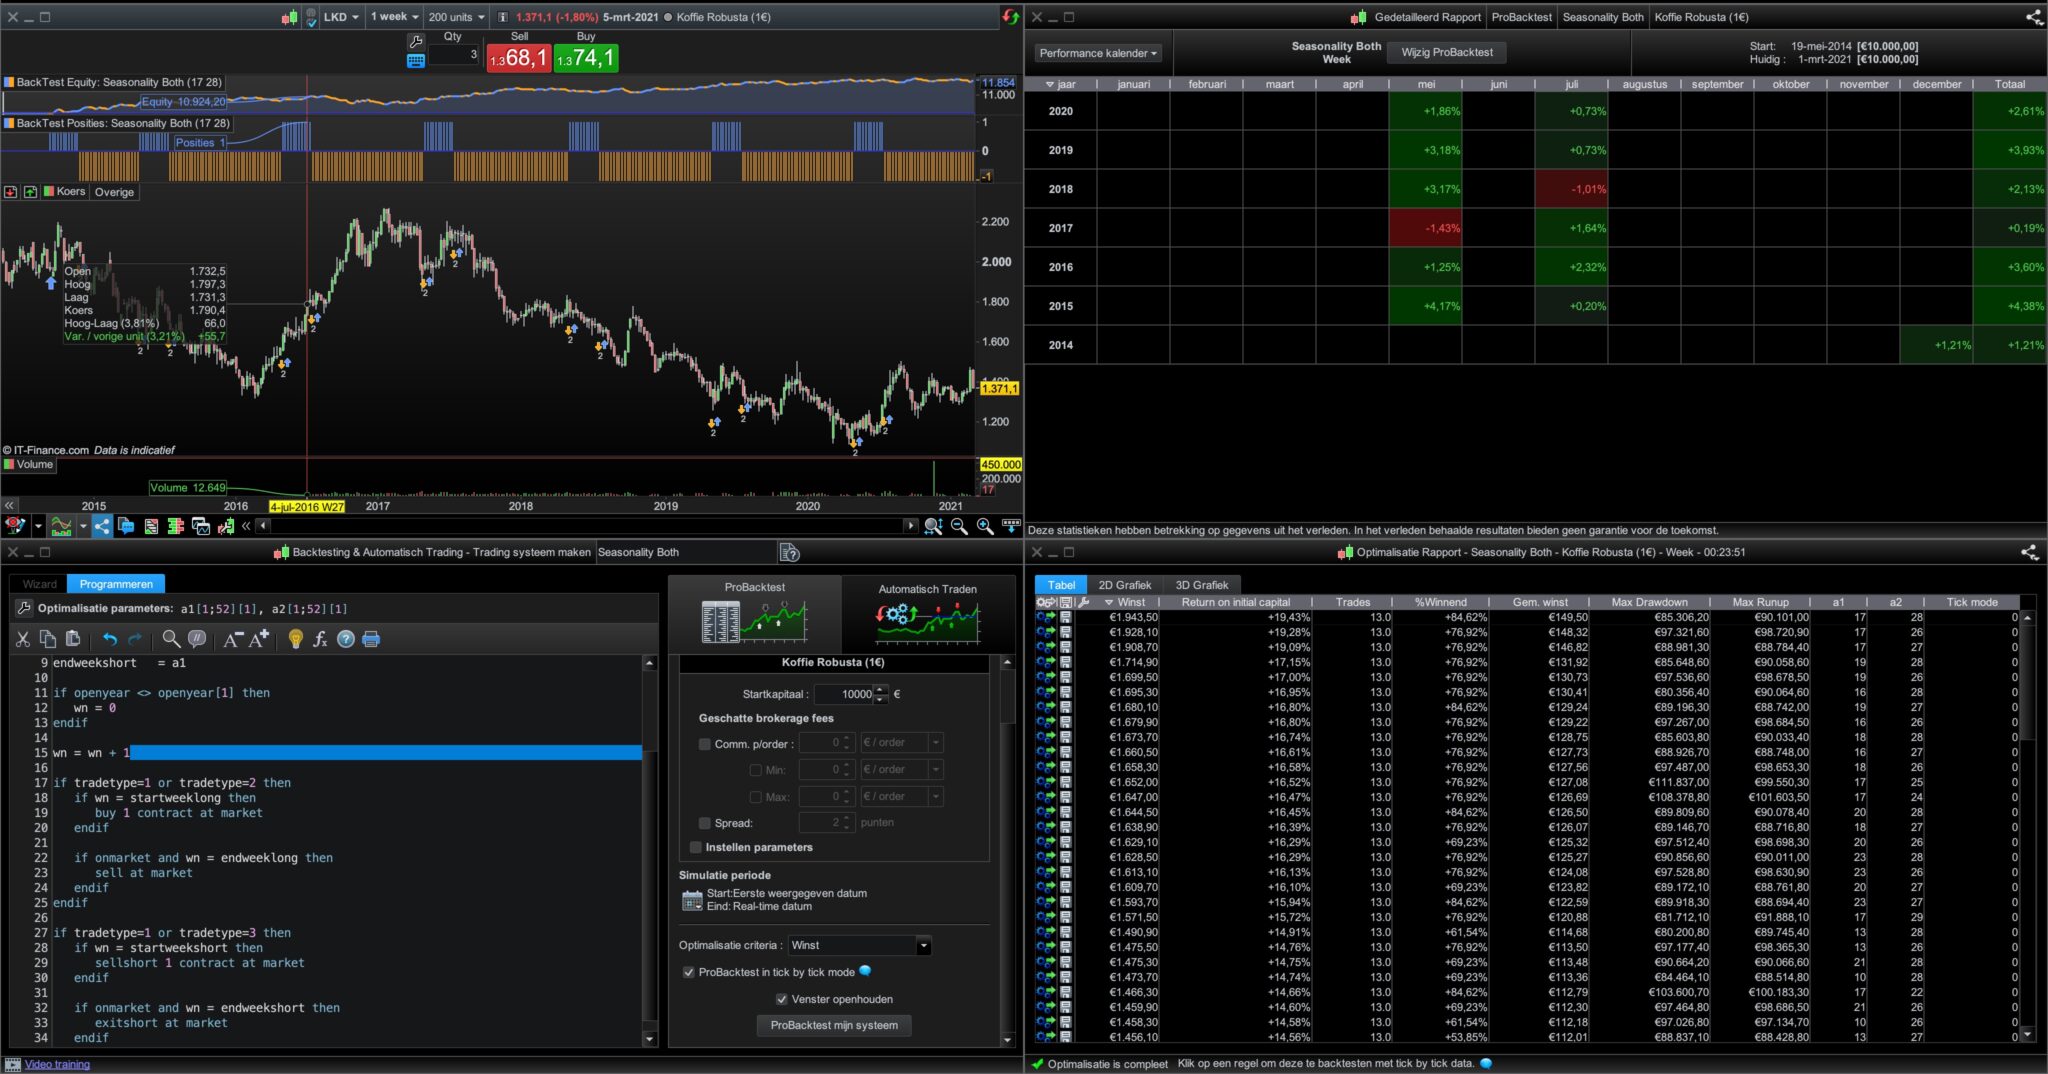
Here are a few pics with use long&short
PaulParticipant
Master
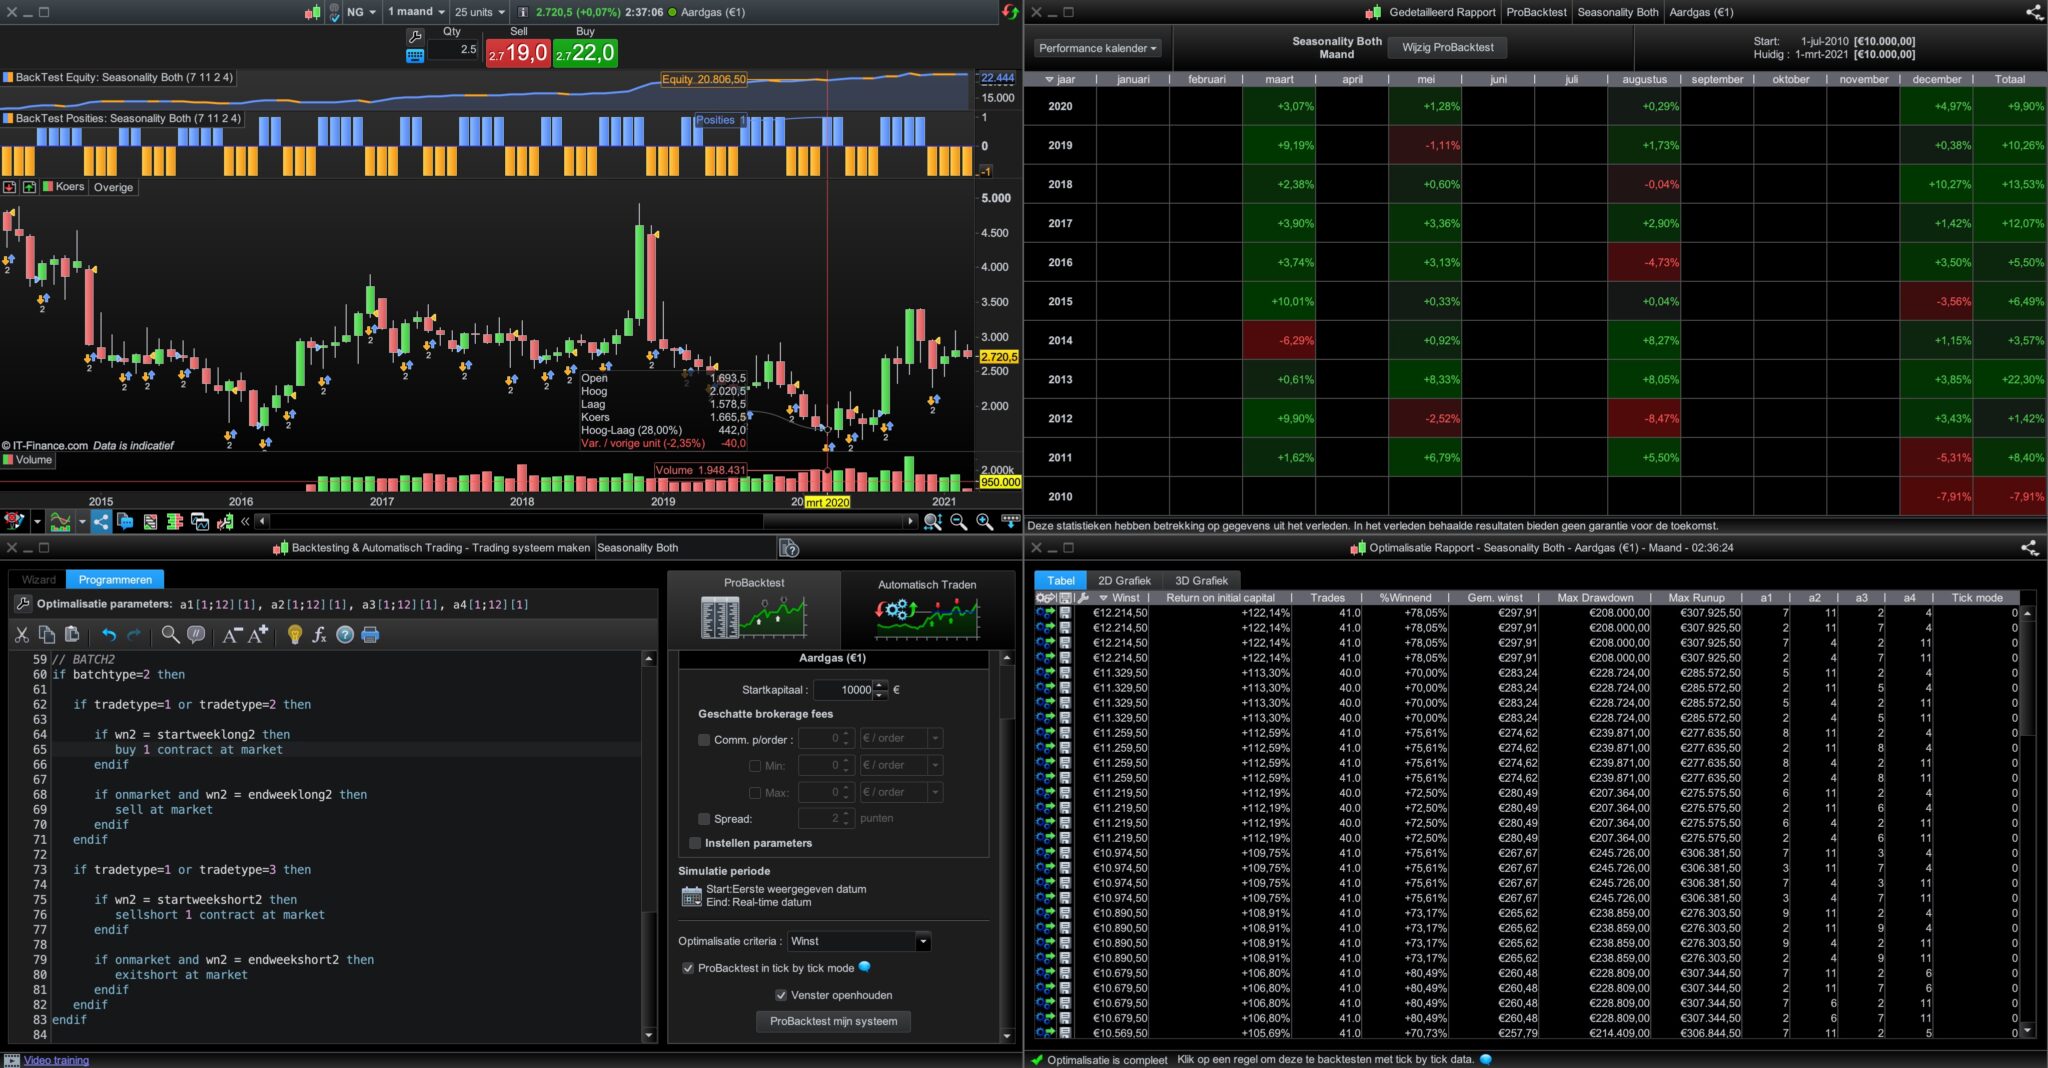
It’s is just more curvefitting and defeats the goal of the code. This is a bit what I had in mind.
now i.e. 4 turnarounds a year are possible, or long only twice a year certain periods.
monthy bars, 25 units
defparam cumulateorders = false

//batchtype=1 then set a3 & a4 not to optimise
//batchtype=2 can comment out the buy/sellshort rows as variation in batch2?
//optimise a1 t/m a4 range 1-12

once tradetype=1 //1 both, 2 long, 3 short
once batchtype=2 //batchtyp 1 solo with only parameters a1,a2

//first batch
startweeklong  = a1
endweeklong    = a2

startweekshort = a2
endweekshort   = a1

// second batch
startweeklong2  = a3
endweeklong2    = a4

startweekshort2 = a4
endweekshort2   = a3

if openyear <> openyear[1] then
wn = 0
wn2 =0
endif

wn = wn + 1
wn2= wn2+ 1

// BATCH1
if batchtype=1 or batchtype=2 then

if tradetype=1 or tradetype=2 then

if wn = startweeklong  then
buy 1 contract at market
endif

if onmarket and wn = endweeklong then
sell at market
endif
endif

if tradetype=1 or tradetype=3 then

if wn = startweekshort then
sellshort 1 contract at market
endif

if onmarket and wn = endweekshort then
exitshort at market
endif

endif
endif

// BATCH2
if batchtype=2 then

if tradetype=1 or tradetype=2 then

if wn2 = startweeklong2 then
buy 1 contract at market
endif

if onmarket and wn2 = endweeklong2 then
sell at market
endif
endif

if tradetype=1 or tradetype=3 then

if wn2 = startweekshort2 then
sellshort 1 contract at market
endif

if onmarket and wn2 = endweekshort2 then
exitshort at market
endif
endif
endif
Thanks for that code Paul. I had considered something similar but decided that (as you suggest) it was just increased curve fitting. I also felt that if a commodity was to be seasonal then it was likely to only have two periods – one where being short the commodity was wise and the other where being long the commodity was wise due to seasonal supply and demand caused by weather and/or crop growing seasons.
I think that on some truly seasonal commodities the equity curves highlight nicely what a good return one could have got just by being long and short in time with the seasons. What I don’t like the look of is the fact that a lot of the equity curves seem to have negative dips on the most recent data which makes me think that perhaps seasonality as a market force is declining and also that perhaps the nice previous equity curves are just quite simply a lovely curve fit.
Still if one was to be trading a commodity that the test shows to produce a nice equity curve then having only long strategies at one part of the year and only short on another part of the year seems like a sensible filter that should improve win rates and performance/returns.
PaulParticipant
Master
Yes, but even with a nice equitycurve as you describe in you lowest part, there are not many trades to have it rely on. Long one part of the year, short the other had me make this variation because sometimes it just holds to a position while the market is trending against it, perhaps eventually becoming winning.
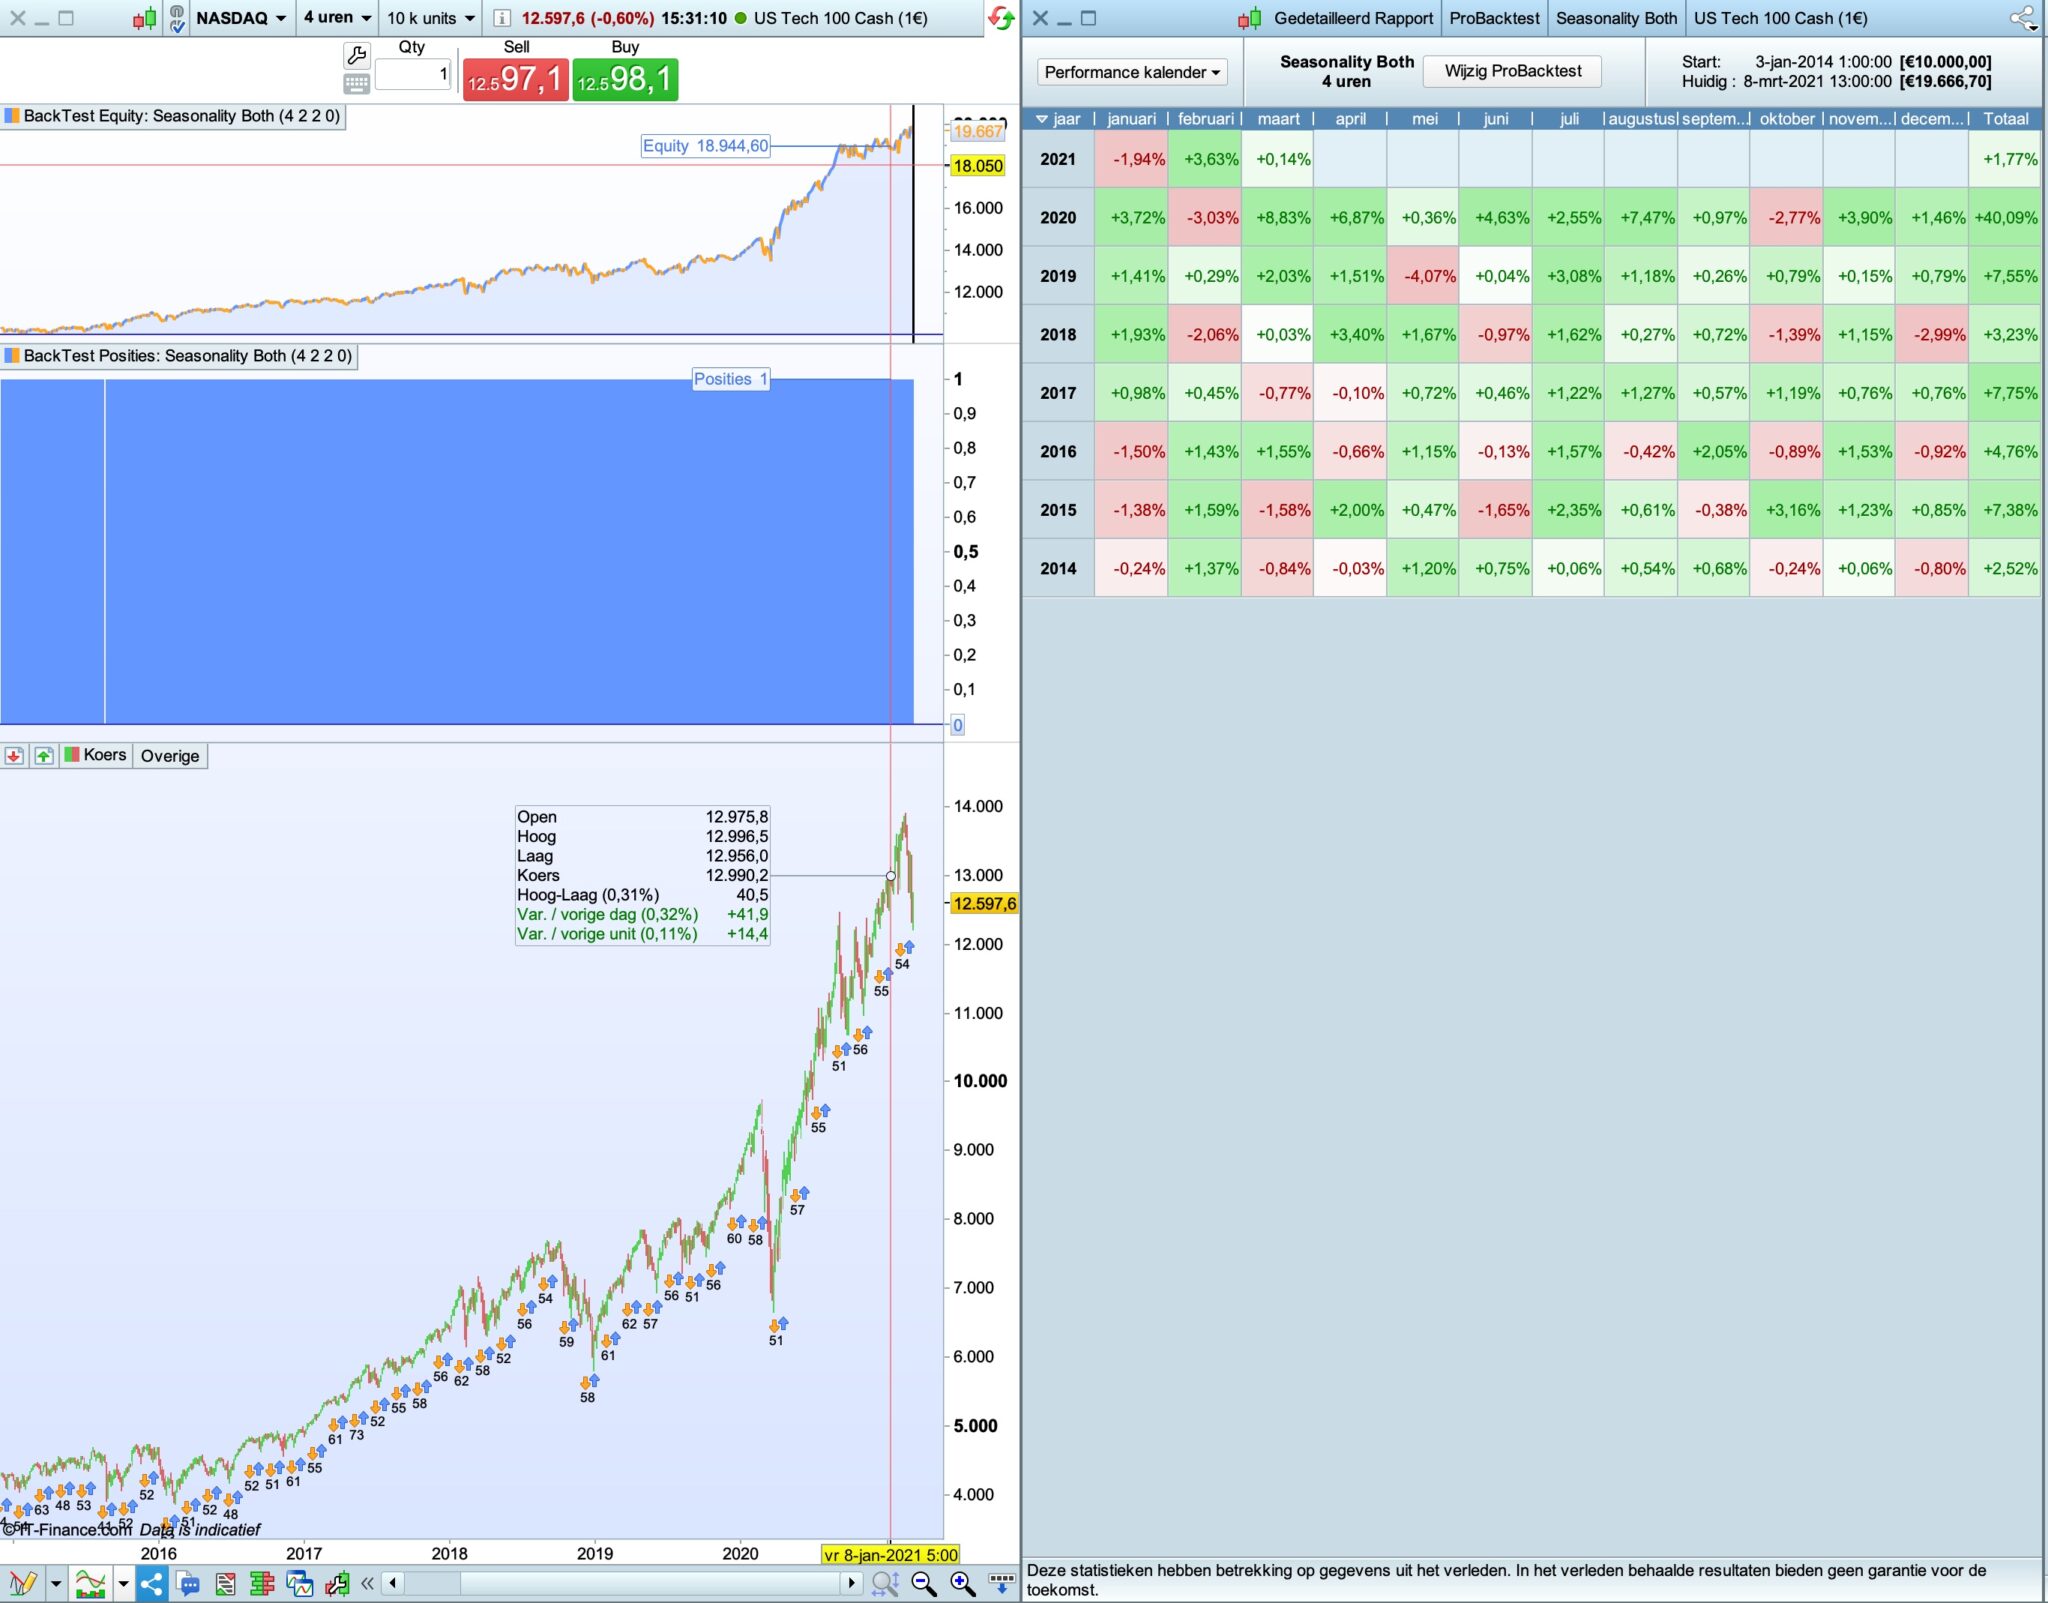
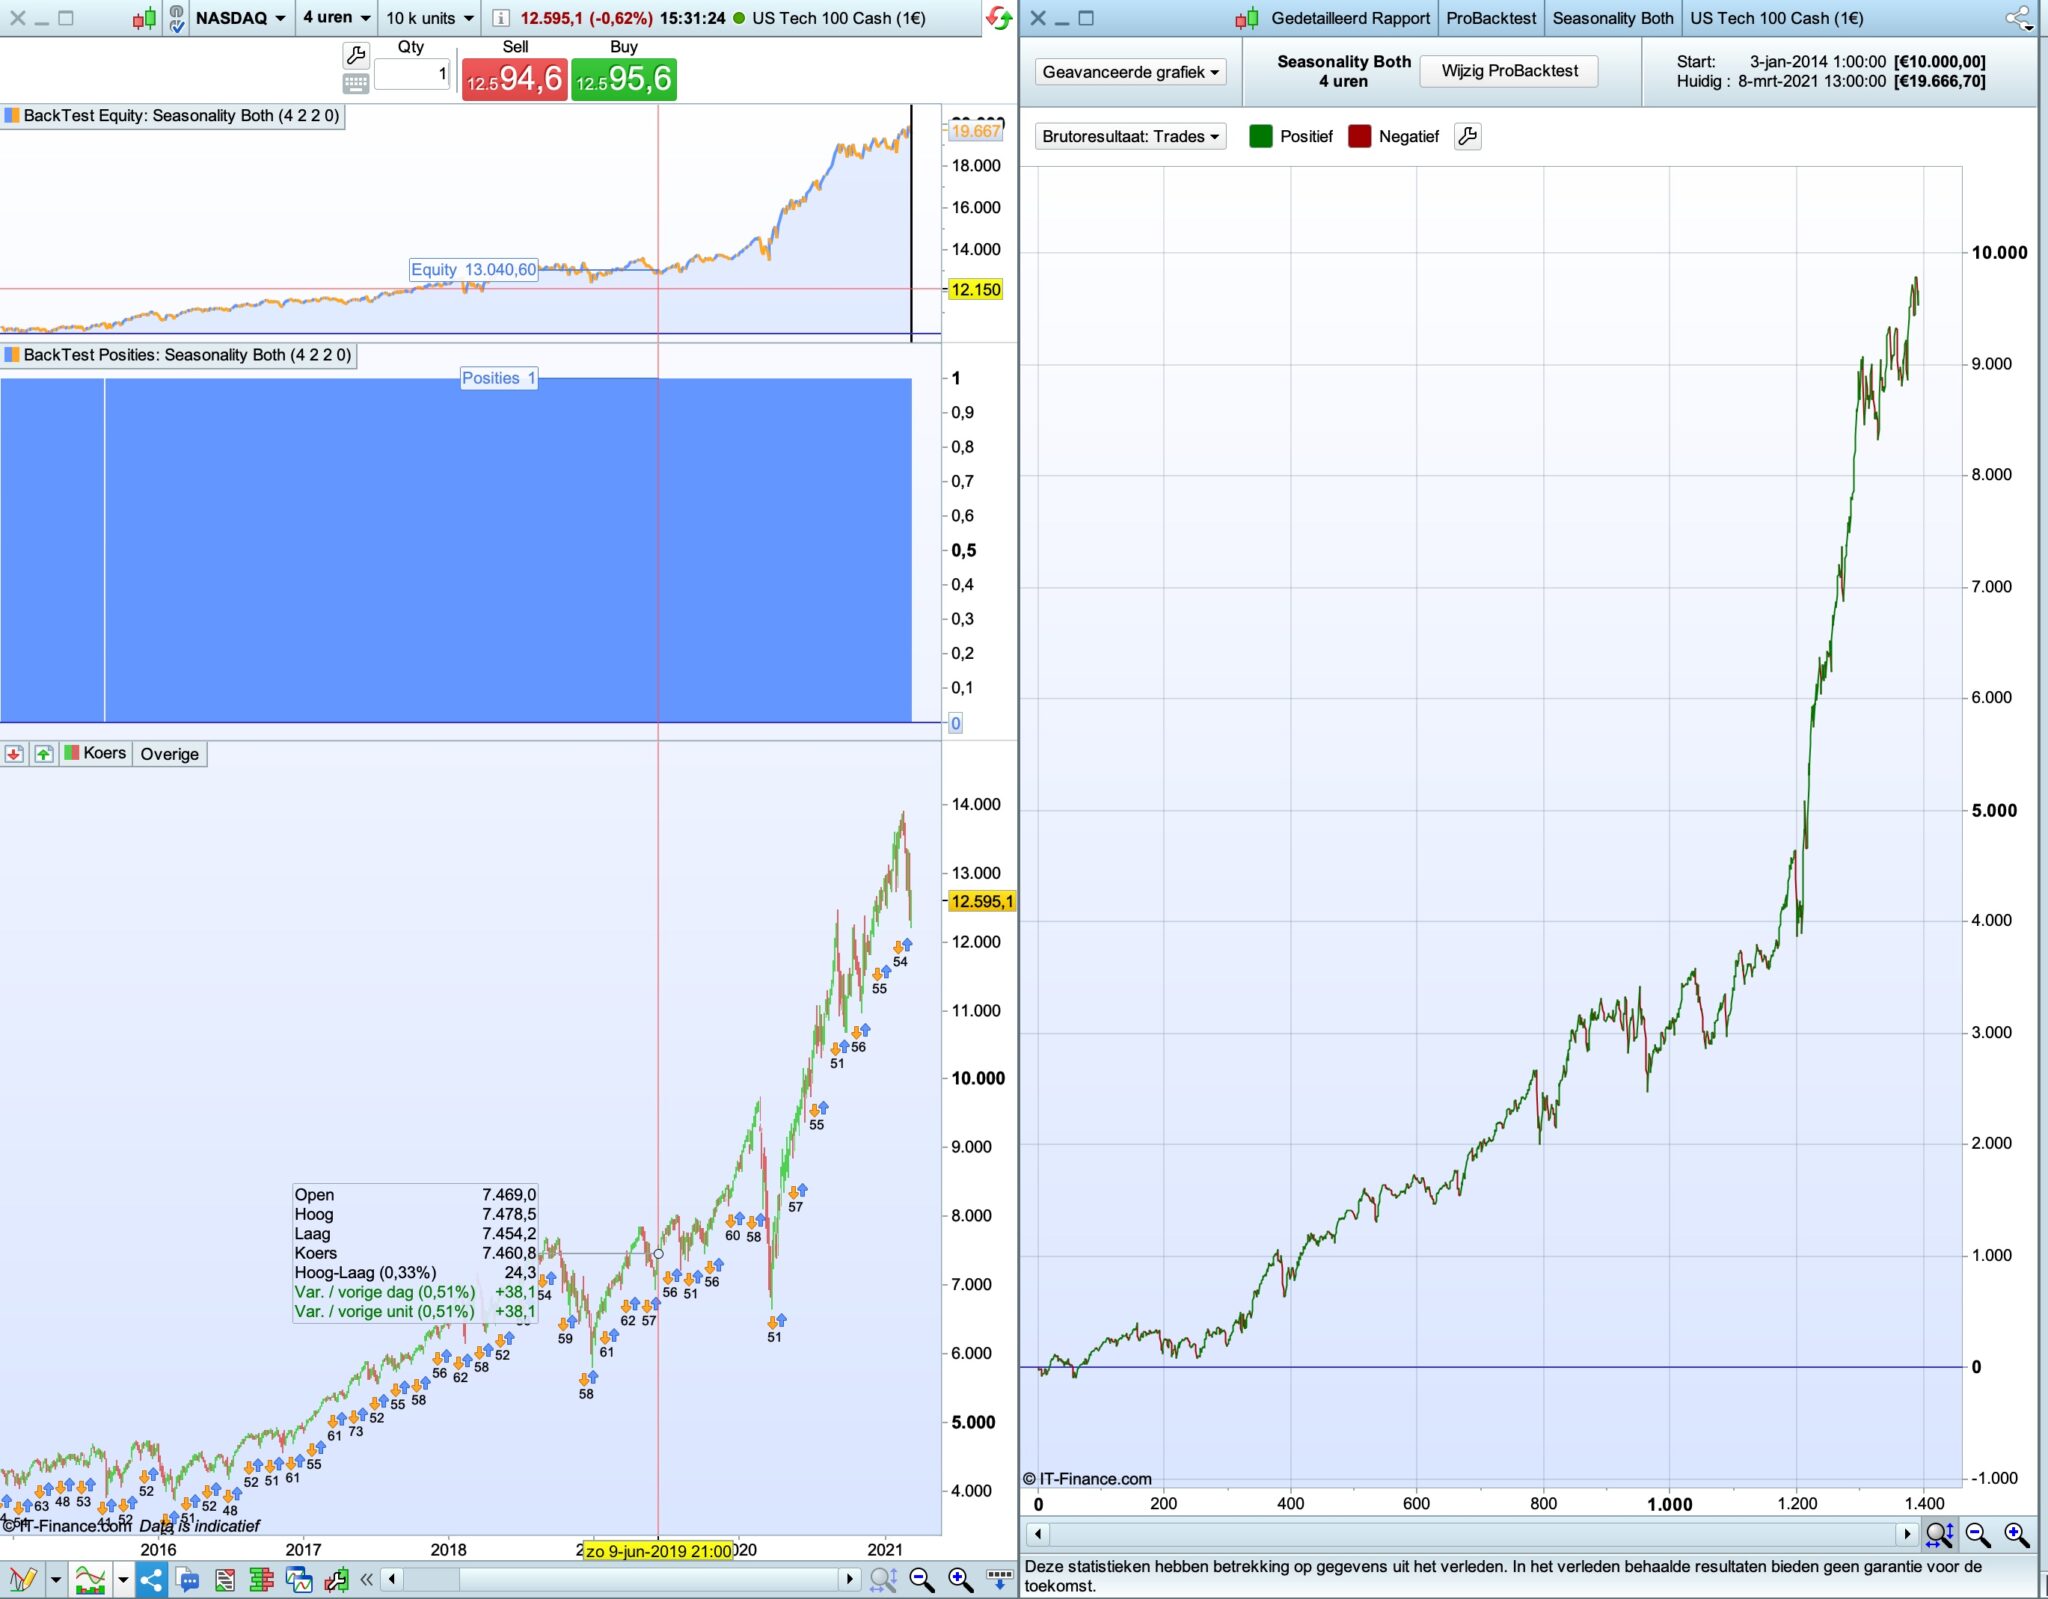
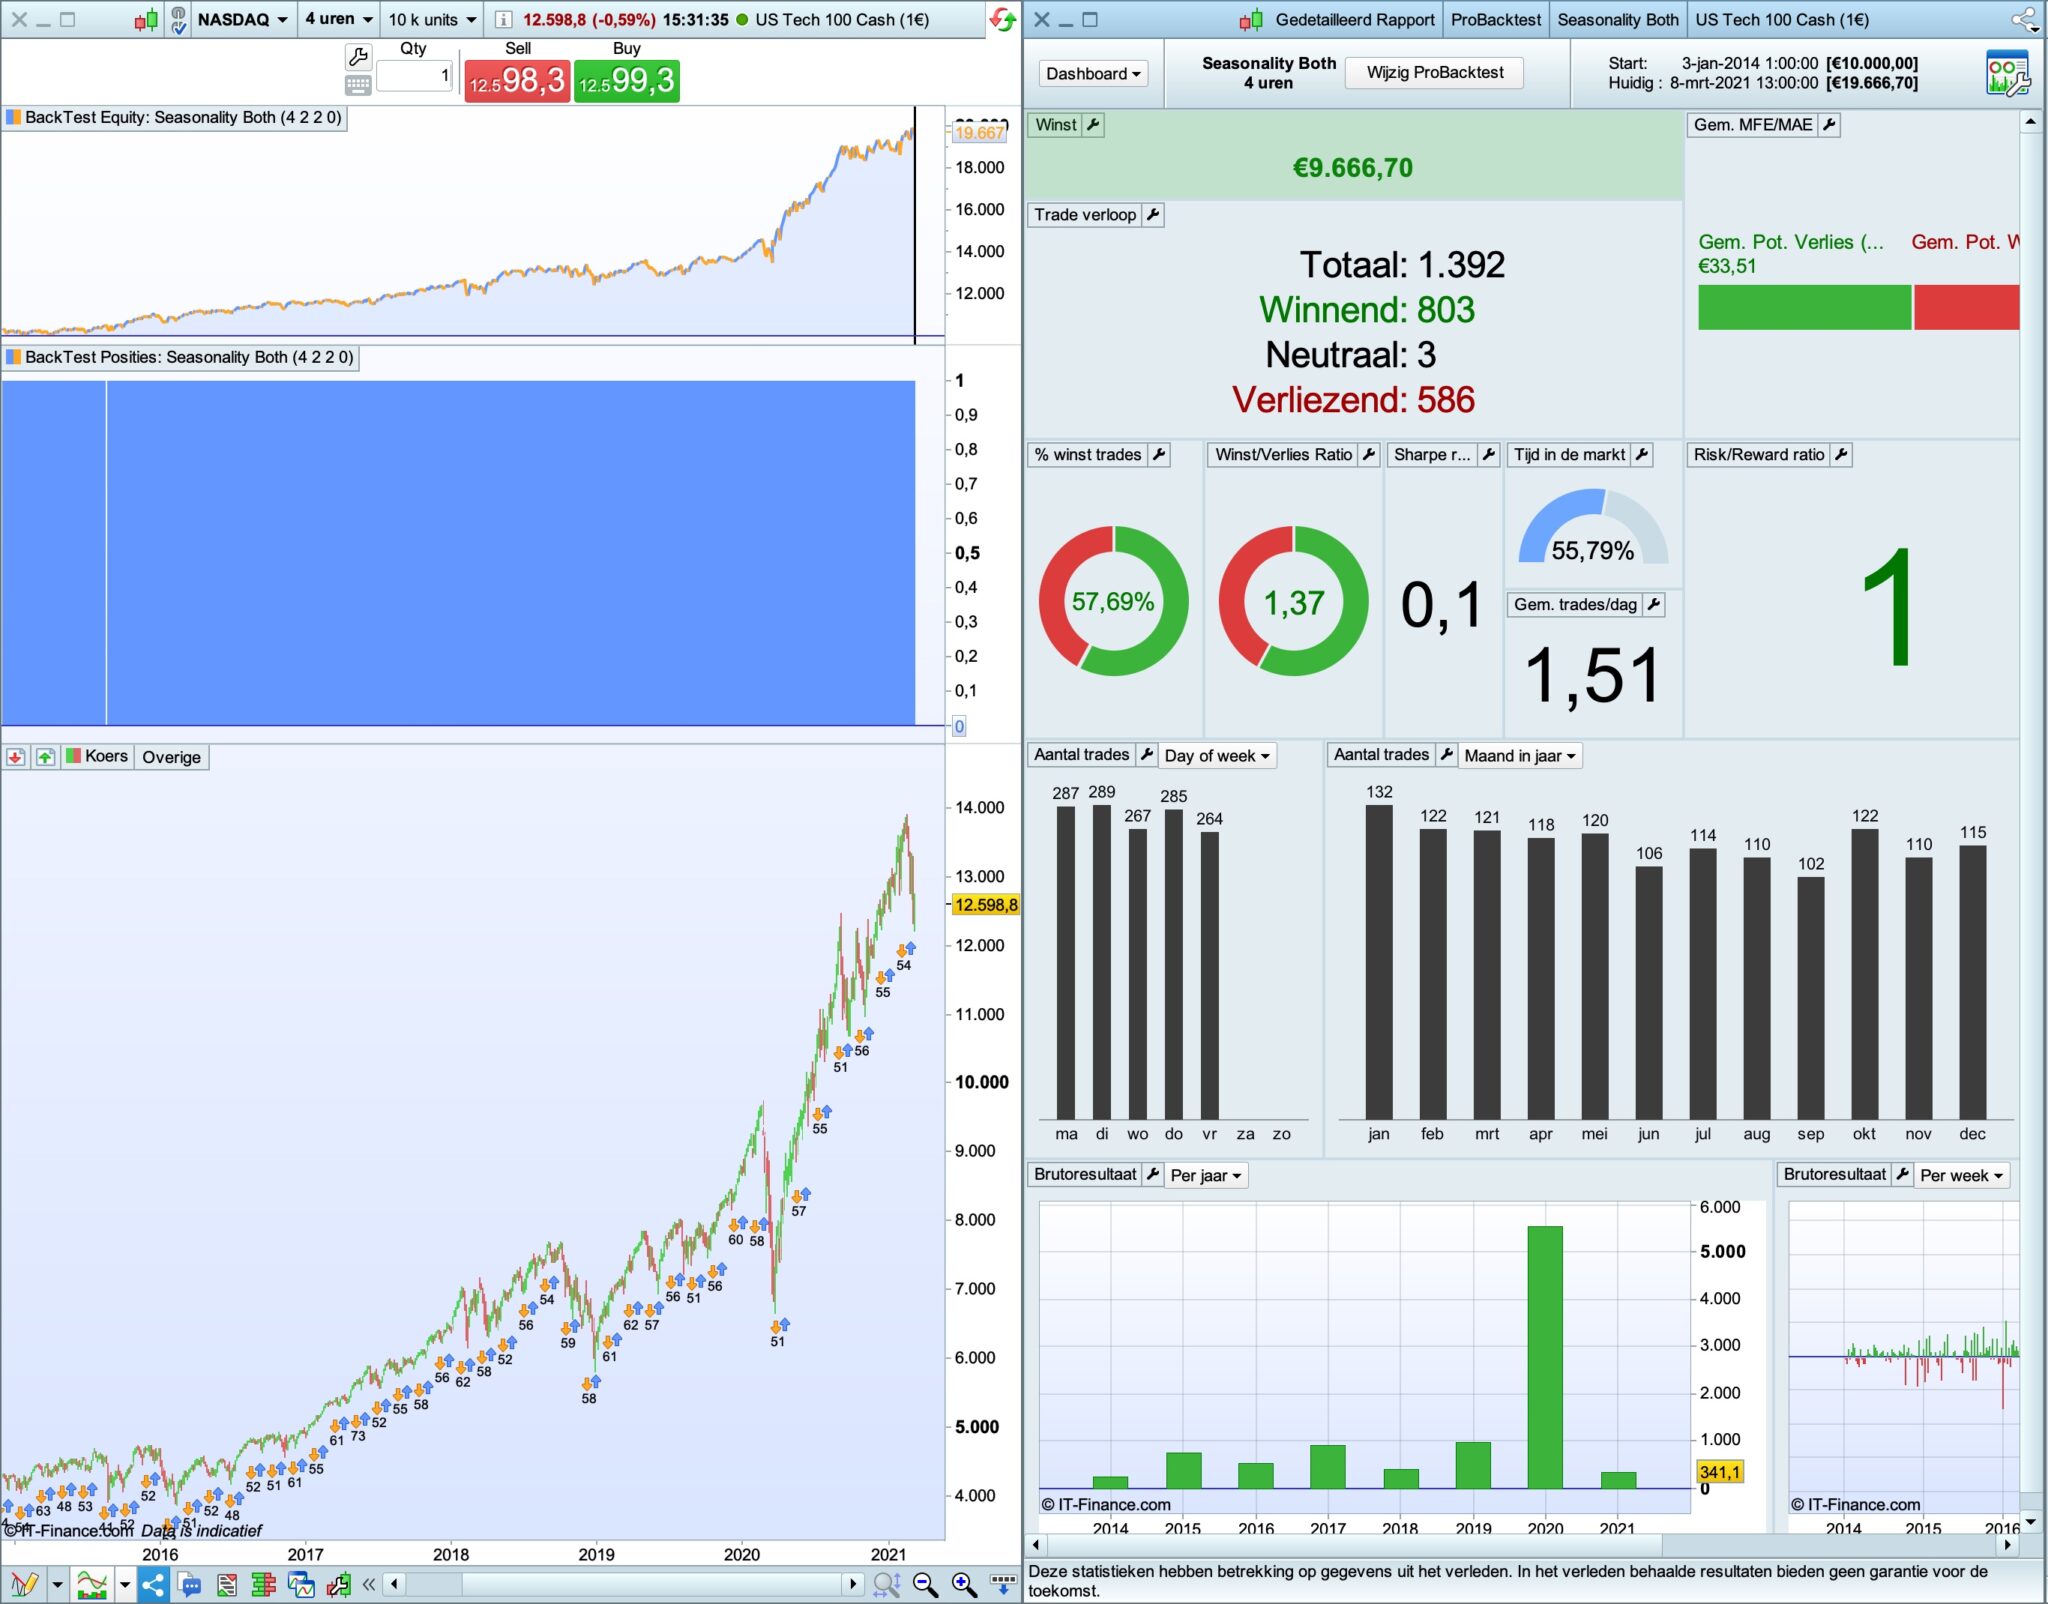
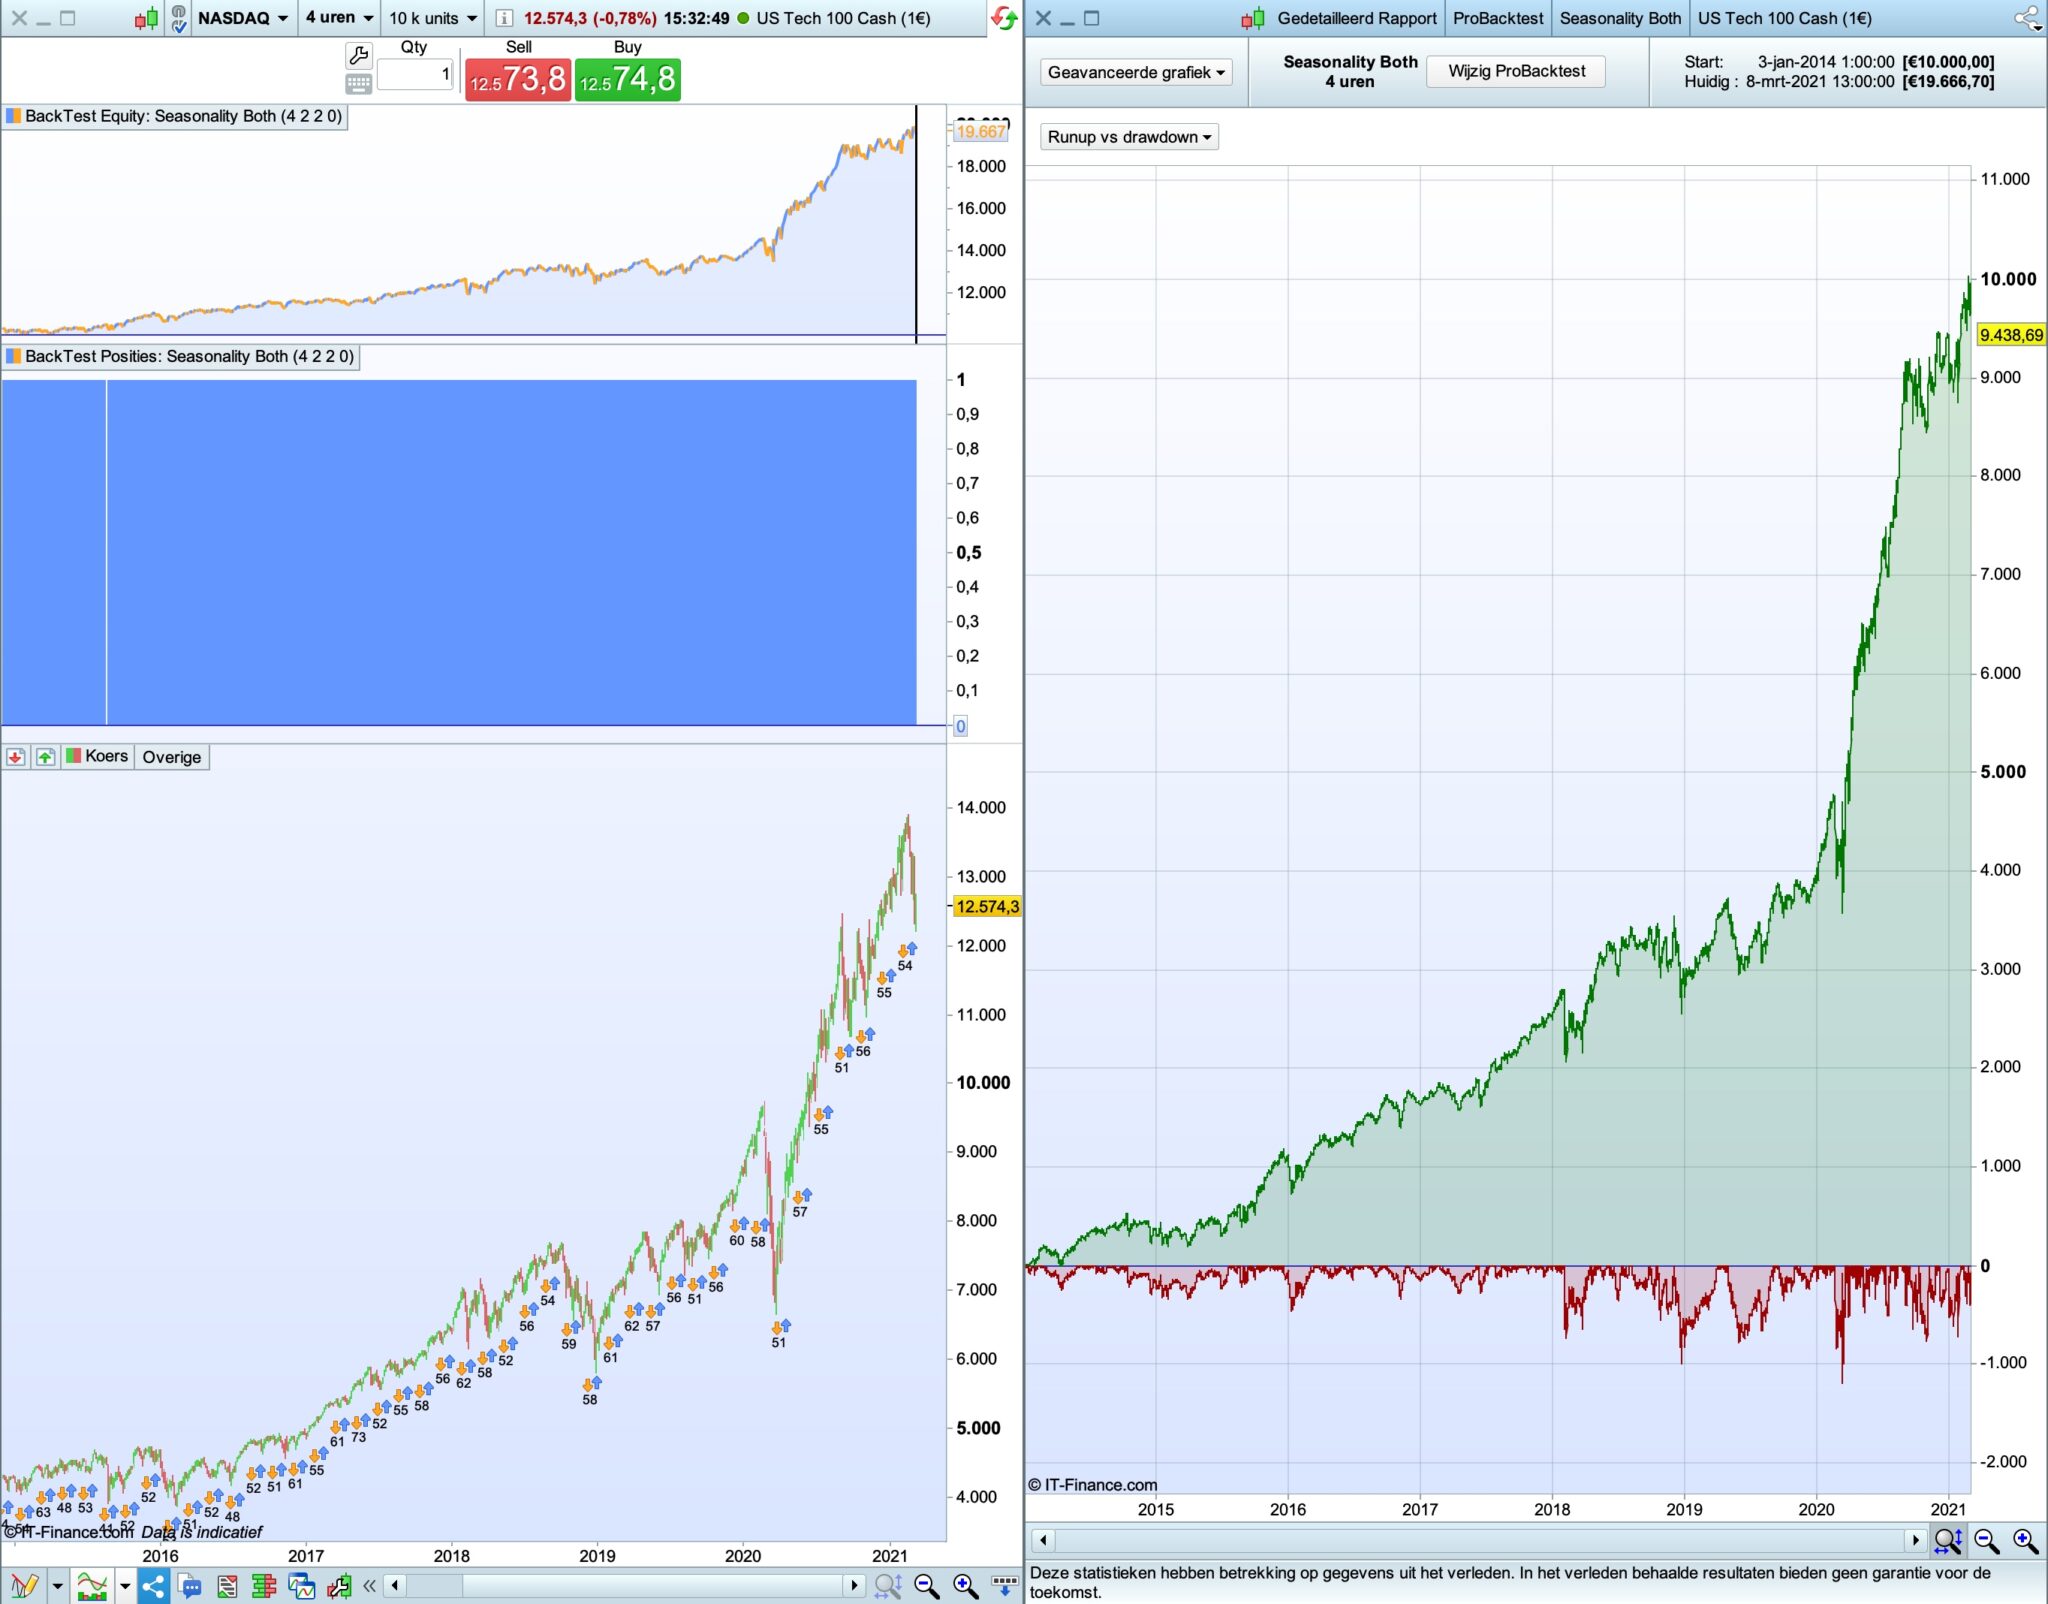
I took another approach. I changed it to a daily reset, mainly to have more trades.
Now the focus is 2-3-4 hour charts and optimising starts now in range at 0 if i’am correct.
As example I took the nasdaq. Added spread 2 & tickbytick.
There are always dips in the market and here’s a way to minimise the effect it seems.
I.e. buys if the high>high[1] next bar at market, else it exit’s shorts, which is still a buy but not holding a new position against the trend.
Results are pretty good.
I’m struggling a little to fully understand what you are now doing and see that you have switched to the Nasdaq which is a market that has not a lot to do with seasonality. Is it possible to post the code so that I can try to understand more easily what you mean?
PaulParticipant
Master
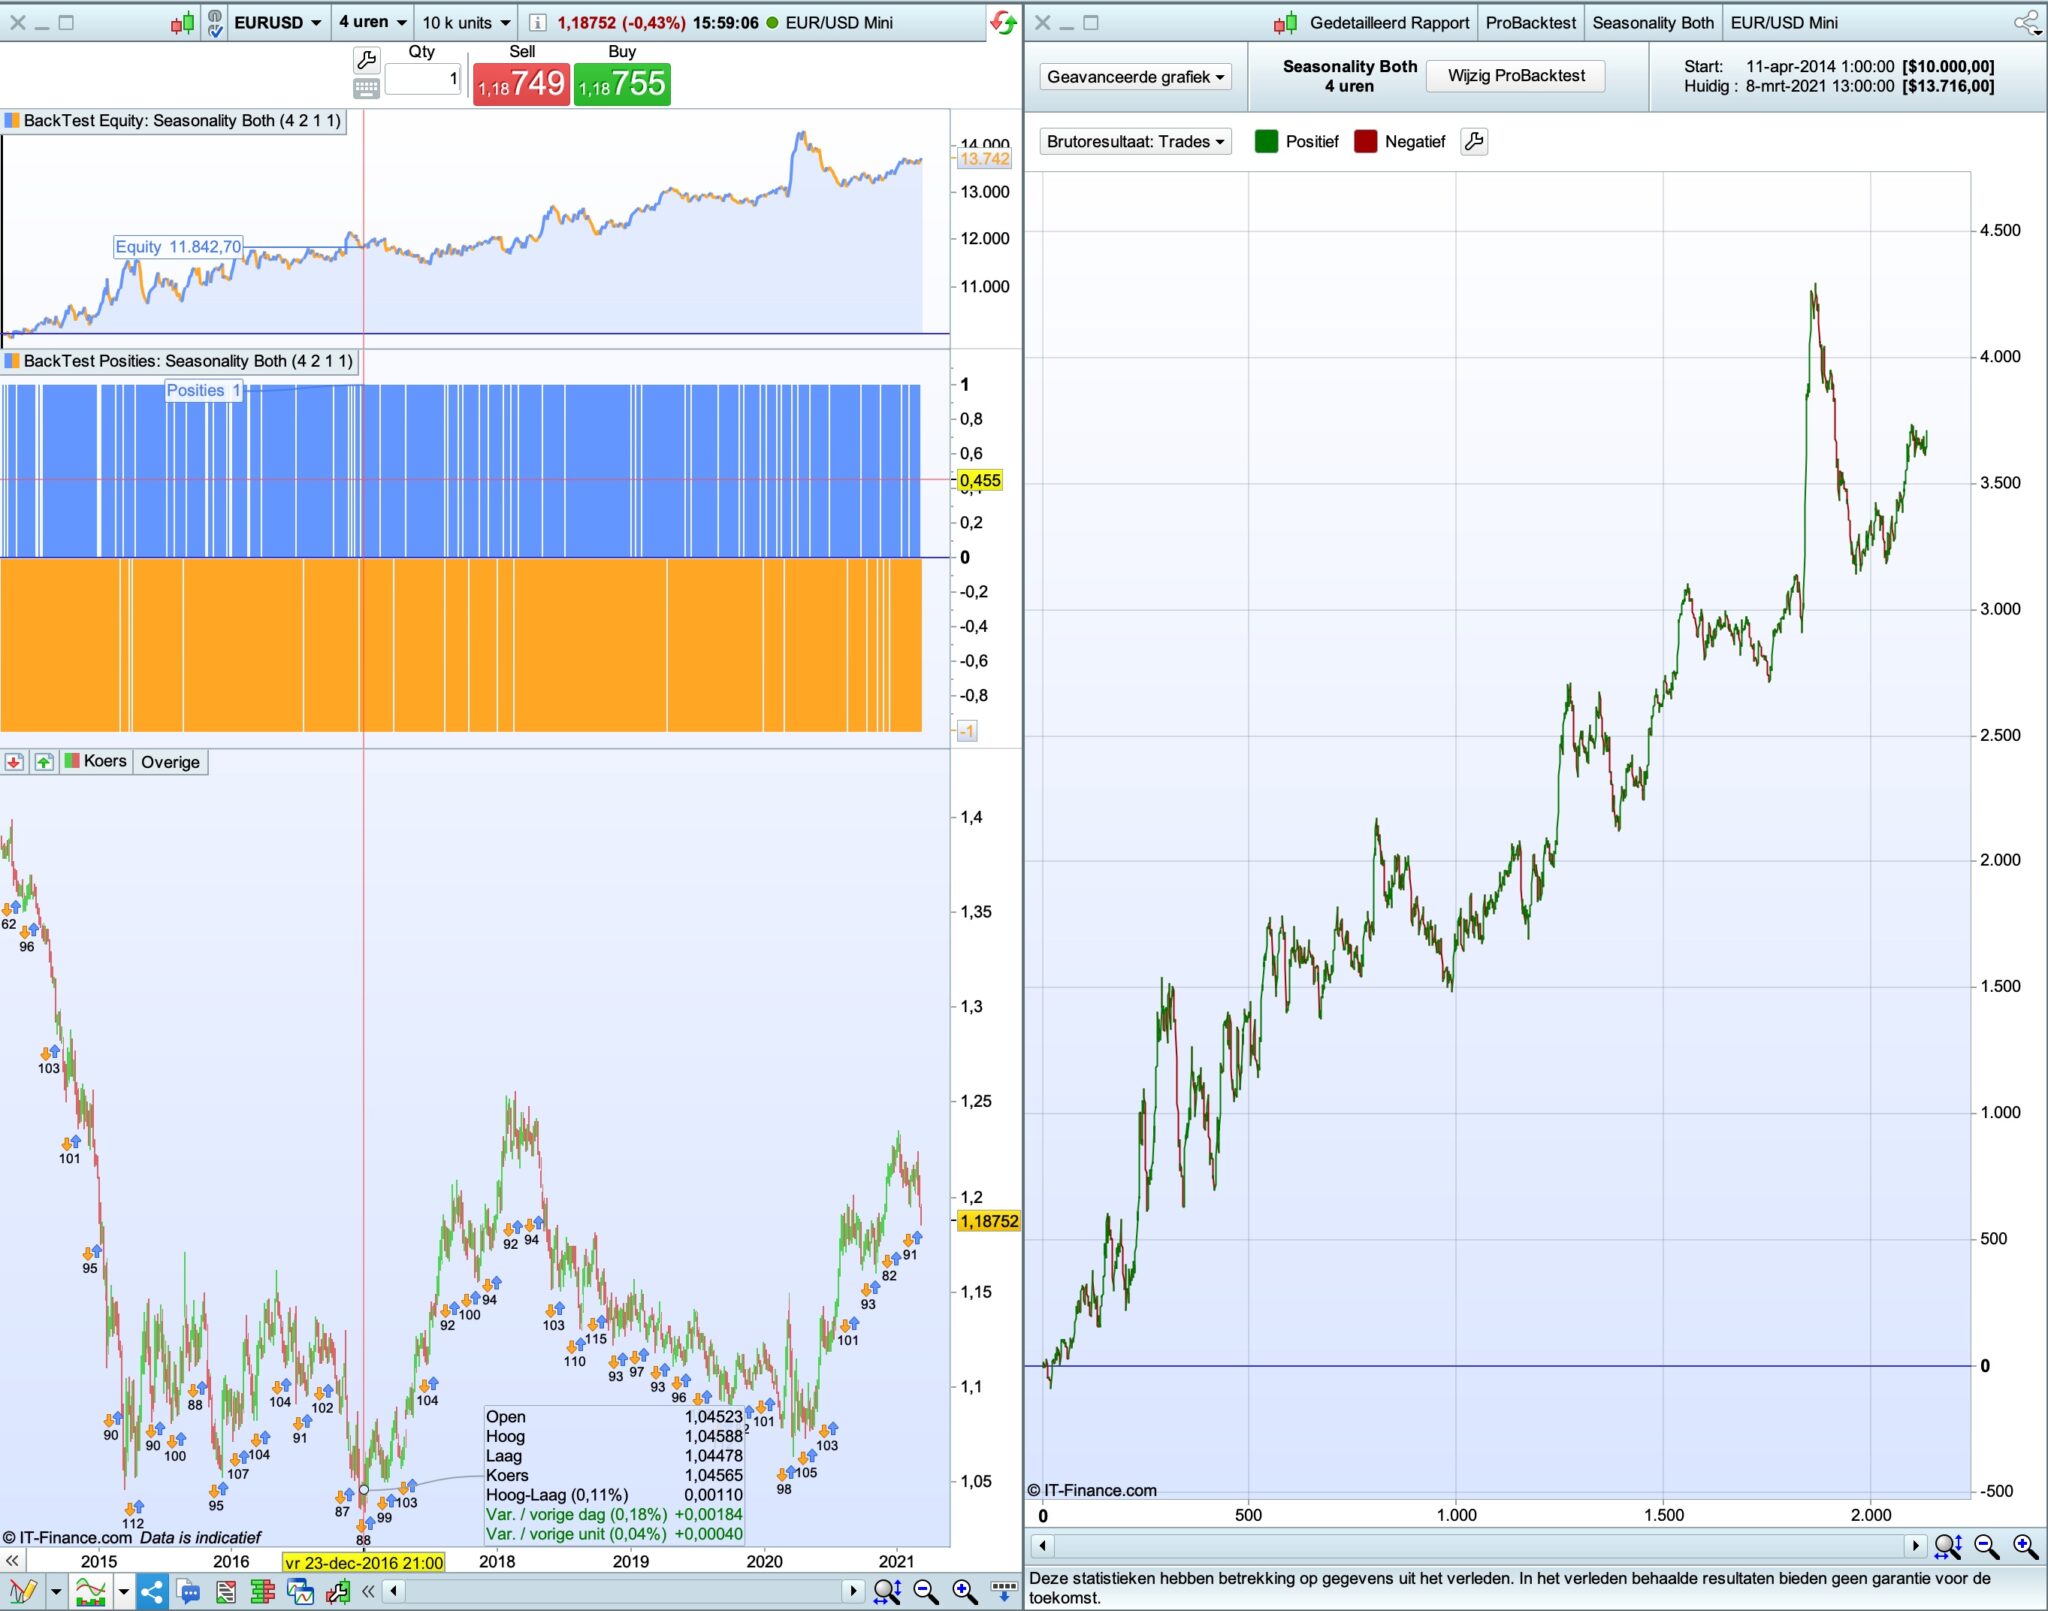
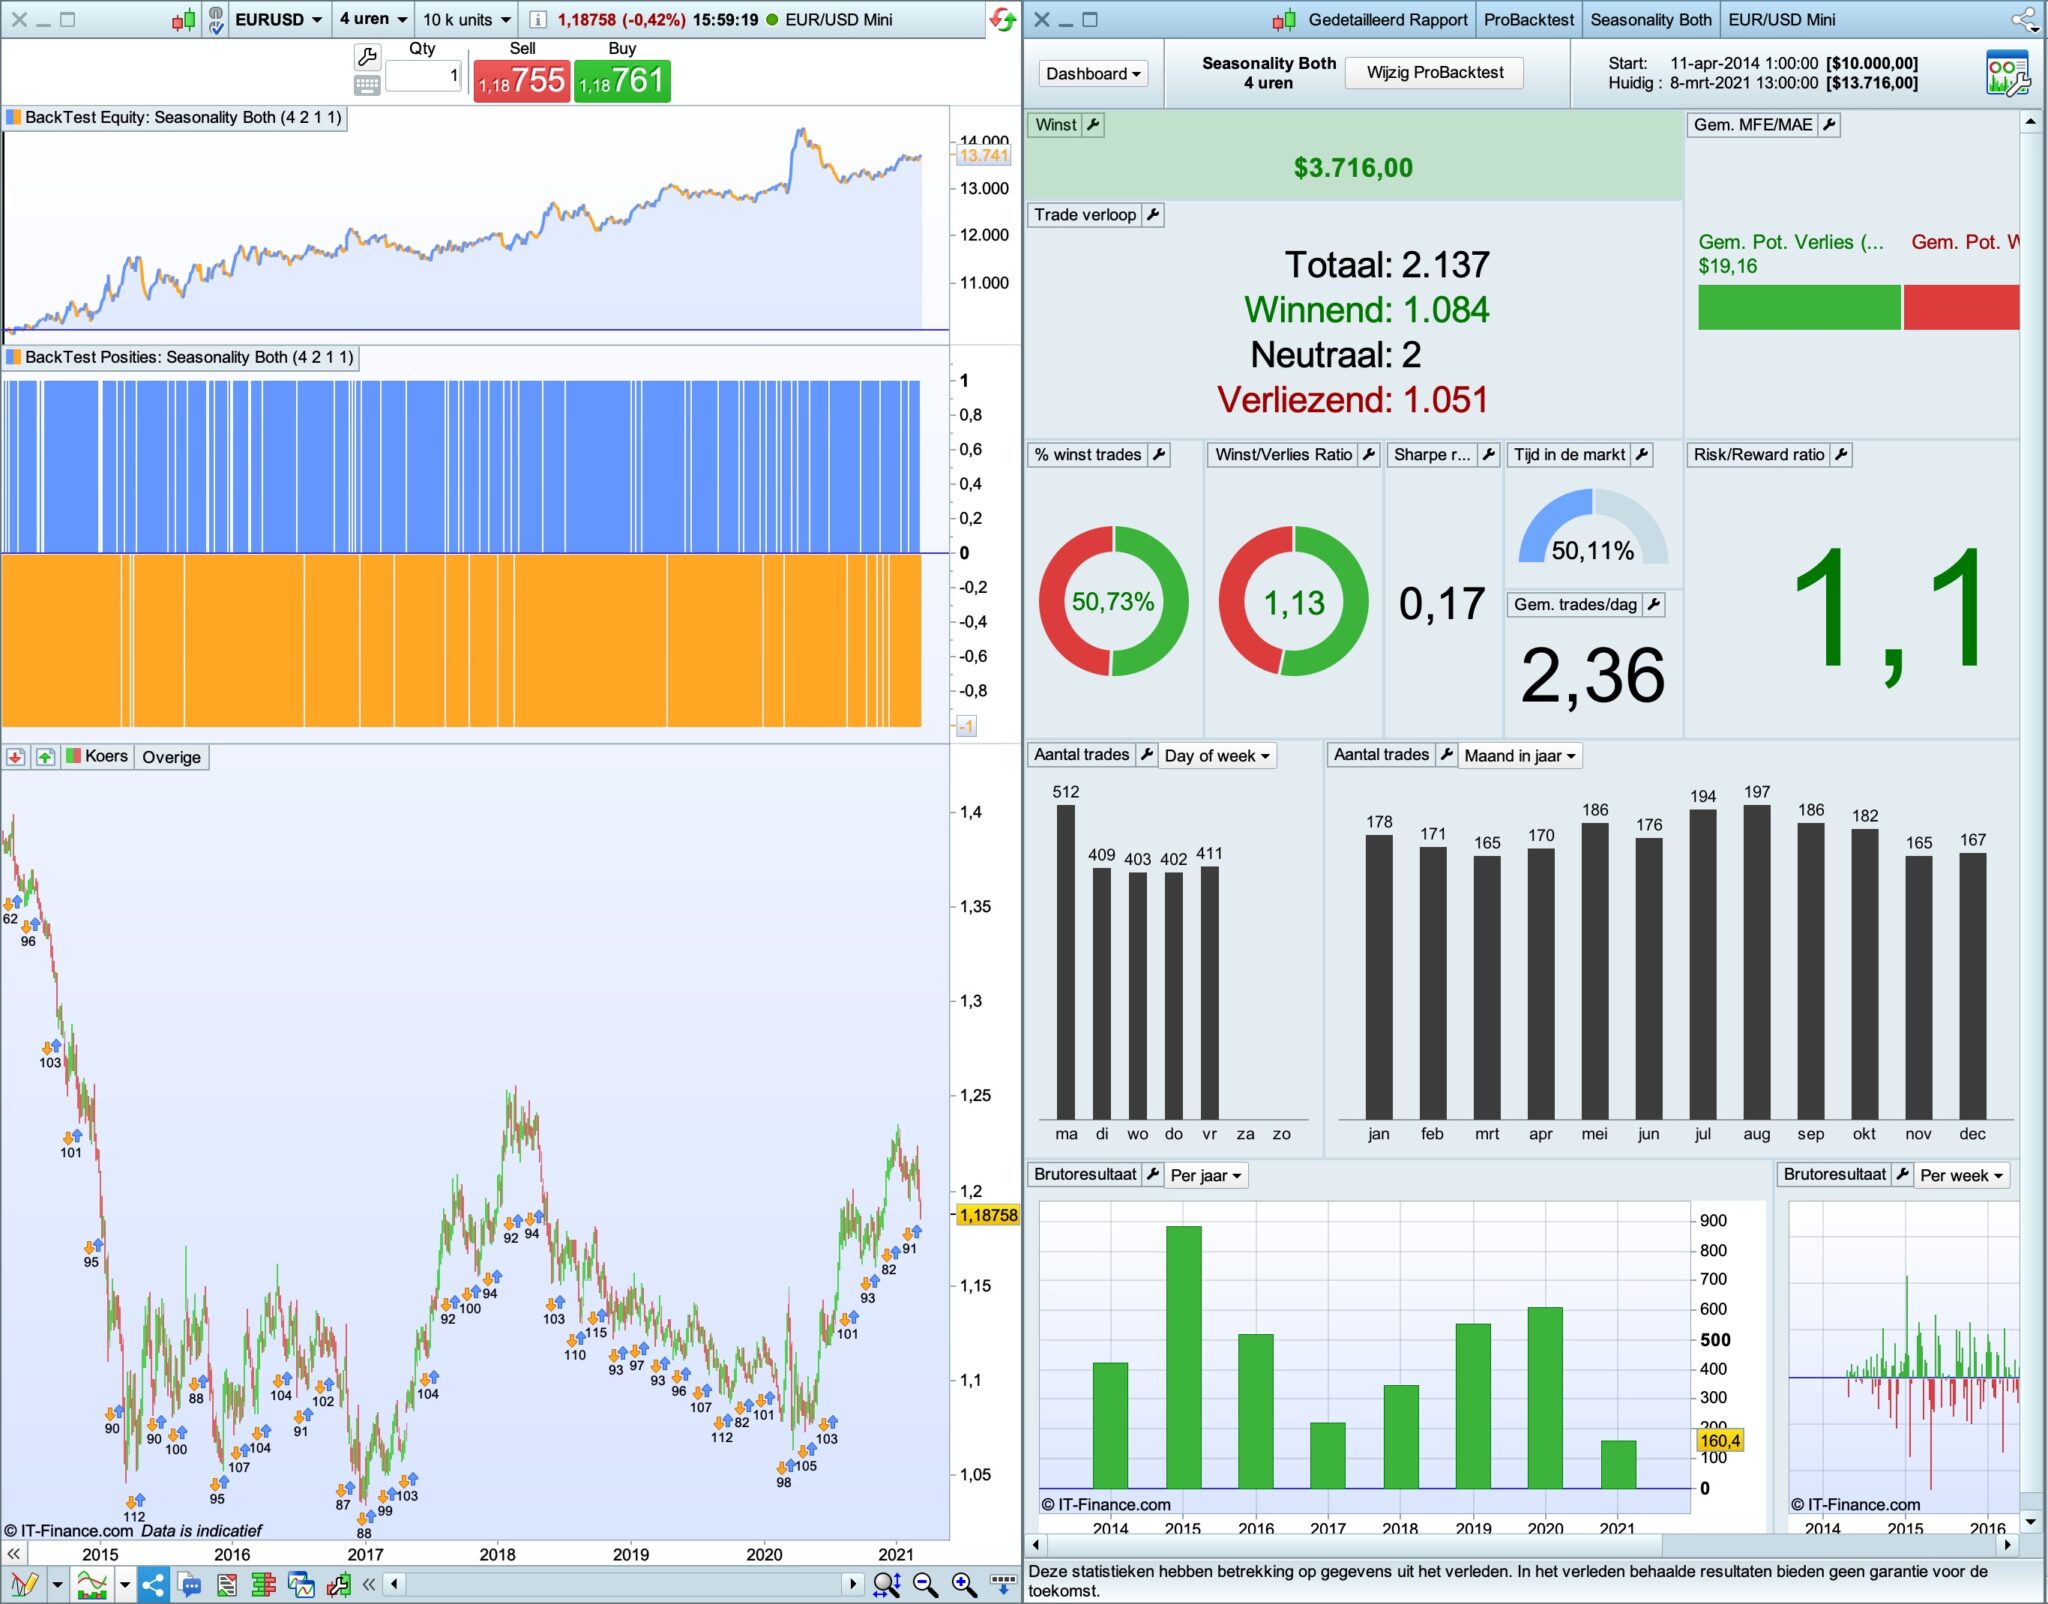
here’s eurusd with spread
defparam cumulateorders = false
//defparam flatbefore =080000
//defparam flatafter  =200000

//batchtype=1 then set a3 & a4 not to optimise
//batchtype=2 can comment out the buy/sellshort rows as variation?
//optimise a1 t/m a4 range 1-12

once tradetype=1 //1 both, 2 long, 3 short
once batchtype=2 //batchtyp 1 solo with only parameters a1,a2

//first batch
startweeklong  = a1
endweeklong    = a2

startweekshort = a2
endweekshort   = a1

// second batch
startweeklong2  = a3
endweeklong2    = a4

startweekshort2 = a4
endweekshort2   = a3

//if openyear <> openyear[1] then
if openday<>openday[1] then
wn = 0
wn2 =0
endif

wn = wn + 1
wn2= wn2+ 1

// BATCH 1
if batchtype=1 or batchtype=2 then

if tradetype=1 or tradetype=2 then

if wn = startweeklong then
if high>high[1] then
buy 1 contract at market
else
exitshort at market
endif
endif

if onmarket and wn = endweeklong then
sell at market
endif
endif

if tradetype=1 or tradetype=3 then

if wn = startweekshort then
if low<low[1] then
sellshort 1 contract at market
else
sell at market
endif
endif

if onmarket and wn = endweekshort then
exitshort at market
endif

endif
endif

// BATCH2
if batchtype=2 then

if tradetype=1 or tradetype=2 then

if wn2 = startweeklong2 then
if high>high[1] then
buy 1 contract at market
else
exitshort at market
endif
endif

if onmarket and wn2 = endweeklong2 then
sell at market
endif
endif

if tradetype=1 or tradetype=3 then

if wn2 = startweekshort2 then
if low<low[1] then
sellshort 1 contract at market
else
sell at market
endif
endif

if onmarket and wn2 = endweekshort2 then
exitshort at market
endif
endif
endif

//set stop %loss 10
//set target pprofit 250
OK but now seasonality has completely gone out of the window and because we are on faster time frame charts we truly have entered the world of finding the best possible curve fit to the data that we have.
PaulParticipant
Master
haha, yeah seasonality is not longer the target. One thing let to another.
This code analyses the market and decides based on a lot of data if it’s best to go long, short or both.
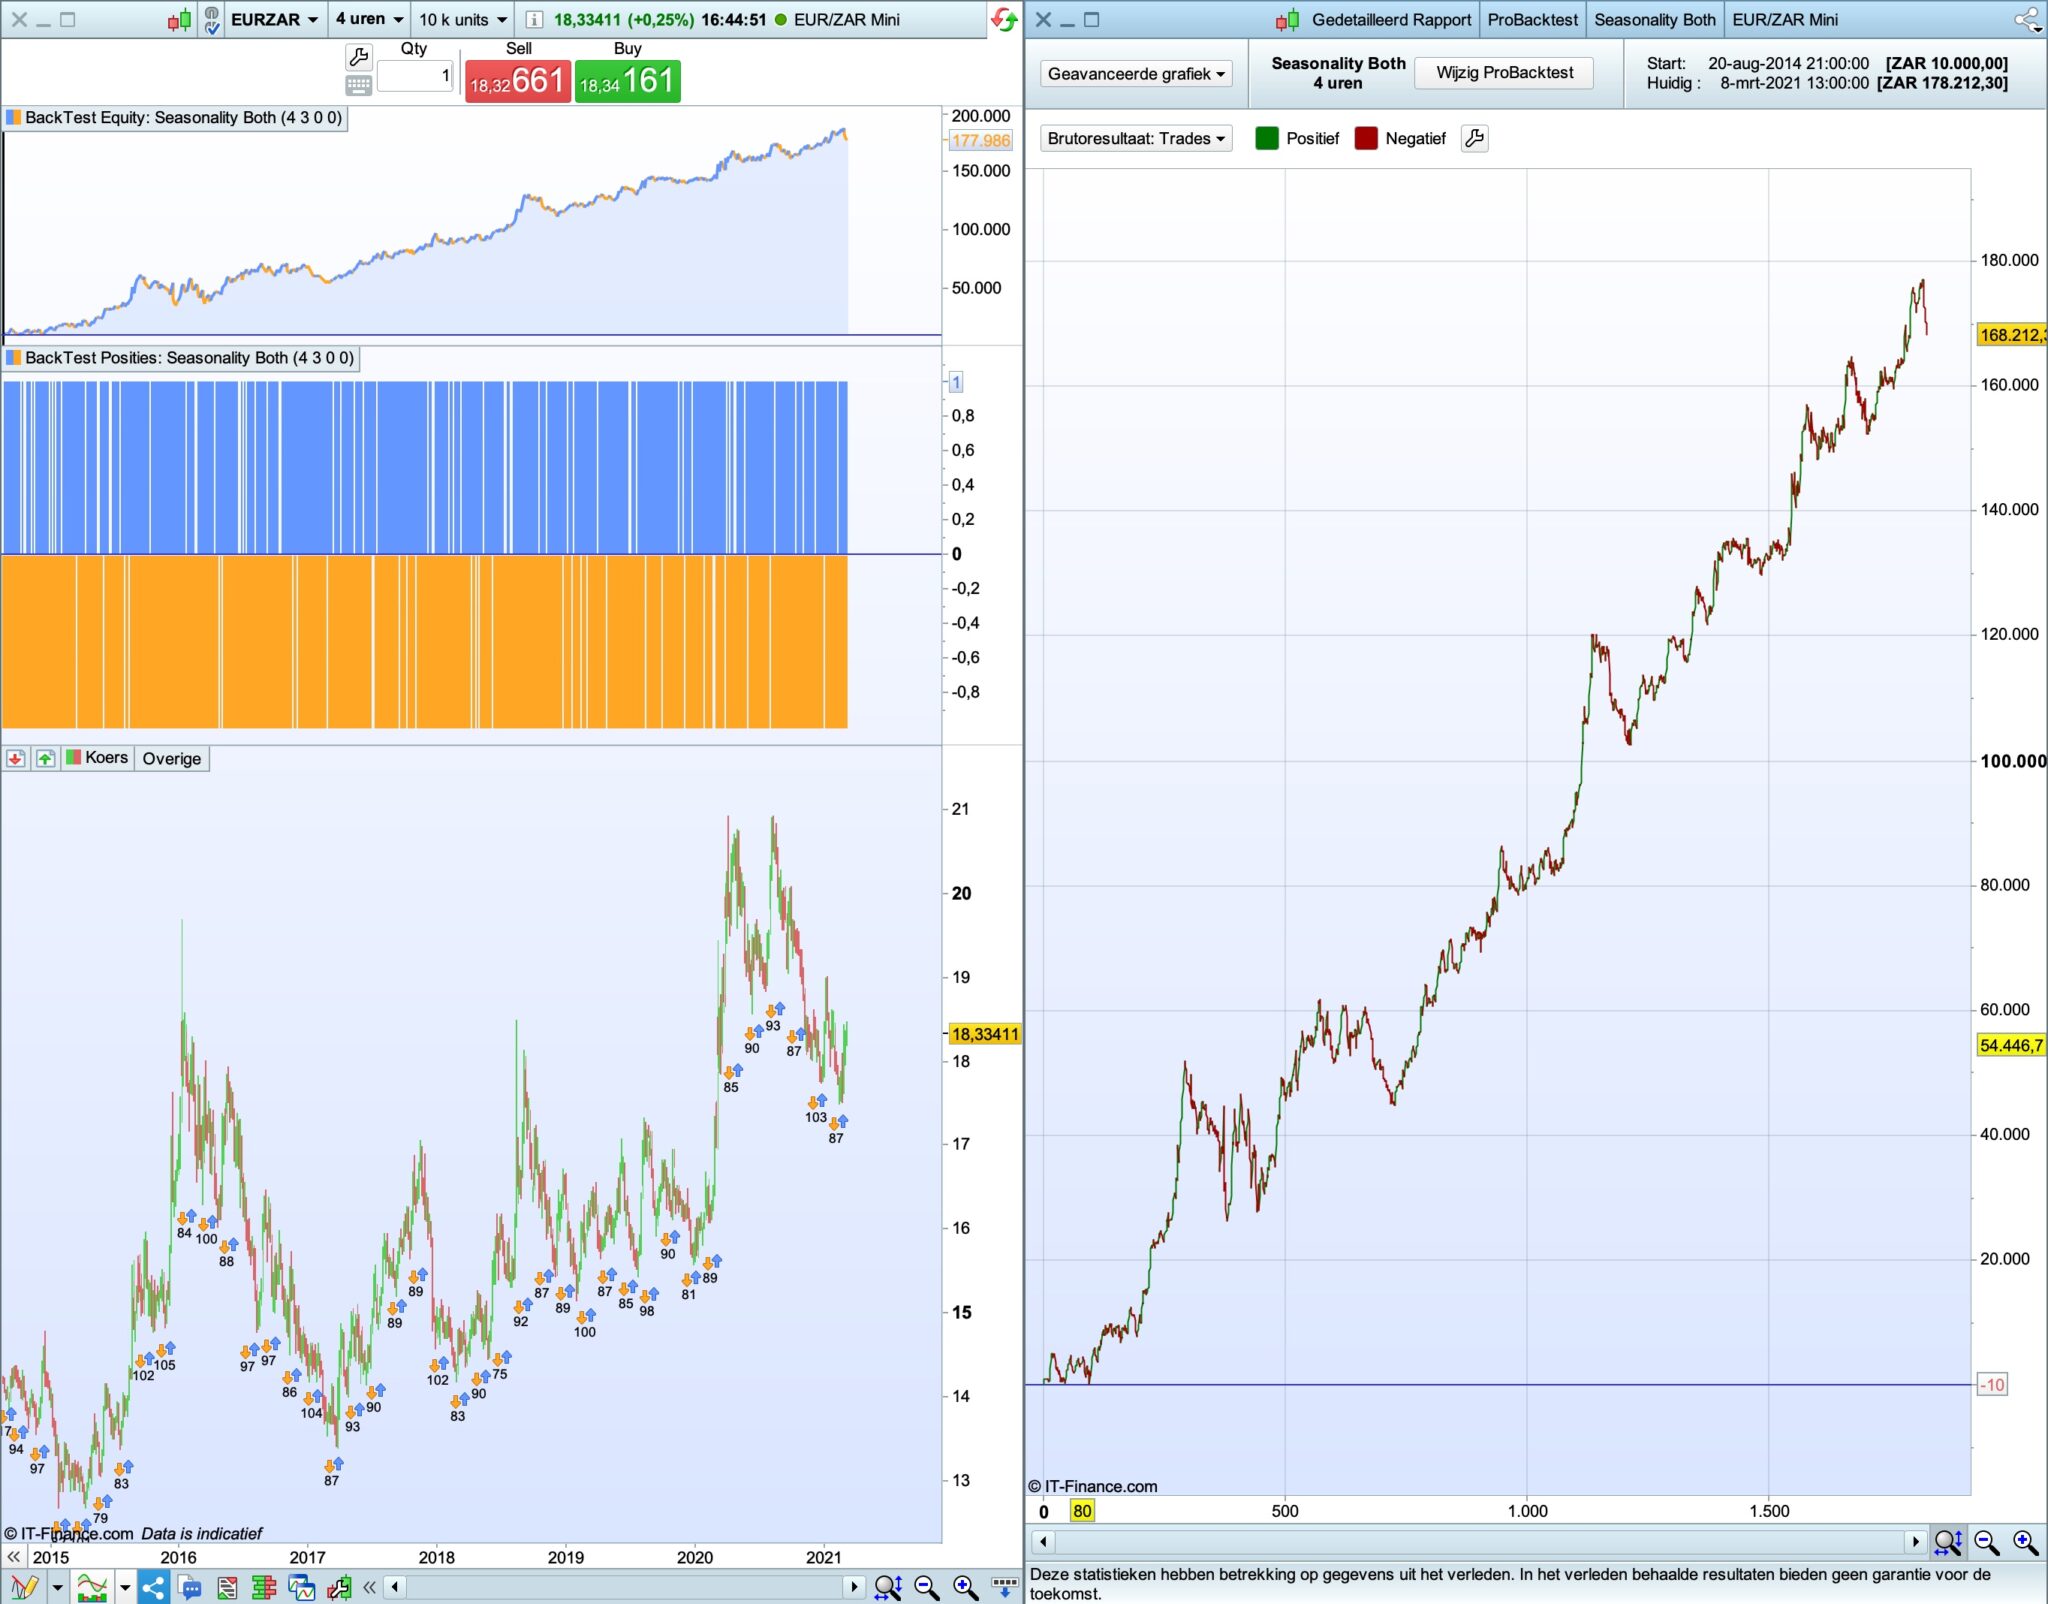
Having 1-2k trades and a curve like that on different markets with spread is intriguing. It’s also on the dow, nikkei btw in lesser extend.
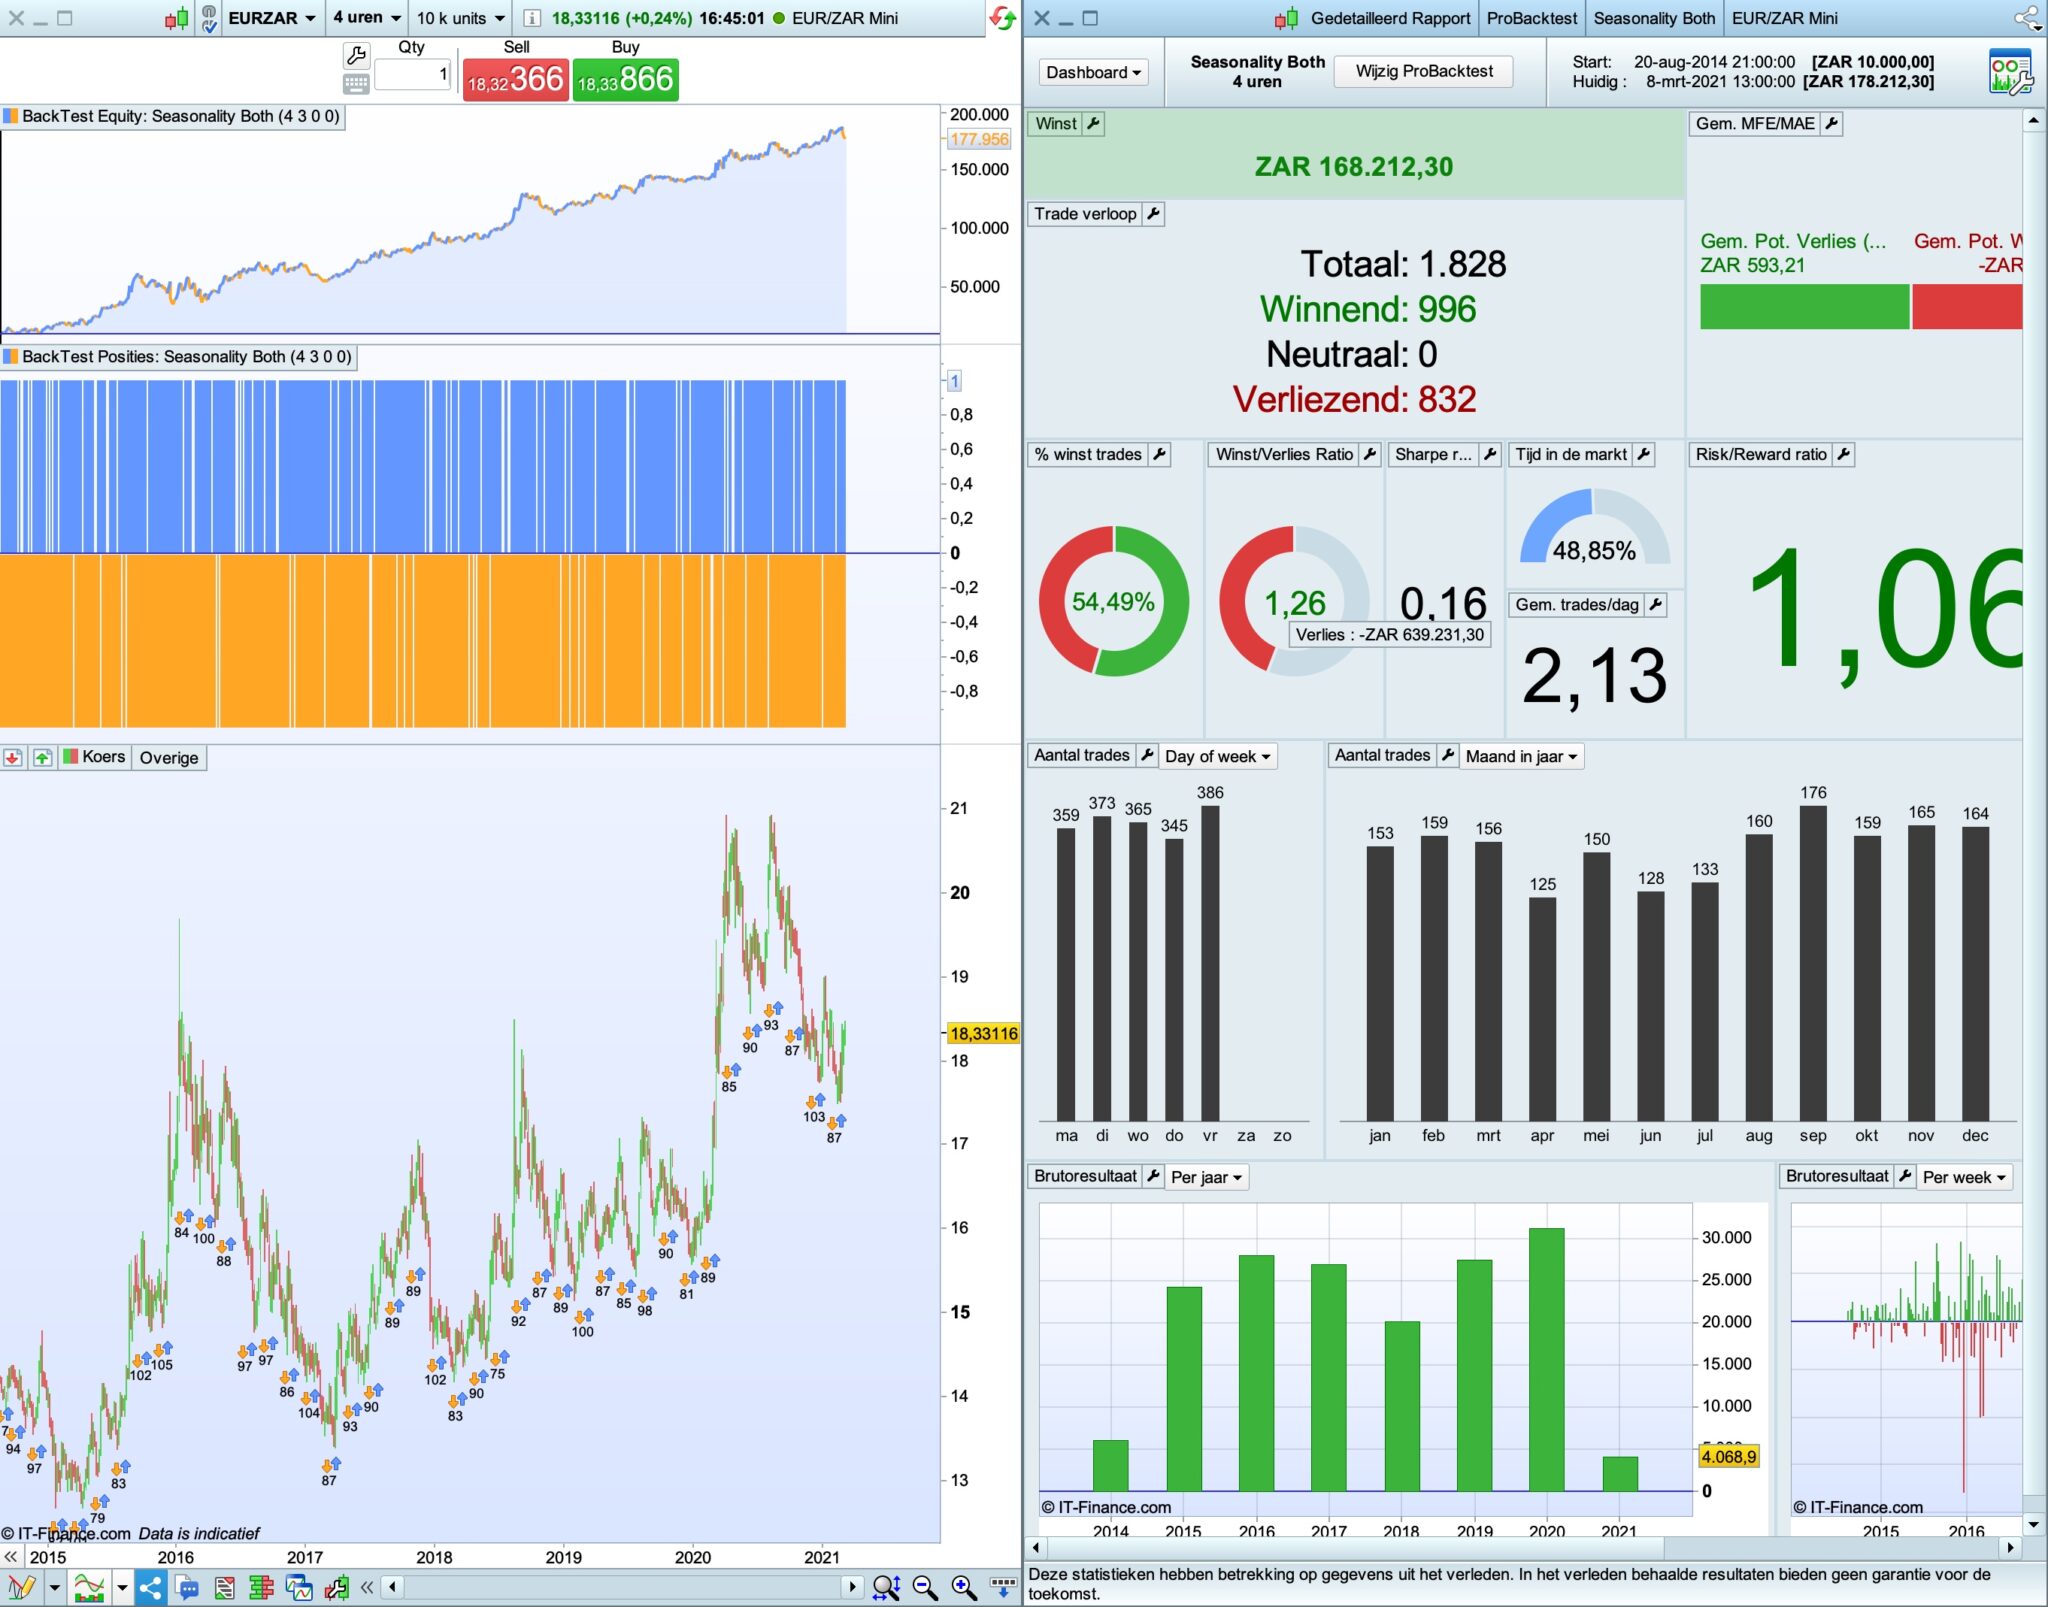
Here’s eur/zar. Spread 1. Don’t know if that’s correct spread
Al what we try is curvefitting. you can have 2 parameters for 50 trades in say 8 years, or 4 parameters for 2000 trades in 8 years. I’am leaning then to 4 parameters.
I’ve to look into it a bit more. Thnx for posting the original idea. It gives a lot of new options!
I think the only thing these curve fitted equity curves do is give us a best performance datum against which to compare other strategies to get some sort of idea of how good or bad they are. We can compare them to ‘buy only the best bits’ as well as ‘buy and hold now’!
Yes that used historical seasonality as a filter for future trades I seem to recall. I also believe that it didn’t work out too well as the future refused to do the same as the past even if the in sample equity curves looked great!
ive been dabbeling alot with seasonality later too.
i have been using the pathfinder as a basecode and ive been using this site https://charts.equityclock.com/live-cattle-futures-lc-seasonal-chart
to look for seasonality patterns.
but as you say, it might just be a little bit to curvefit..
You might also be interested in this indicator that I coded a while back then:
Seasonality Curve