


Screener cruce EMA 50/200 y RSI>50 en diario y semanal

Viewing 3 posts - 1 through 3 (of 3 total)
  • Author
    Posts
  • #257666 quote
    jorge242
    Participant
    Junior

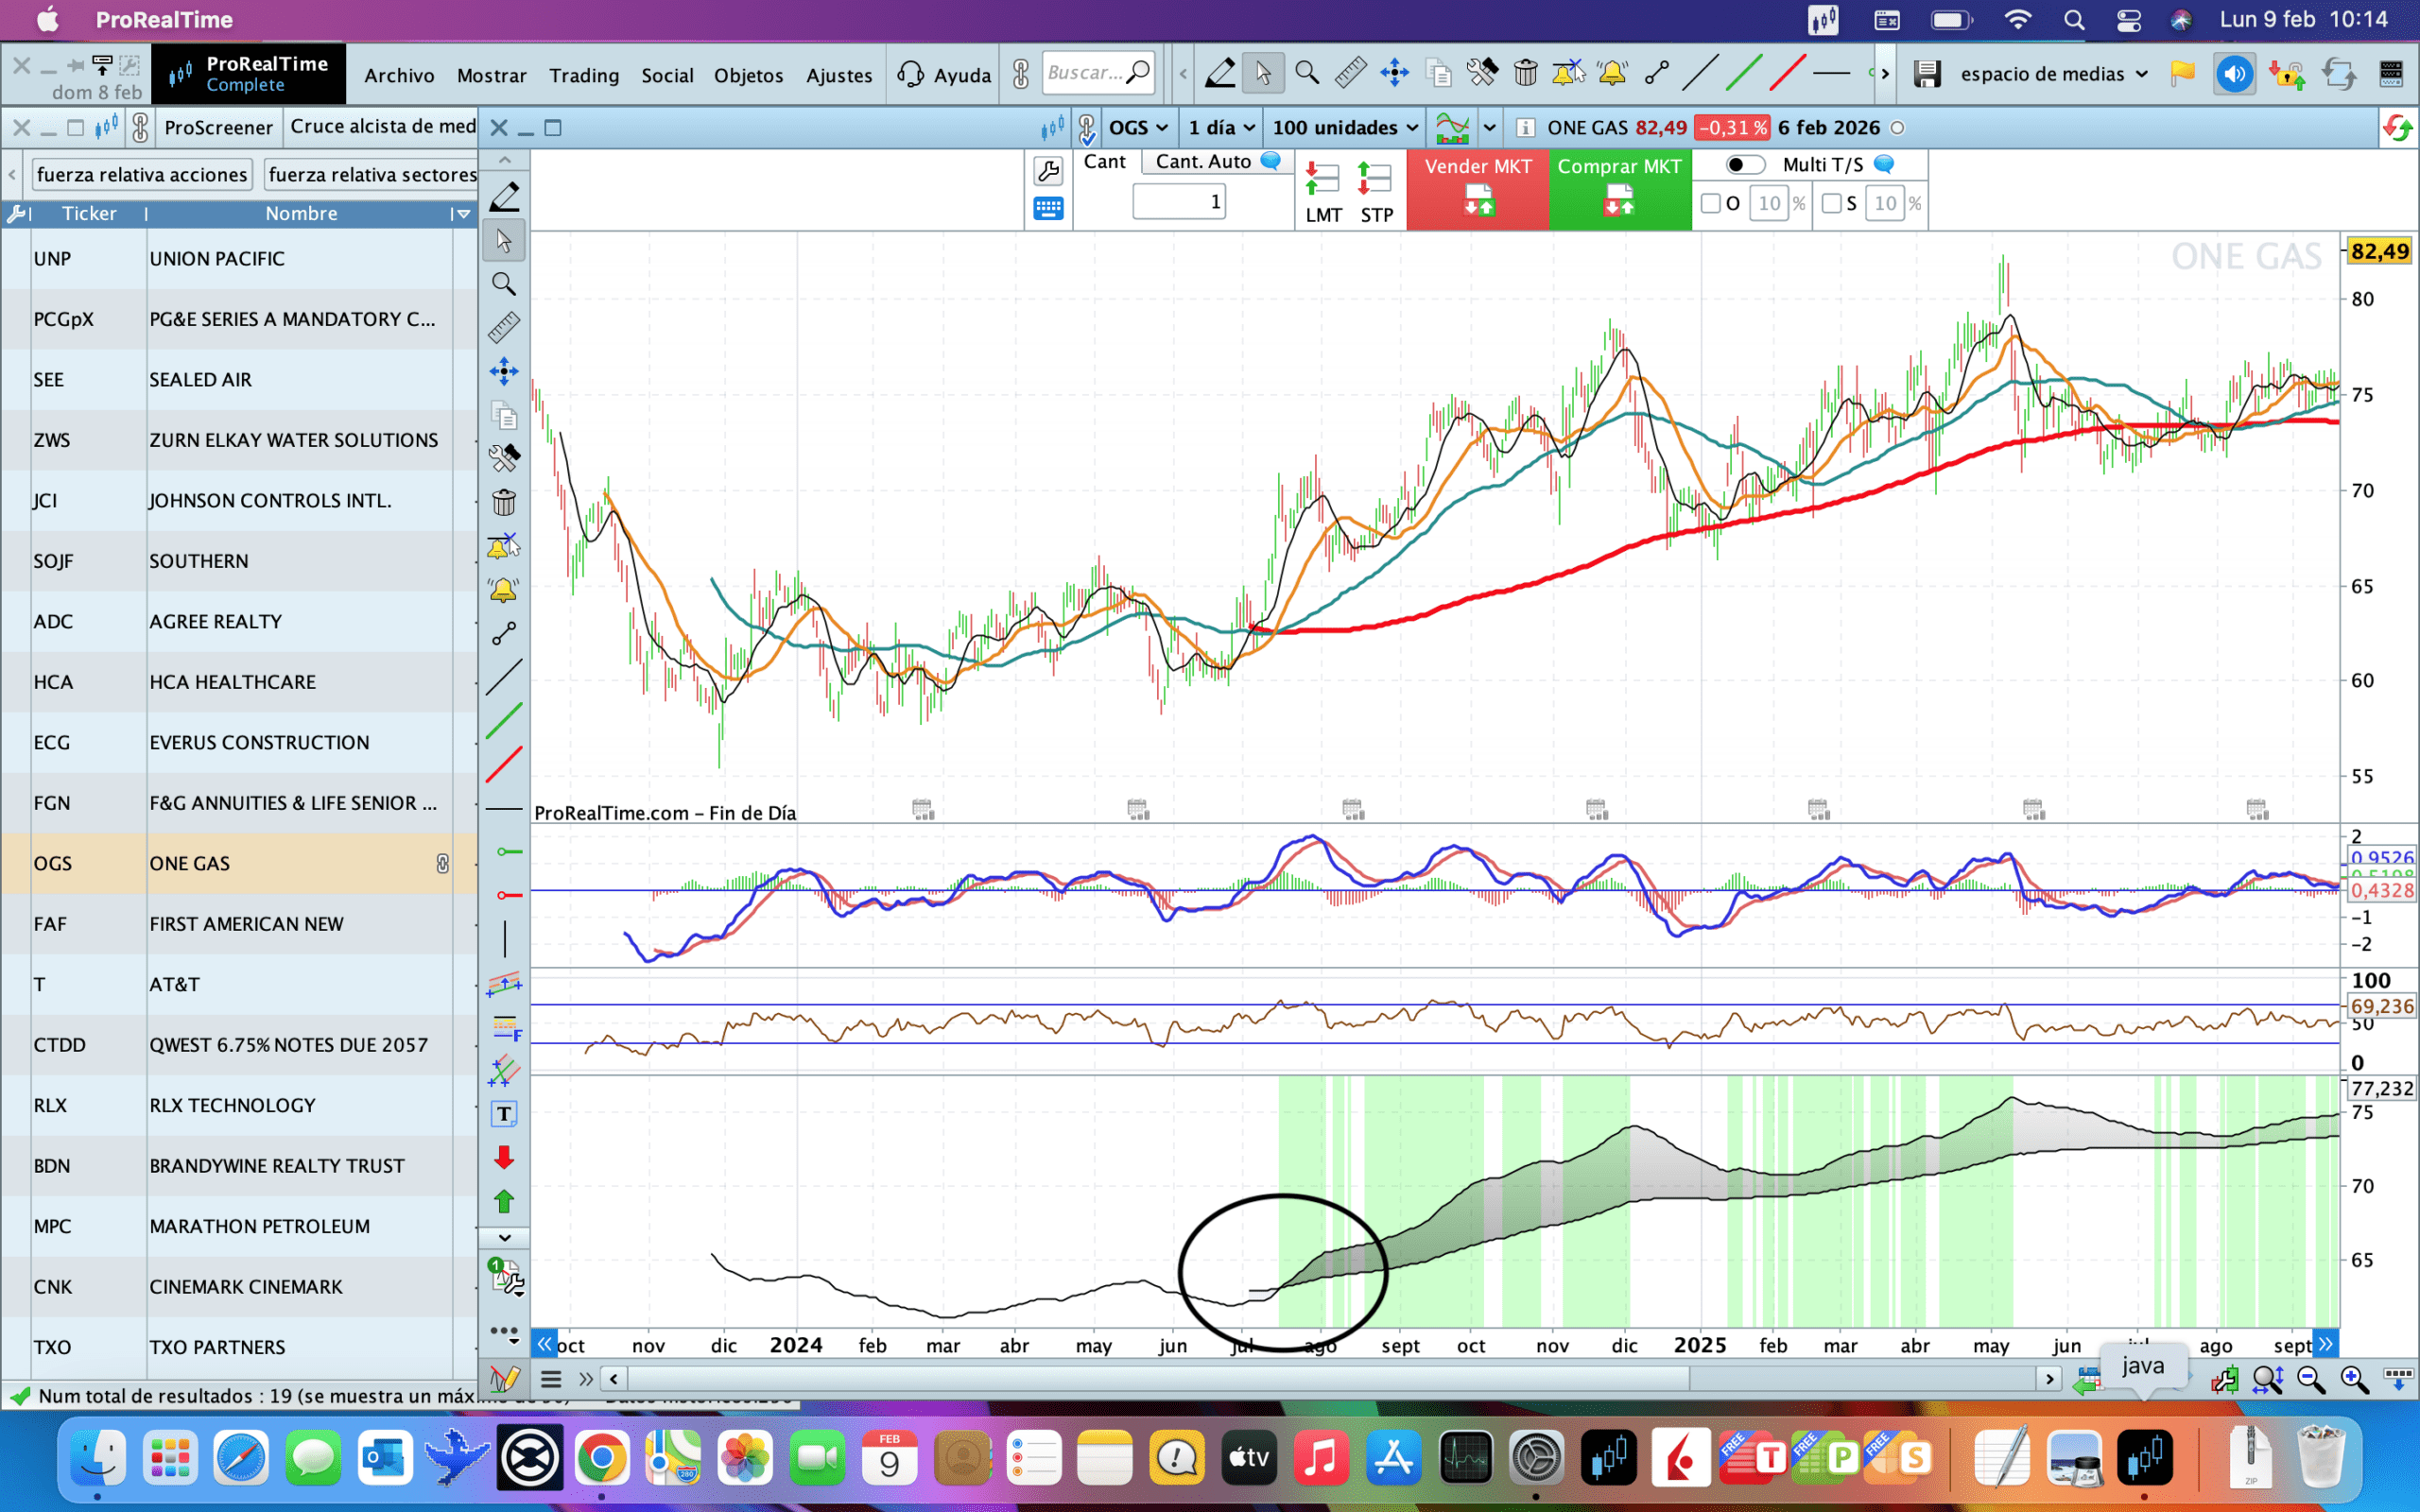
    HOLA BUENOS DIAS, SE PODRIA HACER UN BUSCADOR EN SEMANAL Y EN DIARIO DE ESTE INDICADOR, EN EL MOMENTO QUE CRUCE AL ALZA.


    // — PARÁMETROS —

    // Media Móvil Lenta

    lenLenta = 200

    // Media Móvil Rápida

    lenRapida = 50

    // RSI

    lenRSI = 14


    // — CÁLCULO DE INDICADORES —

    // Medias Móviles Exponenciales (EMA)

    emaLenta = ExponentialAverage[lenLenta](close)

    emaRapida = ExponentialAverage[lenRapida](close)


    // RSI

    myRSI = RSI[lenRSI](close)


    // — VISUALIZACIÓN EN GRÁFICO —

    plot1 = emaLenta

    plot2 = emaRapida


    // — LÓGICA DE TENDENCIA (Ejemplo básico) —

    tendenciaAlcista = (close > emaLenta) AND (emaRapida > emaLenta) AND (myRSI > 50)

    tendenciaBajista = (close < emaLenta) AND (emaRapida < emaLenta) AND (myRSI < 50)


    // Pintar el fondo según la tendencia

    IF tendenciaAlcista THEN

    BACKGROUNDCOLOR(0,255,0,50) // Verde claro

    ELSIF tendenciaBajista THEN

    BACKGROUNDCOLOR(255,0,0,50) // Rojo claro

    ENDIF


    RETURN plot1 AS “EMA Lenta”, plot2 AS “EMA Rápida”

    Captura-de-pantalla-2026-02-09-a-las-10.14.49-scaled.png Captura-de-pantalla-2026-02-09-a-las-10.14.49-scaled.png
    #257669 quote
    robertogozzi
    Moderator
    Legend

    Ahí está:

    // — PARÁMETROS —
    // Media Móvil Lenta
    lenLenta = 200
    // Media Móvil Rápida
    lenRapida = 50
    // RSI
    //lenRSI = 14
    // — CÁLCULO DE INDICADORES —
    // Medias Móviles Exponenciales (EMA)
    emaLenta = ExponentialAverage[lenLenta](close)
    emaRapida = ExponentialAverage[lenRapida](close)
    // RSI
    //myRSI = RSI[lenRSI](close)
    // — VISUALIZACIÓN EN GRÁFICO —
    plot1 = emaLenta
    plot2 = emaRapida
    // — LÓGICA DE TENDENCIA (Ejemplo básico) —
    //tendenciaAlcista = (close > emaLenta) AND (emaRapida > emaLenta) AND (myRSI > 50)
    //tendenciaBajista = (close < emaLenta) AND (emaRapida < emaLenta) AND (myRSI < 50)
    // Pintar el fondo según la tendencia
    //IF tendenciaAlcista THEN
    //BACKGROUNDCOLOR(0,255,0,50) // Verde claro
    //ELSIF tendenciaBajista THEN
    //BACKGROUNDCOLOR(255,0,0,50) // Rojo claro
    //ENDIF
    Cond = (plot2 > plot1) AND (plot2 > plot2[1])
    //RETURN plot1 AS "EMA Lenta", plot2 AS "EMA Rápida"
    screener[Cond AND (high > low)]
    
    
    Iván González thanked this post
    #257723 quote
    jorge242
    Participant
    Junior

    Muchas gracias roberto, lo probare

Viewing 3 posts - 1 through 3 (of 3 total)
  • You must be logged in to reply to this topic.

ProRealAI ProRealAI New

Stuck on this ProBuilder code?

Describe what this topic is trying to build, in plain English, and ProRealAI writes the ProRealTime™ indicator, screener or system for you.

Available in 7 languages
Try ProRealAI

Screener cruce EMA 50/200 y RSI>50 en diario y semanal


ProScreener: Buscadores de Mercado y Rastreo

New Reply
Author
author-avatar
jorge242 @jorge242 Participant
Summary

This topic contains 2 replies,
has 2 voices, and was last updated by jorge242

7 months ago.

Topic Details
Forum: ProScreener: Buscadores de Mercado y Rastreo
Language: Spanish
Started: 02/09/2026
Status: Active
Attachments: 1 files
Logo Logo
Loading...

