Sure I will do the code conversion for the benefit of PRT users. I have the link and source code, will do it next week. If I don’t please remind me, have a good Sunday! 😉
Apologies for the delayed response. Local volatility is the volatility for a specific strike/tenor.
Trying to do an example below…
Stock ABC has only 3 options – they expire in 1 week, 2 weeks and 1 year.
1 Week expiration options –> local volatility for 1week expiry (1w Local Vol = 50%)
2 week expiration = local volatility for 2week expiry (2w Local Vol = 10%)
1 year expiration = local volatility for 1 year expiry (1Y Local Vol = 5%)
Implied Volatility for Stock ABC = 21.67% (not exact calc, but simple average)
In our above example, it appears everyone is trading the 1week expiry. Everyone is making bets that will be a LARGE move in ABC within the week. Specifically, there will be a LARGER move than would be expected by the Implied Volatility %.
The reason why local volatility is important is because the most intelligent people in markets are making markets in options. Their entire business is pricing those puppies appropriately. They have a good idea of where things are likely to go – so we should listen to the “Gohds, like Floki,” or the “machine” when they speak.
KM – do you read this? I could’ve sworn you mentioned something on an episode of the macro show in regards to a comment on here. Wouldn’t be surprised if you’re lurking!
Ok, so in a recent Early Look, KM said that he resets his model ‘AFTER I get my nightly options data (from Bloomy) where I get insight from IVOL vs RVOL”
So we know the IVOL/RVOL spread or maybe RoC is being used in the RR calcs, so maybe that combined with the daily RoC in closing prices holds the secret?
IVOL should naturally be different from RVOL showing a premium or discount. In an uptrend you’d want to buy on an IVOL/RVOL premium as it shows traders hedging to the downside, vice versa trimming positions when the premium switches to discount as it indicates complacency (lack of demand for put options). The reverse is true for downtrends.
Some more details from a ‘defector’ that might have given away the secret sauce 😉
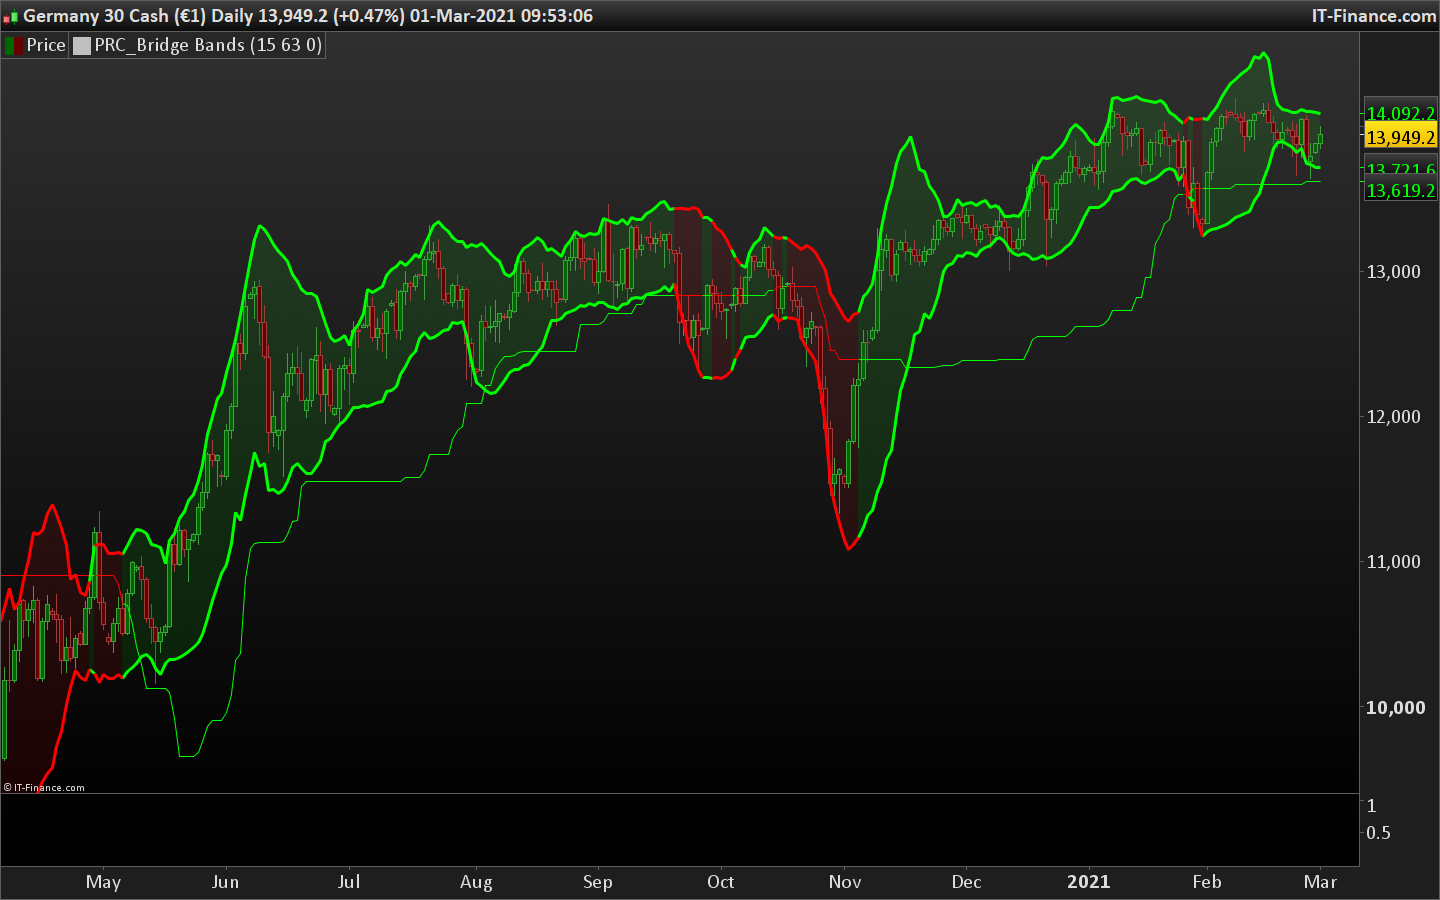
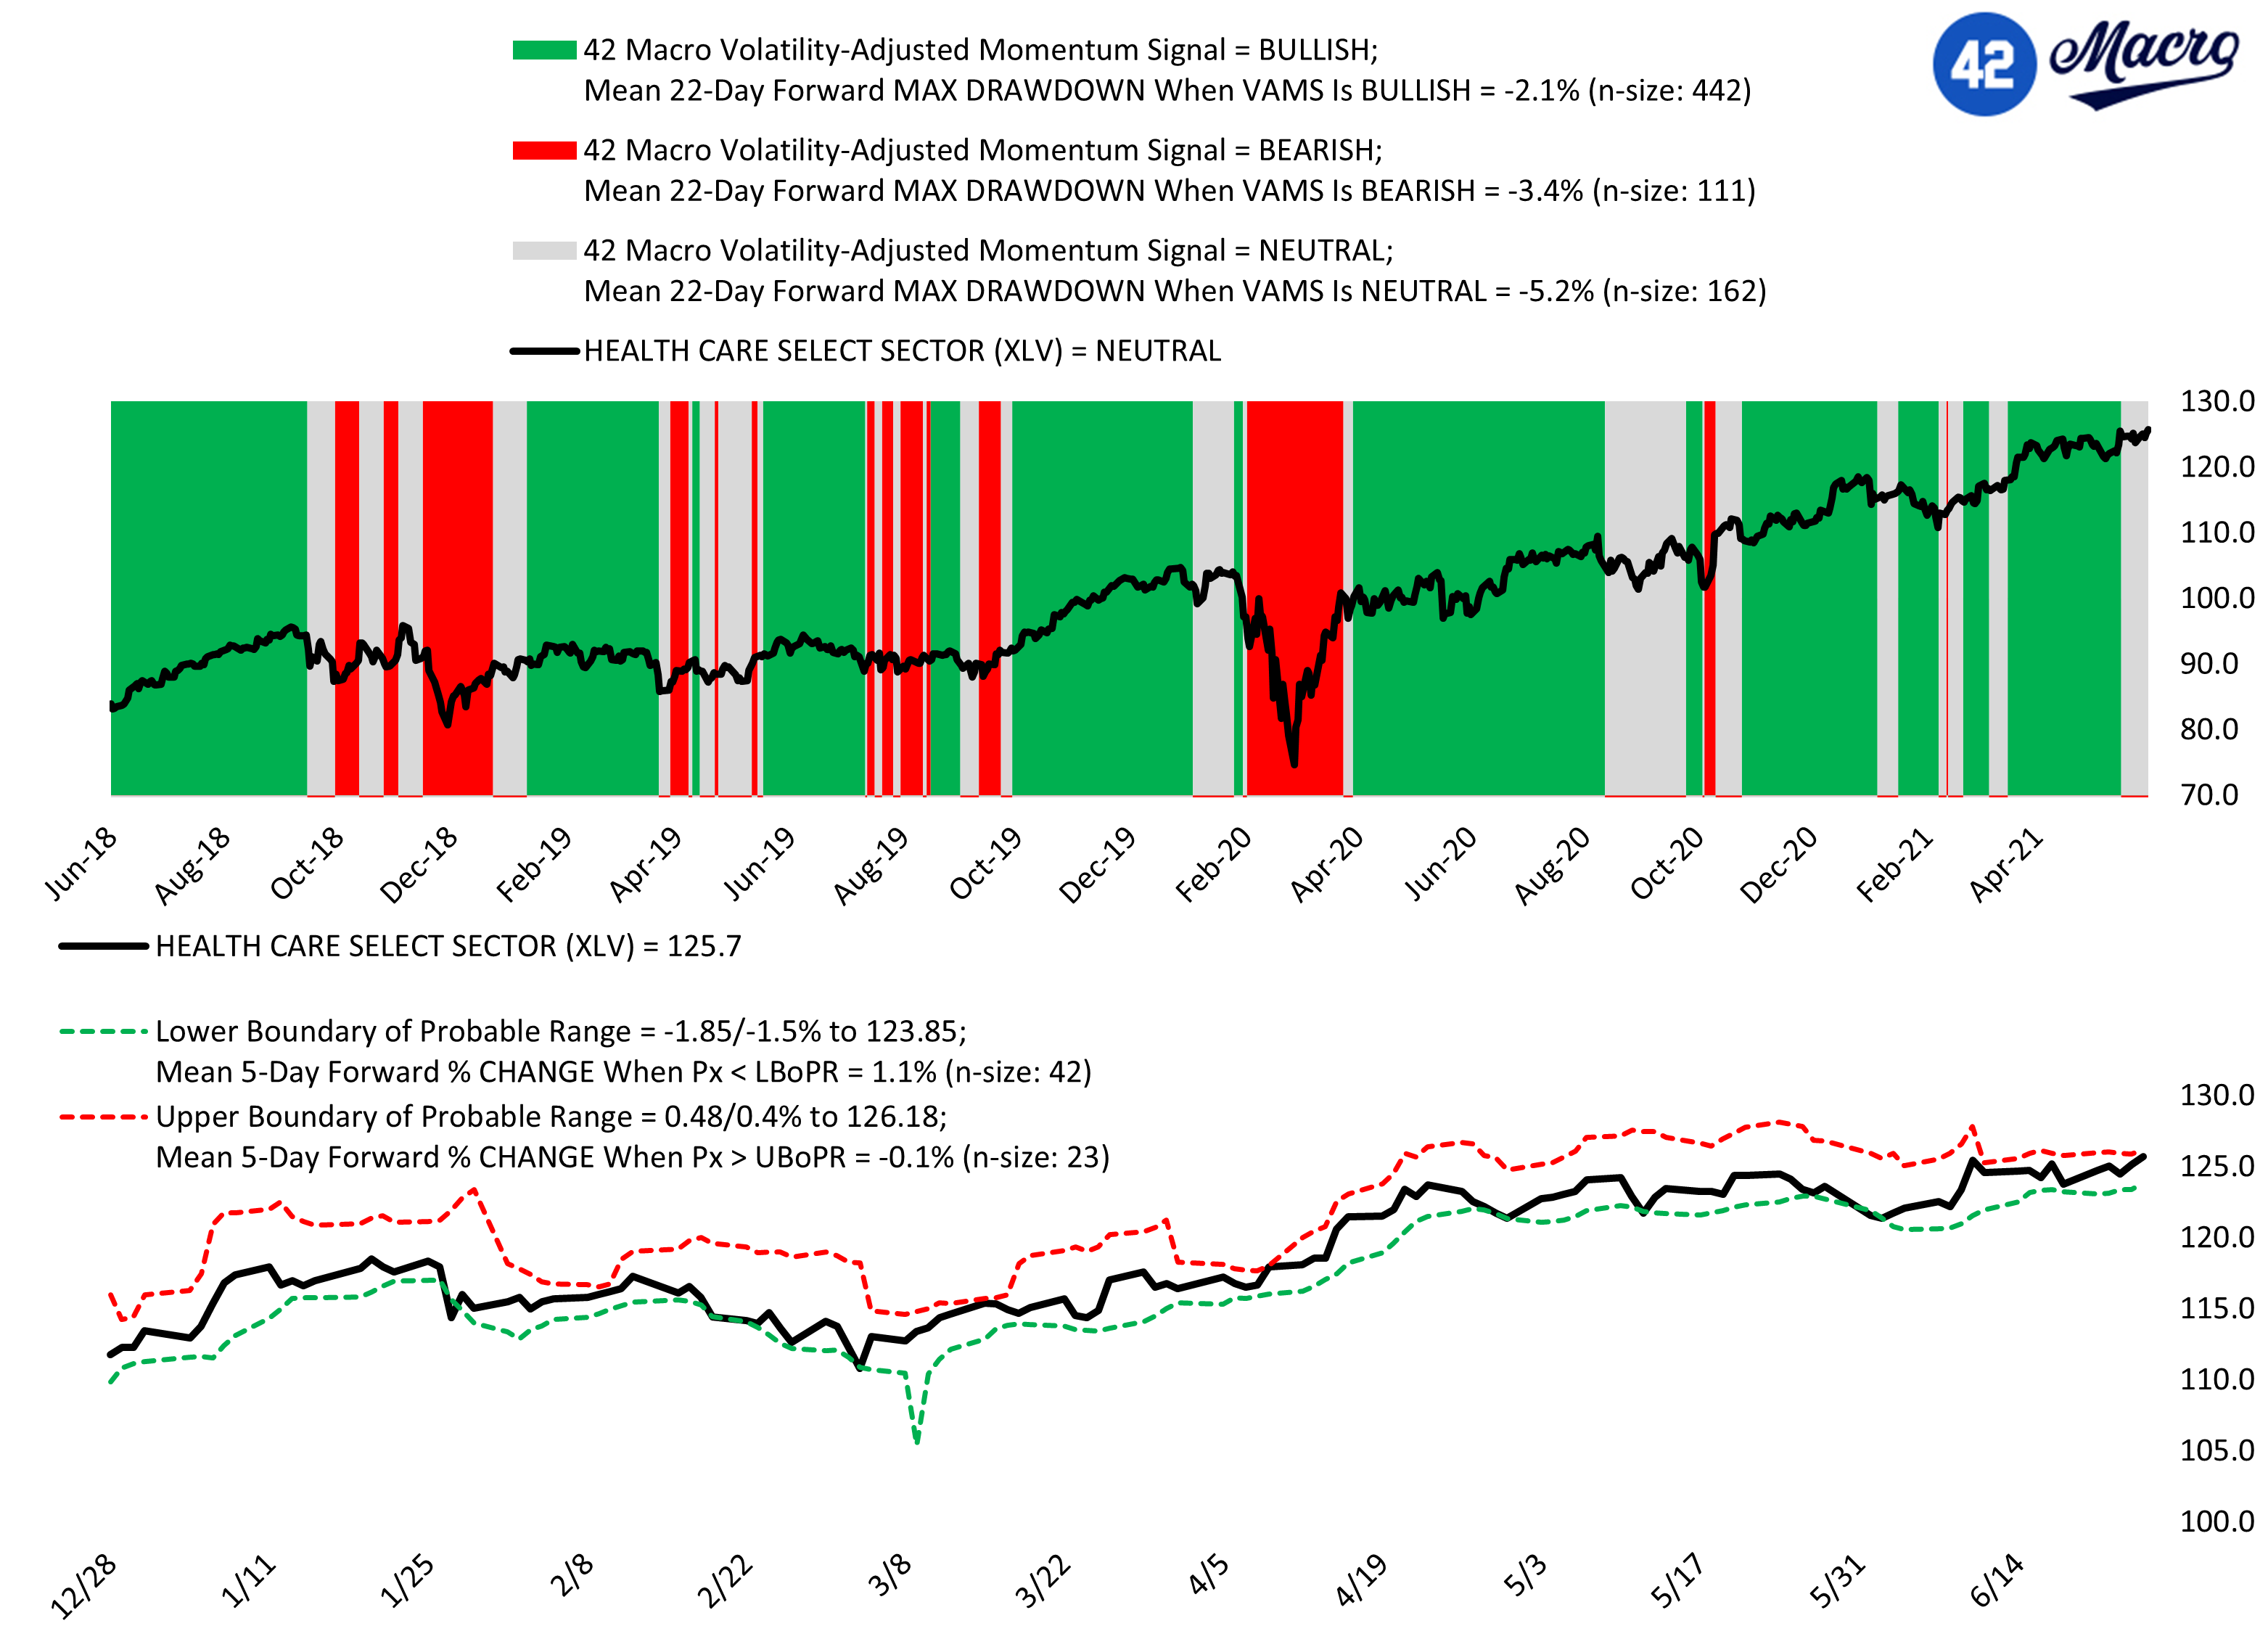
42Macro is essentially renaming them Volatility Adjusted Momentum, ‘Probable Ranges’. In the video Darius explains that the 22 day trend is given +1 point for price trend and +1 point for volatility trending opposite for long, and -1 for down trend and -1 for vola increasing. Where score is not +2 or -2 trend is neutral. Further the probable range bands are derived from ‘rescaled ranges‘. See the excellent pic below!
From this we should be able to determine how to build our ‘volatility adjusted price bands’!
This thread “finished” in June 2021 but it is still very useful and contemporary to the present times. Therefore, I am wondering if the info shared in the last post was ever translated into a Pro Real Time Code and whether anyone is a position to do so for the benefit of Pro Real users. I particular I would like to refer to the below-quoted comments:
<<(…)From this we should be able to determine how to build our ‘volatility adjusted price bands’!(…)>>
I shall apologise, if I have overseen the Pro Real Code, and thank you in advance for your kind attention.
Since the introduction of AI. Has anyone used Claude or anyone to try and reverse engineer this?
Risk ranges should be somewhat possible to get within 1% of his numbers. But we need multiple data sets of all the risk ranges for at least 3 years I would say and run a multi variate regression analysis…
Now that is only one part Risk Ranges. ..
The other crucial part is getting the trade,trend,tail levels. Which are equally as important.. which imo might be ever more important than the everyday risk ranges.
The information collected on this form is stored in a computer file by ProRealCode to create and access your ProRealCode profile. This data is kept in a secure database for the duration of the member's membership. They will be kept as long as you use our services and will be automatically deleted after 3 years of inactivity. Your personal data is used to create your private profile on ProRealCode. This data is maintained by SAS ProRealCode, 407 rue Freycinet, 59151 Arleux, France. If you subscribe to our newsletters, your email address is provided to our service provider "MailChimp" located in the United States, with whom we have signed a confidentiality agreement. This company is also compliant with the EU/Swiss Privacy Shield, and the GDPR.
For any request for correction or deletion concerning your data, you can directly contact the ProRealCode team by email at privacy@prorealcode.com
If you would like to lodge a complaint regarding the use of your personal data, you can contact your data protection supervisory authority.
Get Assistance
Assistance Type
Your Need
Proposed Solutions
Do you like cookies? 🍪 We use cookies to ensure you get the best experience on our website.
(Learn more)