Hello,
I created a peak and valley indicator for a more complex use.
The first objective would be to determine if the last peak is higher or lower than the previous one, same thing for the troughs.
So I would like to know the variable that would allow me to find the price level of the previous trough or peak, that’s the object of my request.
The other objectives will be simple to implement once this problem is corrected.
Secondary objective that is not part of the request :
Determine the average price level over the X last peak
Create segments on the X last vertex with possible extension
And maybe other objectives…
In any case, the idea would be to know the trend in progress via the peaks and troughs or if we are in a row.
Once the indicator is finished, it will be made available in the library.
Thank you in advance for your help!
Translated, sorry for the errors
//
//============================== Indicateur Sommet / Creux

if close > close[1] and close > close[2] then
sommet = 1
creux = 0
if sommet = 1 and sommet[1] = 0 and low =< low[1] and low =< low[2] then
drawarrowup(barindex,low)
elsif sommet = 1 and sommet[1] = 0 and low[1] < low and low[1] =< low[2] then
drawarrowup(barindex[1],low[1])
elsif sommet = 1 and sommet[1] = 0 and low[2] < low[1] and low[2] < low then
drawarrowup(barindex[2],low[2])
endif
endif

if close < close[1] and close < close[2] then
creux = 1
sommet = 0
if creux= 1 and creux[1] = 0 and high => high[1] and high => high[2] then
drawarrowdown(barindex,high)
elsif creux= 1 and creux[1] = 0 and high[1] > high and high[1] => high[2] then
drawarrowdown(barindex[1],high[1])
elsif creux= 1 and creux[1] = 0 and high[2] > high[1] and high[2] > high then
drawarrowdown(barindex[2],high[2])
endif
endif

return
//
//============================== Indicateur Sommet / Creux

if close > close[1] and close > close[2] then
sommet = 1
creux = 0
endif

if close < close[1] and close < close[2] then
creux = 1
sommet = 0
endif

return sommet,creux
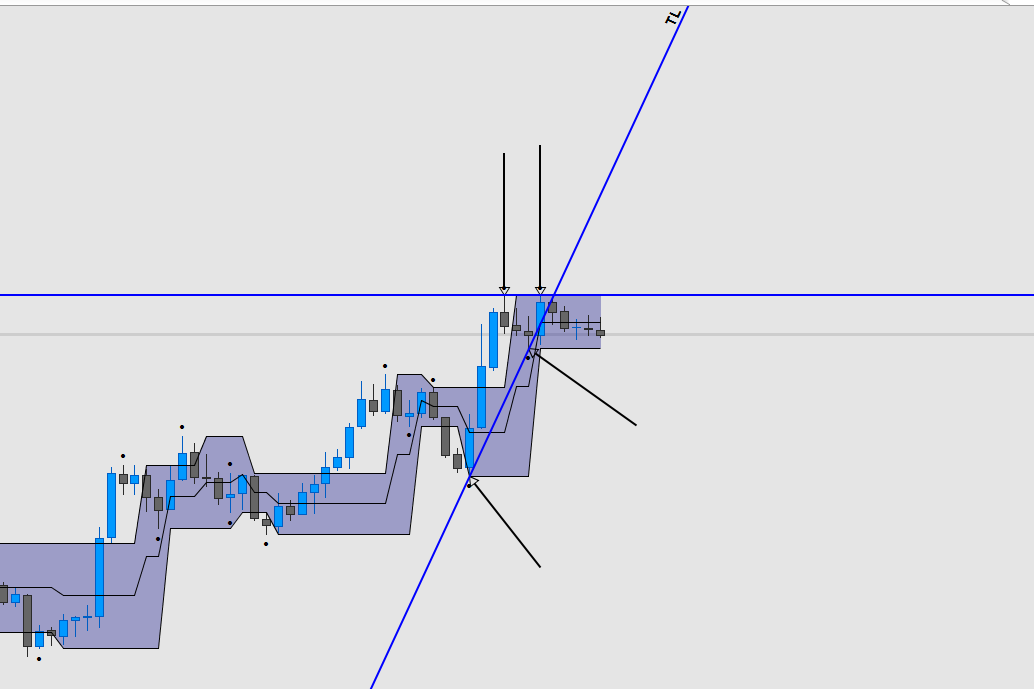
Well, I managed to code a channel and points according to my definition of a peak or trough.
The problem is the following, I would like to draw two lines, a high line that joins the last two peaks and a low line that joins the last two troughs.
The barindex of the line must be the same as that of the points drawn by the indicator, for my part, I can’t determine the barindex in time .
I would like to have a hand with this problem x)
//
//============================== Indicateur Sommet / Creux

//Calcul de distance
MX = 2*WeightedAverage[round(200/2)](close) - WeightedAverage[200](close)
MMX = WeightedAverage[round(SQRT(200))](MX)

UX = MMX+STD[200]*0.05
DX = MMX-STD[200]*0.05

ST = (UX-DX)

//============================== Definition des sommet

//Calcul des sommet
if close < close[1] and close < close[2] then
sommet = 1
creux = 0
if sommet= 1 and sommet[1] = 0 and high => high[1] and high => high[2] then
drawtext("•",barindex,high+ST)
Lsommet = high
elsif sommet= 1 and sommet[1] = 0 and high[1] > high and high[1] => high[2] then
drawtext("•",barindex[1],high[1]+ST)
Lsommet = high[1]
elsif sommet= 1 and sommet[1] = 0 and high[2] > high[1] and high[2] > high then
drawtext("•",barindex[2],high[2]+ST)
Lsommet = high[2]
endif
endif

//============================== Definition des creux

//Calcul des creux
if close > close[1] and close > close[2] then
creux = 1
sommet = 0
if creux = 1 and creux[1] = 0 and low =< low[1] and low =< low[2] then
drawtext("•",barindex,low-ST)
Lcreux = low
elsif creux = 1 and creux[1] = 0 and low[1] < low and low[1] =< low[2] then
drawtext("•",barindex[1],low[1]-ST)
Lcreux = low[1]
elsif creux = 1 and creux[1] = 0 and low[2] < low[1] and low[2] < low then
drawtext("•",barindex[2],low[2]-ST)
Lcreux = low[2]
endif
endif

TG = (Lsommet+Lcreux)/2

return Lsommet,Lcreux,TG
The code has changed, I’ve simplified it, I’ve overworked the definition of a peak or a trough.
On the other hand, the problem remains the same, how could I flip the bar index of the previous peak or trough?
//
//================================================= Indicator Top & Bottom

//================================================= Top

//===== Top
Top1 = high[2] < high[1] and high[1] > high
Top2 = high[3] < high[2] and high[2] =< high[1] and high[1] > high

XTop = Top1 or Top2

if XTop then
DrawarrowDown(Barindex[1],high[1])
endif

//================================================= Bottom

//===== Bottom
Bottom1 = low[2] > low[1] and low[1] < low
Bottom2 = low[3] > low[2] and low[2] => low[1] and low[1] < low

XBottom = Bottom1 or Bottom2

if XBottom then
DrawarrowUp(Barindex[1],low[1])
endif

return
Answer in the learning videos, as much for me…
Thank you Nicolas