


Real versus BackTest

Viewing 2 posts - 1 through 2 (of 2 total)

  • Author
    Posts
  • #190458 quote
    gfxgfx
    Participant
    Average

    Hi all,

    When improving the performance of a trading system, I like do display the position indicator which shows long/short position bar with bar size = number of contract.

    Beyond the total profit/loss of the system it is easy to capture when / where the position length and size are different.

    Now, after 18 months of live trading with proOrder, I am interested in comparing the backtest of my strategy with it actual results.

    Looking at arrow and square on the graph is not convinient.

    Is there any way to display on the chart the P&L (courbe de gain) and position panel (Positions) of the live account to compare it to a backtest ?

    Any other idea / work around is welcome šŸ™‚

    Thks,

    GrƩgoire

    #190474 quote
    GraHalGraHal
    Participant
    Master

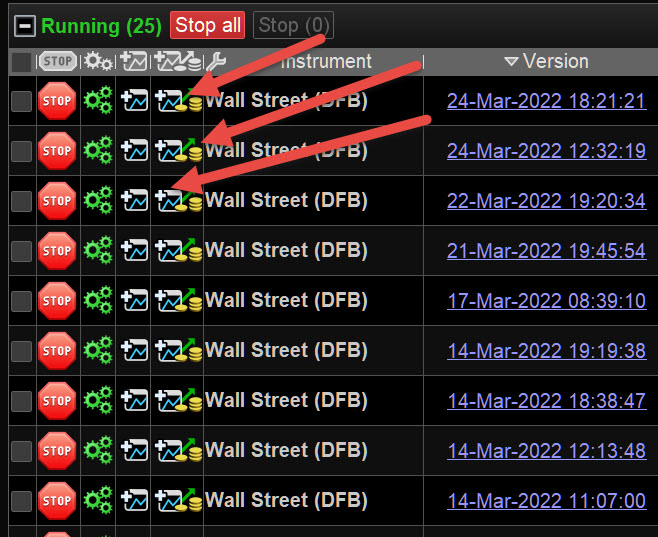
    Click on the icon at red arrowhead – see attached – and you will see the equity curve and positions of your Live Trading.

    gfx and Nicolas thanked this post
    gfx.jpg gfx.jpg
Viewing 2 posts - 1 through 2 (of 2 total)
  • You must be logged in to reply to this topic.

ProRealAI ProRealAI New

Stuck on this ProBuilder code?

Describe what this topic is trying to build, in plain English, and ProRealAI writes the ProRealTimeā„¢ indicator, screener or system for you.

Available in 7 languages
Try ProRealAI

Real versus BackTest


ProOrder: Automated Strategies & Backtesting

New Reply
Author
author-avatar
gfx @gfx Participant
Summary

This topic contains 1 reply,
has 2 voices, and was last updated by GraHalGraHal

4 years, 6 months ago.

Topic Details
Forum: ProOrder: Automated Strategies & Backtesting
Language: English
Started: 03/25/2022
Status: Active
Attachments: 1 files
ProRealCode ProRealCode
Loading...

