QQE MOD in ProB.

Viewing 3 posts - 1 through 3 (of 3 total)
  • Author
    Posts
  • #200698 quote
    fabiotrading76fabiotrading76
    Participant
    New

    //@version=4
    //By Glaz, Modified
    //
    study(“QQE MOD”)
    RSI_Period = input(6, title=’RSI Length’)
    SF = input(5, title=’RSI Smoothing’)
    QQE = input(3, title=’Fast QQE Factor’)
    ThreshHold = input(3, title=”Thresh-hold”)
    //

    src = input(close, title=”RSI Source”)
    //

    //
    Wilders_Period = RSI_Period * 2 – 1

    Rsi = rsi(src, RSI_Period)
    RsiMa = ema(Rsi, SF)
    AtrRsi = abs(RsiMa[1] – RsiMa)
    MaAtrRsi = ema(AtrRsi, Wilders_Period)
    dar = ema(MaAtrRsi, Wilders_Period) * QQE

    longband = 0.0
    shortband = 0.0
    trend = 0

    DeltaFastAtrRsi = dar
    RSIndex = RsiMa
    newshortband = RSIndex + DeltaFastAtrRsi
    newlongband = RSIndex – DeltaFastAtrRsi
    longband := RSIndex[1] > longband[1] and RSIndex > longband[1] ?
    max(longband[1], newlongband) : newlongband
    shortband := RSIndex[1] < shortband[1] and RSIndex < shortband[1] ?
    min(shortband[1], newshortband) : newshortband
    cross_1 = cross(longband[1], RSIndex)
    trend := cross(RSIndex, shortband[1]) ? 1 : cross_1 ? -1 : nz(trend[1], 1)
    FastAtrRsiTL = trend == 1 ? longband : shortband
    ////////////////////

    length = input(50, minval=1, title=”Bollinger Length”)
    mult = input(0.35, minval=0.001, maxval=5, step=0.1, title=”BB Multiplier”)
    basis = sma(FastAtrRsiTL – 50, length)
    dev = mult * stdev(FastAtrRsiTL – 50, length)
    upper = basis + dev
    lower = basis – dev
    color_bar = RsiMa – 50 > upper ? #00c3ff : RsiMa – 50 < lower ? #ff0062 : color.gray

    //
    // Zero cross
    QQEzlong = 0
    QQEzlong := nz(QQEzlong[1])
    QQEzshort = 0
    QQEzshort := nz(QQEzshort[1])
    QQEzlong := RSIndex >= 50 ? QQEzlong + 1 : 0
    QQEzshort := RSIndex < 50 ? QQEzshort + 1 : 0
    //

    Zero = hline(0, color=color.white, linestyle=hline.style_dotted, linewidth=1)

    ////////////////////////////////////////////////////////////////

    RSI_Period2 = input(6, title=’RSI Length’)
    SF2 = input(5, title=’RSI Smoothing’)
    QQE2 = input(1.61, title=’Fast QQE2 Factor’)
    ThreshHold2 = input(3, title=”Thresh-hold”)

    src2 = input(close, title=”RSI Source”)
    //

    //
    Wilders_Period2 = RSI_Period2 * 2 – 1

    Rsi2 = rsi(src2, RSI_Period2)
    RsiMa2 = ema(Rsi2, SF2)
    AtrRsi2 = abs(RsiMa2[1] – RsiMa2)
    MaAtrRsi2 = ema(AtrRsi2, Wilders_Period2)
    dar2 = ema(MaAtrRsi2, Wilders_Period2) * QQE2
    longband2 = 0.0
    shortband2 = 0.0
    trend2 = 0

    DeltaFastAtrRsi2 = dar2
    RSIndex2 = RsiMa2
    newshortband2 = RSIndex2 + DeltaFastAtrRsi2
    newlongband2 = RSIndex2 – DeltaFastAtrRsi2
    longband2 := RSIndex2[1] > longband2[1] and RSIndex2 > longband2[1] ?
    max(longband2[1], newlongband2) : newlongband2
    shortband2 := RSIndex2[1] < shortband2[1] and RSIndex2 < shortband2[1] ?
    min(shortband2[1], newshortband2) : newshortband2
    cross_2 = cross(longband2[1], RSIndex2)
    trend2 := cross(RSIndex2, shortband2[1]) ? 1 : cross_2 ? -1 : nz(trend2[1], 1)
    FastAtrRsi2TL = trend2 == 1 ? longband2 : shortband2

    //
    // Zero cross
    QQE2zlong = 0
    QQE2zlong := nz(QQE2zlong[1])
    QQE2zshort = 0
    QQE2zshort := nz(QQE2zshort[1])
    QQE2zlong := RSIndex2 >= 50 ? QQE2zlong + 1 : 0
    QQE2zshort := RSIndex2 < 50 ? QQE2zshort + 1 : 0
    //

    hcolor2 = RsiMa2 – 50 > ThreshHold2 ? color.silver :
    RsiMa2 – 50 < 0 – ThreshHold2 ? color.silver : na
    plot(FastAtrRsi2TL – 50, title=’QQE Line’, color=color.white, transp=0, linewidth=2)
    plot(RsiMa2 – 50, color=hcolor2, transp=50, title=’Histo2′, style=plot.style_columns)

    Greenbar1 = RsiMa2 – 50 > ThreshHold2
    Greenbar2 = RsiMa – 50 > upper

    Redbar1 = RsiMa2 – 50 < 0 – ThreshHold2
    Redbar2 = RsiMa – 50 < lower
    plot(Greenbar1 and Greenbar2 == 1 ? RsiMa2 – 50 : na, title=”QQE Up”, style=plot.style_columns, color=#00c3ff, transp=0)
    plot(Redbar1 and Redbar2 == 1 ? RsiMa2 – 50 : na, title=”QQE Down”, style=plot.style_columns, color=#ff0062, transp=0)

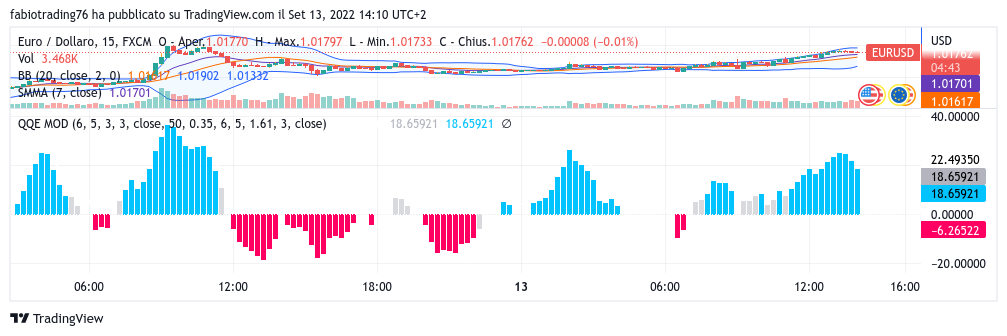
    qqe-mod.png qqe-mod.png
    #200730 quote
    robertogozzirobertogozzi
    Moderator
    Legend
    #200759 quote
    fabiotrading76fabiotrading76
    Participant
    New

    buongiorno

    N0 quello è il QQE originale quello che cerco io è il QQE MOD cioè modificato e migliorato.

Viewing 3 posts - 1 through 3 (of 3 total)
  • You must be logged in to reply to this topic.

ProRealAI ProRealAI New

Stuck on this ProBuilder code?

Describe what this topic is trying to build, in plain English, and ProRealAI writes the ProRealTime™ indicator, screener or system for you.

Available in 7 languages
Try ProRealAI

QQE MOD in ProB.


ProBuilder: Indicatori & Strumenti Personalizzati

New Reply
Author
Summary

This topic contains 2 replies,
has 2 voices, and was last updated by fabiotrading76fabiotrading76
4 years ago.

Topic Details
Forum: ProBuilder: Indicatori & Strumenti Personalizzati
Language: Italian
Started: 09/13/2022
Status: Active
Attachments: 1 files
ProRealCode ProRealCode
Loading...